International Journal of Economics and Finance; Vol. 9, No. 10; 2017 ISSN 1916-971X E-ISSN 1916-9728 Published by Canadian Center of Science and Education
Applicability of Fuzzy TOPSIS Method in Optimal Portfolio Selection and an Application in BIST Oguzhan Ece1 & Ahmet Serhat Uludag2 1
Department of Banking and Finance, Faculty of Economics and Administrative Sciences, Erzincan University, Erzincan, Turkey 2
Department of International Trade and Logistics, Faculty of Economics and Administrative Sciences, Ondokuz Mayıs University, Samsun, Turkey Correspondence: Oguzhan Ece, Department of Banking and Finance, Faculty of Economics and Administrative Sciences, Erzincan University, Yalnızbag Campus, Erzincan, Turkey. Tel: 90-446-225-2092-41051. E-mail:
[email protected] Received: August 4, 2017
Accepted: August 25, 2017
Online Published: September 5, 2017
doi:10.5539/ijef.v9n10p107
URL: https://doi.org/10.5539/ijef.v9n10p107
Abstract General structure of saving-investment cycle and the effectiveness of this structure are included in the most significant issues of the financial system. One of the points of intervention in providing an effective saving-investment cycle is possible through channeling the savings toward optimal investment fields. This study aims at detecting the existence of alternative methods in determining optimal selection combination in the risk and revenue perspective of individual and corporate investors who would like to evaluate their savings in capital markets. For this purpose, the applicability of Fuzzy TOPSIS method, one of the multi-criteria decision making techniques in optimal portfolio selection was researched. The applicability of the stock investment alternatives ranked according to Fuzzy TOPSIS method was examined by comparing them to the optimal selection results determined according to Markowitz, one of the modern portfolio management techniques. In the study where performance indexes were used as assessment criteria the results of both methods were discussed in terms of risk at a certain revenue level and revenue at a certain risk level through Johnson and Sharp Indexes. The results obtained determined that the Fuzzy TOPSIS portfolio alternatives created using Fuzzy TOPSIS method revealed quite positive results in terms of performance, revenue and risk and pointed at applicability of Fuzzy TOPSIS method in optimal portfolio selection as well. Keywords: optimal portfolio selection, fuzzy TOPSIS, markowitz portfolio optimization method 1. Introduction Lexical meaning of investment is “the money invested into an income-generating movable or immovable property” (http://tdkterim.gov.tr/bts/). As can be understood from the definition, to generate income, the deposit should be attached to an asset. Today, increased variety of options that the investors can attach their deposits to helps decrease the risks they face. Securities, which is one of these options, are now among the main investment instruments through which investors can use their deposits, obtain income, and distribute the risk by diversification. In this context, obtaining the desired return is closely related to the determination of the securities that will provide the highest return, or to the creation of an optimal portfolio that includes these securities. The optimal portfolio is the choice of the security component that will provide the highest return at a certain risk level that the investor can bear. The portfolio selection that constitutes the decision phase of how an investor will distribute his or her wealth in a securities basket is a technical process that constitutes the third stage of portfolio management. The only determinant of the process is based on return and risk comparisons. Portfolio selection, which has become one of the most important area of study in modern finance, is referred to in the literature as Modern Portfolio theory, which is based on the pioneering work of Markowitz and Sharpe (Solimanpur et al., 2015; Ceylan & Korkmaz, 1998). The basic assumptions of the theory can be summarized as follows (Konuralp, 2005; Yoruk, 2000): a)
It is based on maximizing utility. 107
ijef.ccsenet.org
International Journal of Economics and Finance
Vol. 9, No. 10; 2017
b) Hedging is based on diversification. c)
Expected return and risk are accepted as the main determinants of investor decisions.
d) Investors' risk and return expectations are homogeneous and based on the principle of maximization of the return at a certain risk level. e)
Efficient market conditions apply.
f)
Investors have the identical time horizon.
Optimal portfolio selection in modern portfolio management, in which the relationship between the securities becomes prominent in terms of hedging, is mathematically calculated by quadratic programming and is called “effective portfolio”. Effective portfolios represent securities that have the highest return at the same risk level or that have the lowest risk at the same return level. The curve showing the effective portfolios at different risk and return levels is defined as the “Effective Boundary” and each security component along that boundary represents the optimal investment component for the investor (Karan, 2011). Considering everything explained up to here, it is understood that to form an optimal portfolio and/or to select the securities to form an optimal portfolio is a decision process that is shaped primarily by risk and expected return. Cognitively, decision is defined in the Turkish Dictionary of the Turkish Language Society as “the definite judgment reached by thinking about a job or a problem” (http://tdkterim.gov.tr/bts/); whereas in terms of business management, decision is defined as “the choice the manager or any other person makes in any subject” (Kocel, 2005). In essence, the gist of decision making is the pursuit of; “choosing the most suitable or the most appropriate one among the choices after thinking thoroughly on a subject”(Ulgen & Mirze, 2010). Similar to all decision-making processes, there are many alternatives for investors who are also decision makers in the selection of optimal portfolios, and there are quite a number of decision criteria that can be used to evaluate these alternatives. No doubt, within the scope of this study, what is meant by alternatives is the securities, and what is meant by decision criteria is the financial ratios. Particularly in the field of business management, techniques called multi-criteria decision making methods are frequently used by researchers for solution, when there are a large number of decision criteria and also problems about decision making that require consideration of a large number of alternatives. Some of these techniques only allow the use of the quantitative data whereas some allow the use of both qualitative and quantitative data. Among these techniques TOPSIS, which is one of the traditional multi-criteria decision making methods, focuses on identifying and choosing the alternative that is farthest from the negative ideal solution and closest to the positive ideal solution (Deng et al., 2000); it is a ranking methodology developed by Hwang and Yoon in 1981 (Hsu et al., 2015); and it comprises 6 steps, which are: calculating the normalized decision matrix, calculating the weighted normalized decision matrix, determining the positive and negative ideal solutions, calculating the distribution measures, calculating the proximity to the ideal solution, and the decision criteria should be measurable and comparable (Chen & Hwang, 1992). Traditional multi-criteria decision making techniques, which also include TOPSIS, can be inadequate for the types of problems encountered in real life. While this inadequacy can be due to the use of linguistic expressions by those who are at the position of decision making in the evaluation of alternatives or decision points, it can also be due to the classical logic based resolution algorithm of traditional multi-criteria decision making techniques. To eliminate these deficiencies, when evaluating the decision points based on the decision criteria, in addition to use linguistic expressions such as “very poor”, “poor”, “medium poor”, “fair”, medium good”, “good” and “very good”, the use of fuzzy logic instead of classical logic can provide great convenience to the researchers at the point of resolution. While linguistic expressions are highly advantageous when decision criteria have subjectivity or where past experience of decision makers is important for evaluation, the use of fuzzy logic shows a structure suitable for problems encountered in real life by allowing some relationships that can not be included in the membership function according to classical logic to be included in the solution process (Chen, 2000). In the Fuzzy Logic Theory developed by Luftu-zade in 1965 (Altas, 1999), contrary to classical logic, a member's membership relation to the relevant set is determined using a scale that includes intermediate values or expressions instead of definitive values or expressions, and the probability of occurrence of fuzzy states can be determined (Vural, 2002). Since the fuzzy logic is more useful than classical logic and the expertise, past experience and future expectations of decision makers must be taken into consideration in order to solve the type of problem handled in this study, Fuzzy TOPSIS method, which includes the superior aspects of fuzzy logic and traditional TOPSIS method, is used.
108
ijef.ccsenet.org
International Journal of Economics and Finance
Vol. 9, No. 10; 2017
Fuzzy TOPSIS method has been used to solve many different problems in the field of business management. In this context, before explaining the algorithm of the method, summary of some of the studies in which Fuzzy TOPSIS was used is provided in Table 1. Table 1. Summary information on some of the studies in which fuzzy TOPSIS method was used Author(s) Chen Chen Tsao Bottani and Rizzi Chen et al. Yong Ecer Dundar et al. ** Ecer Ecer Eleren and Ersoy Kahraman et al. Ozdemir ve Secme Mahdi and Hossein Onut and Soner Ozturk et al. Salehi and Moghaddam Ecer et al. Kucuk and Ecer Gokdalay and Evren Shahanaghi and Yazdian Sun and Lin Bagheri and Tarokh Tirmikcioglu and Cinar Erginel et al. Tan et al. Baskaya and Ozturk Eraslan and Tansel Eleren and Yilmaz Erkayman et al. Madi and Tap Mangir and Erdogan Ozcakar and Demir Ashrafzadeh et al. Awasthi and Chauhan Buyukozkan and Cifci Huang and Peng Paksoy et al. Uysal and Tosun Yayla et al. Alemi and Akram Sedaghat Kahraman et al. Maity and Chakraborty Prascevic and Prascevic Sari Vatansever Uludag and Deveci Uludag and Deveci Mahdevari et al.
Year 2000 2001 2003 2006 2006 2006 2006 2007 2007 2007 2007 2007 2009 2008 2008 2008 2008 2009 2009 2009 2009 2009 2010 2010 2010 2010 2011 2011 2011 2011 2011 2011 2011 2012 2012 2012 2012 2012 2012 2012 2013 2013 2013 2013 2013 2013 2013 2013 2013 2014
Topic Selection of system analysis engineer Selection of location for distribution center Assessment of equity investments Third party logistics service provider choice Supplier evaluation and selection Site selection Sales staff assessment Evaluation of web sites of virtual stores Choosing a store location Sales staff assessment and selection Evaluation of marble block cutting methods Logistics information technology Strategic supplier choice Project and contractor selection Location selection Choosing a transportation company Project evaluation and selection Optimal portfolio selection Supplier choice Airport performance evaluation Supplier choice Evaluation of Web Based Shopping Sites Supplier choice Site selection GSM Sector Construction project selection Sales staff selection Investment region selection Selection of supplier for textile firm Logistics center location selection Investment boards choice Analysis of economic performances of countries Supplier choice Warehouse location selection Sustainable city logistics planning Choice of green suppliers Evaluation of the competitive structure of tourism industry Development of organizational strategy in distribution channel management Selection of computerized maintenance management system Supplier choice Evaluation of the leanness of manufacturing systems Productivity development in the banking sector Evaluation of investment alternatives in the field of education Material selection Evaluation of optimal alternatives for resource conservation RFID technology selection Supplier choice Supplier choice Site Selection Occupational health and safety
109
ijef.ccsenet.org
International Journal of Economics and Finance
Mokhtari et al. Yildiz and Yildiz Ardakani et al. Chen and Lu Kabra and Ramesh Arslan and Yildiz Gul and Uludag Akyuz and Kilinc
2014 2014 2015 2015 2015 2015 2016 2016
Vol. 9, No. 10; 2017
Selection of best well control system ERP software selection Evaluation of service quality Evaluation of competitive structures of insurance companies Humanitarian supply chain management Site selection for sports schools Choosing a charismatic leader Site selection for a private hospital
2. Mathematical Form of Fuzzy TOPSIS Method Although basic stages of the Fuzzy TOPSIS method is the same as the traditional TOPSIS method, its requirement of some special calculations in terms of mathematics makes it slightly operationally complicated. The main stages of the method are presented below in a manner similar to the studies previously shown in Table 1. Stage 1: In the first phase, the “d” number of decision makers, an ensemble of the group of experts, decision criteria, and identification of alternatives must be defined. In this context, a group of decision makers was formed. “j” represents decision criteria, “i” represents the alternatives; and of 21 decision criteria, 15 alternatives were chosen to be used. According to this, 𝑑 = (1, 2 ,3), 𝑗 = (1, 2, … , 𝑝) and 𝑖 = (1, 2, … , 𝑞). Stage 2: In the second stage, the linguistic variables necessary for the weighting of the criteria and for the evaluation of the alternatives according to the criteria should be determined. The linguistic variables to be used in this context and their corresponding triangular fuzzy numbers are determined and shown in Table 2. Table 2. Linguistic variables and corresponding triangular fuzzy numbers Weighting of the Criteria
Ratings of Alternatives
Variable
Triangle Fuzzy Number
Variable
Triangle Fuzzy Number
Very Low (VL) Low (L) Medium Low (ML) Medium(M) Medium High (MH) High (H) Very High (VH)
(0, 0, 0.1) (0, 0.1, 0.3) (0.1, 0.3, 0.5) (0.3, 0.5, 0.7) (0.5, 0.7, 0.9) (0.7, 0.9, 1) (0.9, 1, 1)
Very Poor (VP) Poor (P) Medium Poor (MP) Fair (F) Medium Good (MG) Good (G) Very Good (VG)
(0, 0, 1) (0, 1, 3) (1, 3, 5) (3, 5, 7) (5, 7, 9) (7, 9, 10) (9, 10, 10)
Sourse: Chen, 2000.
Stage 3: In the third stage expert opinions are collected for the weighting of the criteria and grading the alternatives. Stage 4: In this stage, the weights of the criteria and the importance ratings of the alternatives according to the criteria are calculated by the mathematical formulas shown in equations (1) and (2) respectively. In the equations, “d” represents the experts, “i” the alternatives, and “j” the decision criteria (𝑑 = 1, 2, 3; 𝑖 = 1, … , 𝑝 𝑎𝑛𝑑 𝑗 = 1, … , 𝑞). 1 ̃𝑗 = [(̃𝑗1 ) + (̃𝑗2 ) + (̃𝑗3 )]
(1)
1 1 𝑡̃𝑖𝑗 = [(𝑡̃𝑖𝑗 ) + (𝑡̃𝑖𝑗2 ) + (𝑡̃𝑖𝑗3 )]
(2)
𝑑
𝑑
Stage 5: In the fifth stage, fuzzy initial decision matrix indicated as “S̃” and fuzzy weight decision matrix ̃ ” are generated. indicated as “H 𝑡11 𝑆̃ = [ … 𝑡𝑗1
… … …
𝑡1𝑖 … ] (𝑖 = 1, 2, … , 𝑝) 𝑣𝑒 (𝑗 = 1, 2, … , 𝑞) 𝑡𝑖𝑗
̃ = [̃1 , ̃2 , … , ̃𝑗 ] 𝐻
(𝑗 = 1, 2, … , 𝑞)
(3)
(4)
Stage 6: In the sixth stage, a normalized decision matrix, represented by equation (5), is generated. Here, 𝑡𝑖𝑗 = (𝑥𝑖𝑗 , 𝑦𝑖𝑗 , 𝑧𝑖𝑗 ) is a triangular fuzzy number and “F” represents a benefit, “M” represents a cost: 110
ijef.ccsenet.org
International Journal of Economics and Finance
(𝑖 = 1, 2, … , 𝑝) 𝑣𝑒 (𝑗 = 1, 2, … , 𝑞)
𝐺 = [𝑔̃𝑖𝑗 ]𝑝𝑥𝑞 ̃𝑔𝑖𝑗 = ( 𝑔̃𝑖𝑗 = (
𝑥𝑖𝑗 𝑦𝑖𝑗 𝑧𝑖𝑗 , , ) 𝑧𝑗∗ 𝑧𝑗∗ 𝑧𝑗∗
𝑥𝑗− 𝑥𝑗− 𝑥𝑗− , , ) 𝑧𝑖𝑗 𝑦𝑖𝑗 𝑥𝑖𝑗
𝑧𝑗∗ = 𝑚𝑎𝑥 ⏟ 𝑧𝑖𝑗
Vol. 9, No. 10; 2017
(5)
𝑗∈𝐹 𝑗∈𝑀 𝑗∈𝐹
𝑖
𝑥𝑗− = 𝑚𝑖𝑛 ⏟ 𝑥𝑖𝑗
𝑗∈𝑀
𝑖
̃ ” and shown in Stage 7: In the seventh stage, weighted normalized fuzzy decision matrix represented as “𝑊 Equation (6) is formed. ̃ = [𝑤 𝑊 ̃𝑖𝑗 ]𝑝𝑥𝑞
(𝑖 = 1, 2, … , 𝑝) 𝑣𝑒 (𝑗 = 1, 2, … , 𝑞)
(6)
In this equation (6):
𝑤 ̃𝑖𝑗 = 𝑔̃𝑖𝑗 (. )̃𝑖𝑗 (𝑤 ̃𝑖𝑗 , ∀𝑖, 𝑗) Stage 8: In this stage, the Fuzzy Positive Ideal Solution (FPIS, 𝑈 ∗ ) shown in equation no (7) and Fuzzy Negative Ideal Solution (FNIS, 𝑈 − ) shown in equation no (8) are calculated. 𝑈 ∗ = (𝑤 ̃1∗ , 𝑤 ̃2∗ , 𝑤 ̃3∗ , … , 𝑤 ̃𝑗∗ )
(7)
(𝑤 ̃1− , 𝑤 ̃2− , 𝑤 ̃3− , … , 𝑤 ̃𝑗− ) 𝑤 ̃𝑗∗ = (1,1,1) 𝑤 ̃𝑗− = (0,0,0)
(8)
−
𝑈 =
(𝑗 = 1, 2, … , 𝑞)
Stage 9: The relative distances of each alternative from the values of FPIS and FNIS are calculated with the help of Equations (9) and (10), respectively. In the equations, 𝑣(. , . ) represents the distance between two triangular fuzzy numbers (Chen, 2000; Ecer, 2006). 𝑞 𝑣𝑖∗ = ∑𝑗=1 𝑣(𝑤 ̃𝑖𝑗 , 𝑤 ̃𝑗∗ ) (𝑖 = 1,2, … , 𝑝)
𝑣𝑖−
𝑞 = ∑𝑗=1 𝑣(𝑤 ̃𝑖𝑗 , 𝑤 ̃𝑗− ) (𝑖 = 1,2, … , 𝑝)
(9) (10)
Stage 10: The proximity coefficient (PC) for each alternative is calculated by the formula shown in Equation (11) and the alternatives are sorted according to the proximity coefficients. 𝑃𝐶 =
𝑣𝑖− ∗ 𝑣𝑖 +𝑣𝑖−
(11)
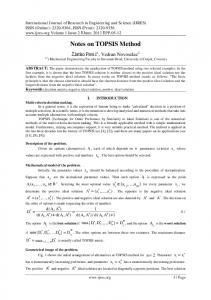
3. An Application for Optimal Portfolio Selection In this part of the study, a pool of all stocks offered by various brokerage houses for investors was created, then the common stocks were selected and sorted according to the Fuzzy TOPSIS method. A portfolio was created according to the ranking, and the performance of the portfolio was determined and compared with the performance of the portfolio constructed according to the traditional portfolio theory. In this way, the applicability of Fuzzy TOPSIS method in optimal portfolio selection has been tried to be determined. 3.1 Ranking of Alternatives According to Fuzzy TOPSIS Method The general view of the optimal portfolio selection problem, which is to be solved by the fuzzy TOPSIS method, is as shown in Figure 1; and according to the Fuzzy TOPSIS Method algorithm presented in section two, the solution is shown stage by stage.
111
ijef.ccsenet.org
International Journal of Economics and Finance
Vol. 9, No. 10; 2017
ARCLK Price/Earning Ratio Basıc Expressıon
Price
EREGL
Varıables for Stock Free float Ratio TUPRS Trading Value
Ranking of brokerage house recommendations by Fuzzy TOPSIS
Market Value
TTKOM
Market Value/Book Value BANVT Free Distribution of Shares Current Ratio KOZAL Liquidity Ratio Financial Ratios Inventory Turnover Financial Leverage Ratio
Risk
TAVHL AEFES
Beta AKSA Risk of not meeting expectations
Return
Net Profit
FROTO
Net Profit Margin
MGROS
Return on Assets
ENKAI
Return on Equity Earning Per Share Global Economic Developments Expectation
PETKM TEKFN
Local Economic Developments Sectoral Situation
SELEC
Figure 1. The usege of the optimal portfolio selection in fuzzy TOPSIS method Stage 1: Due to the method's essence, a decision-maker group must be formed from those who are experts in stock investments. In this context, investment advisors who are experts on stock investments in portfolio management companies and people who are also experts in these areas have been requested to provide their evaluations. A three person decision making group consisting of two expert portfolio managers and one academician who received a favorable response on the basis of the negotiations was established. Therefore, the number of decision makers constituting the basis of this stage, (d), was determined as 3. After the formation of the decision making group, the final decision on the criteria determined according to the literature was made on the basis of the interviews with the decision makers. In this context; The main explanatory variables of the stock were grouped under five main headings as “basic expression variables for stock”, “financial ratios”, “risk”, “return” and “expectation” and a total of 21 sub-decision criteria grouped under these main headings were determined. Following this, the stocks that are common among the stocks recommended by the brokerage houses, that is, 15 stocks recommended by all brokerage houses, were determined as the decision points, or in other words, as alternatives. Table 3 below shows the decision criteria used to evaluate the alternatives and the explanations, and Table 4 shows the decision points.
112
ijef.ccsenet.org
International Journal of Economics and Finance
Vol. 9, No. 10; 2017
Table 3. Decision criterias and description group Description Group
THE MAIN EXPLANATORY VARIABLES
LIQUIDITY AND FINANCIAL STRUCTURE
RISK
RETURN
EXPECTATION
The Name of Decision Criteria Price / Profit Rate Price Free Float Ratio Trading Volume Market Value Market Value/Book Value Free Distribution of Shares Current Ratio Liquidity Ratio Inventory Turnover Financial Leverage Ratio Beta Risk of not meeting expectations Net Profit Net Profit Margin Return on Assets Return on Equity Earning Per Share Global Economic Developments Local Economic Developments Sectoral Situation
No C1 C2 C3 C4 C5 C6 C7 C8 C9 C10 C11 C12 C13 C14 C15 C16 C17 C18 C19 C20 C21
Table 4. The decision points Stock Name ARCLK EREGL TUPRS TTKOM BANVT
Stock No A1 A2 A3 A4 A5
Stock Name KOZAL TAV HL AEFES AKSA FROTO
Stock No A6 A7 A8 A9 A10
Stock Name MGROS ENKAI PETKM TEKFN SELEC
Stock No A11 A12 A13 A14 A15
Stage 2: After establishing the decision making group, determining decision criteria and alternatives, appropriate linguistic variables and their corresponding fuzzy numbers have been determined to evaluate the criteria and alternatives. At this stage, Chen's study has been accepted as a reference, and the linguistic variables used in Table 2 previously mentioned in the second chapter and their corresponding triangular fuzzy numbers are shown. Stage 3: In this stage, opinions of experts on decision criteria and points were collected through linguistic variables shown in Table 2. Stage 4: In this stage, the weight of the criteria and the significance ratings of the alternatives are calculated using the formulas shown in equations (1) and (2), where the algorithm of the Fuzzy TOPSIS method is shown. The linguistic evaluations that experts use for decision criteria and alternatives were fuzzed using the triangular fuzzy numbers shown in Table 2. The calculations for fuzzing the linguistic variables are shown in Tables 5 and 6 below only for decision criterion (C1) and decision point (A6), respectively. Table 5. Blurring linguistic variables for decision criteria (C1) C1 Decision Makers (DM) DM1 DM2 DM3
Linguistic Variable MH VH H
x 0.5 0.9 0.7 0.7
Average
“C1: Price / Profit Ratio” Calculation of Weight of Decision Criteria: h̃1 = (0.5+0.9+0.7)/3 = 0.7 113
y 0.7 1.0 0.9 0.866667
Z 0.9 1.0 1.0 0.966667
ijef.ccsenet.org
International Journal of Economics and Finance
Vol. 9, No. 10; 2017
h̃1 = (0.7+1.0+0.9)/3 = 0.866667 h̃1 = (0.9+1.0+1.0)/3 = 0.966667 h̃1 = (0.7; 0.866667; 0.96667) h̃1 = (0.7; 0.866667; 0.96667) Table 6. Determining the significance of the decision point (A6) and blurring it Decision Makers DM1 DM2 DM3
Linguistic Variable MG MP G
Low 5 1 7 4.3333
Average
C1 Medium 7 3 9 6.3333
Upper 9 5 10 8
Determination of the Degree of Importance of “A6: Koza Gold Decision Point” According to “C1: Price / Profit Rate” and Fuzzing: 𝑡̃61 = (5+1+7)/3 = 4.3333; 𝑡̃61 = (7+3+9)/3 = 6.3333; 𝑡̃61 = (9+5+10)/3 = 8 𝑡̃61 = (4.3333; 6.3333; 8.0000) Stage 5: In this stage, the fuzzy decision and fuzzy weight matrices are shown by equations (3) and (4) at the part where the algorithm of Fuzzy TOPSIS method is. The fuzzy decision matrix, represented by, 𝑆̃ is not shown because it was too large. The resulting fuzzy weight matrix is shown in Table 7. Table 7. Fuzzy weight matrix Criteria C1 C2 C3 C4 C5 C6 C7 C8 C9 C10 C11
x 0.700000 0.466667 0.266667 0.633333 0.700000 0.700000 0.266667 0.266667 0.266667 0.266667 0.566667
Tringular Fuzzy Number y 0.866667 0.600000 0.433333 0.800000 0.866667 0.866667 0.433333 0.400000 0.400000 0.400000 0.733333
z 0.966667 0.700000 0.633333 0.933333 0.966667 0.966667 0.633333 0.566667 0.566667 0.566667 0.866667
Criteria C12 C13 C14 C15 C16 C17 C18 C19 C20 C21
x 0.466667 0.433333 0.333333 0.500000 0.566667 0.700000 0.700000 0.566667 0.566667 0.633333
Tringular Fuzzy Number y 0.633333 0.633333 0.466667 0.700000 0.766667 0.866667 0.866667 0.733333 0.733333 0.800000
z 0.766667 0.833333 0.633333 0.900000 0.933333 0.966667 0.966667 0.833333 0.833333 0.900000
Stage 6: In the sixth stage values normalized based on the fuzzy decision matrix were calculated and normalized fuzzy decision matrix, shown in equation (5) at the part where Fuzzy TOPSIS method algorithm is, was generated. The normalized fuzzy decision matrix cannot be shown due to its size; only the normalization process of “A6: Koza Gold” decision point according to “C1: Price / Profit Rate” was given below. g̃ 61 = (4.3333 / 8.66667; 6.3333 / 8.66667; 8 / 8.66667) g̃ 61 = (0.5; 0.73; 0.92) Stage 7: In this stage, the weighted normalized fuzzy values were calculated using the normalized fuzzy decision ̃ in matrix generated in the sixth stage, and a weighted normalized fuzzy decision matrix represented by 𝑊 Equation (6) was generated but could not be shown due to its size. As an example of the calculation of the weighted normalized values, only the weighted normalization process of “A6: Koza Gold” alternative to “C1: Price/Profit Rate” was shown. Calculation of Weighted Normalized Value of “A6: Koza Gold” Alternative by “C1: Price / Profit Rate”: g̃ 6 = (0.5; 0.73; 0.92)
114
ijef.ccsenet.org
International Journal of Economics and Finance
Vol. 9, No. 10; 2017
h̃1 = (0.7; 0.866667; 0.96667) w ̃ 61 = (0.5*0.7; 0.73*0.866667; 0.92*0.966667) w ̃ 61= (0.35; 6.33; 0.89) Stage 8: In the eighth stage, Fuzzy Positive value represented as (𝑈 ∗ ) in Equation (7) and Negative Ideal Solution values represented as (𝑈 − ) in Equation (8) were calculated and shown in Tables 8 and 9, respectively. Table 8. FPIS values (U ∗ ) Criteria C1 C2 C3 C4 C5 C6 C7 C8 C9 C10 C11 C12 C13 C14 C15 C16 C17 C18 C19 C20 C21 Total
A1 0.41 0.35 0.34 0.54 0.55 0.33 0.43 0.37 0.35 0.32 0.43 0.33 0.47 0.34 0.44 0.42 0.35 0.51 0.35 0.31 0.33 8.26
A2 0.55 0.31 0.39 0.37 0.59 0.37 0.44 0.47 0.47 0.26 0.42 0.33 0.43 0.40 0.44 0.44 0.34 0.56 0.35 0.35 0.37 8.66
A3 0.37 0.38 0.30 0.59 0.70 0.33 0.36 0.30 0.27 0.37 0.47 0.33 0.43 0.45 0.40 0.34 0.47 0.56 0.39 0.35 0.37 8.53
A4 0.32 0.28 0.30 0.41 0.72 0.47 0.32 0.30 0.29 0.35 0.47 0.33 0.43 0.35 0.40 0.44 0.61 0.72 0.39 0.39 0.41 8.71
A5 0.93 0.50 0.38 0.85 0.70 0.74 0.41 0.39 0.47 0.39 0.42 0.41 0.40 0.61 0.87 0.90 0.94 0.94 0.39 0.39 0.41 12.43
A6 0.37 0.31 0.39 0.68 0.37 0.42 0.41 0.30 0.33 0.37 0.39 0.33 0.47 0.37 0.71 0.57 0.61 0.65 0.39 0.39 0.41 9.24
Decision Points A7 A8 A9 0.36 0.42 0.37 0.28 0.35 0.38 0.34 0.30 0.29 0.33 0.54 0.50 0.42 0.50 0.41 0.56 0.12 0.52 0.35 0.35 0.37 0.25 0.32 0.39 0.33 0.42 0.42 0.37 0.29 0.35 0.43 0.35 0.42 0.37 0.32 0.40 0.47 0.43 0.47 0.32 0.45 0.32 0.40 0.51 0.40 0.48 0.48 0.37 0.42 0.52 0.33 0.51 0.72 0.23 0.39 0.39 0.39 0.39 0.39 0.39 0.41 0.41 0.41 8.18 9.20 8.14
A10 0.37 0.35 0.39 0.50 0.33 0.47 0.40 0.32 0.31 0.30 0.39 0.37 0.40 0.29 0.37 0.34 0.30 0.42 0.39 0.39 0.41 7.80
A11 0.93 0.59 0.43 0.64 0.40 0.69 0.41 0.34 0.35 0.35 0.39 0.37 0.47 0.61 0.87 0.90 0.94 0.91 0.39 0.39 0.41 11.78
A12 0.32 0.28 0.34 0.33 0.45 0.62 0.43 0.41 0.45 0.46 0.47 0.53 0.47 0.40 0.51 0.57 0.56 0.75 0.39 0.39 0.41 9.53
A13 0.32 0.31 0.30 0.65 0.45 0.34 0.41 0.42 0.44 0.30 0.39 0.33 0.47 0.46 0.63 0.41 0.33 0.52 0.39 0.39 0.41 8.68
A14 0.41 0.38 0.32 0.68 0.32 0.52 0.38 0.37 0.29 0.32 0.39 0.33 0.40 0.29 0.51 0.57 0.61 0.51 0.39 0.39 0.41 8.79
A15 0.37 0.28 0.32 0.55 0.50 0.62 0.38 0.32 0.29 0.35 0.47 0.33 0.47 0.34 0.55 0.61 0.71 0.83 0.39 0.39 0.41 9.48
A4 0.75 0.50 0.38 0.62 0.21 0.53 0.37 0.32 0.36 0.26 0.32 0.48 0.39 0.37 0.62 0.60 0.43 0.32 0.33 0.31 0.33 8.77
A5 0.06 0.22 0.28 0.13 0.25 0.26 0.21 0.22 0.13 0.20 0.35 0.38 0.44 0.04 0.05 0.05 0.06 0.06 0.33 0.31 0.33 4.36
A6 0.68 0.45 0.26 0.28 0.58 0.59 0.21 0.32 0.30 0.23 0.42 0.48 0.35 0.34 0.25 0.45 0.43 0.37 0.33 0.31 0.33 7.98
Decision Points A7 A8 A9 0.67 0.62 0.68 0.50 0.41 0.36 0.33 0.38 0.39 0.71 0.46 0.51 0.52 0.45 0.55 0.39 0.26 0.49 0.29 0.29 0.28 0.39 0.30 0.21 0.29 0.18 0.18 0.22 0.31 0.26 0.37 0.46 0.35 0.44 0.47 0.38 0.35 0.39 0.35 0.40 0.23 0.40 0.62 0.49 0.62 0.55 0.55 0.67 0.63 0.52 0.73 0.53 0.32 0.81 0.33 0.33 0.33 0.31 0.31 0.31 0.33 0.33 0.33 9.18 8.05 9.20
A10 0.68 0.41 0.26 0.51 0.62 0.53 0.24 0.3 0.32 0.32 0.42 0.43 0.44 0.44 0.65 0.71 0.77 0.64 0.33 0.31 0.33 9.67
A11 0.06 0.14 0.22 0.37 0.56 0.31 0.21 0.27 0.27 0.26 0.40 0.44 0.35 0.04 0.05 0.05 0.06 0.09 0.33 0.31 0.33 5.14
A12 0.73 0.50 0.33 0.71 0.52 0.37 0.22 0.19 0.16 0.12 0.32 0.25 0.35 0.30 0.49 0.45 0.48 0.27 0.33 0.31 0.33 7.73
A13 0.73 0.45 0.38 0.32 0.50 0.66 0.24 0.17 0.16 0.32 0.40 0.48 0.35 0.23 0.34 0.63 0.73 0.52 0.33 0.31 0.33 8.59
A14 0.66 0.38 0.36 0.32 0.66 0.49 0.29 0.25 0.35 0.29 0.42 0.48 0.44 0.44 0.49 0.45 0.43 0.53 0.33 0.31 0.33 8.69
A15 0.68 0.50 0.36 0.46 0.46 0.37 0.25 0.30 0.36 0.26 0.32 0.48 0.35 0.38 0.44 0.40 0.32 0.18 0.33 0.31 0.33 7.84
Table 9. FNIS values (U − ) Criteria C1 C2 C3 C4 C5 C6 C7 C8 C9 C10 C11 C12 C13 C14 C15 C16 C17 C18 C19 C20 C21 Total
A1 0.66 0.41 0.33 0.46 0.41 0.70 0.22 0.25 0.27 0.29 0.37 0.48 0.35 0.38 0.57 0.60 0.69 0.53 0.38 0.39 0.41 9.15
A2 0.49 0.45 0.26 0.67 0.36 0.65 0.17 0.12 0.13 0.37 0.35 0.48 0.39 0.31 0.58 0.60 0.71 0.48 0.38 0.35 0.38 8.68
A3 0.68 0.37 0.38 0.41 0.25 0.70 0.33 0.32 0.38 0.22 0.30 0.48 0.39 0.23 0.62 0.71 0.57 0.48 0.33 0.35 0.38 8.89
115
ijef.ccsenet.org
International Journal of Economics and Finance
Vol. 9, No. 10; 2017
Stage 9: In this stage, at the part where the algorithm of the method is explained, the distance of the decision points to FPIS values represented as (𝑣𝑖∗ ) in Equation (9) and FNIS values represented as (𝑣𝑖− ) in Equation (10) were calculated and shown in Table 10. Stage 10: The distances calculated with the formulas in Equations (9) and (10) are used in the formula shown in the formula depicted as equation (11) in the part where the algorithm of the method is included and the proximity coefficient of each decision point was calculated (PCi). The calculation of the proximity coefficient of the “A6: Koza Gold” decision point alone is shown below; calculated proximity coefficients of other decision points and the ranking based on these coefficients are given in Table 10. PC6 = 9.15/(8.26+9.15)
PC6 = 0.5255
Table 10. Proximity coefficients of decision points and ranking according to these coefficients Alternative Name
Alternative No
Vi*
Vi-
PCi
Ranking
FROTO AKSA TAVHL ARÇ LK TUPRS TTKOM EREGL PETKM TEKFN AEFES KOZAL SELEC ENKAI MGROS BANVT
A10 A9 A7 A1 A3 A4 A2 A13 A14 A8 A6 A15 A12 A11 A5
7.797.825 8.138.807 8.183.940 8.258.738 8.533.223 8.714.264 8.656.875 8.681.925 8.788.336 9.197.002 9.242.565 9.479.200 9.528.863 11.777.610 12.433.540
9.666.975 9.201.987 917.706 9.146.915 8.886.848 8.771.089 8.675.879 8.587.755 8.685.542 8.045.323 7.976.255 7.843.796 7.729.558 5.141.970 4.359.575
0.553512 0.530655 0.528602 0.525514 0.510150 0.501625 0.500548 0.497274 0.497059 0.466603 0.463229 0.452797 0.447872 0.303907 0.259605
1 2 3 4 5 6 7 8 9 10 11 12 13 14 15
In Figure 2, the ranking of decision points according to the proximity coefficients is shown in graph. 1
0.3
0.259605
0.4
0.303907
0.447872
0.452797
0.466603
0.463229
0.5
0.497059
0.497274
0.500548
0.501625
0.51015
0.525514
0.6
0.528602
0.7
0.530655
0.8
0.553512
0.9
0.2 0.1 0
Figure 2. Ranking according to proximity coefficients of decision points According to the results obtained through the evaluation of stocks recommended by brokerage houses via Fuzzy TOPSIS method, 15 stocks that are subjects of this study are sorted in the form of FROTO>AKSA> TAV HL > ARCLK > TUPRS > TTKOM > EREGL> PETKM > TEKFN >AEFES > KOZAL > SELEC > ENKAI >
116
ijef.ccsenet.org
International Journal of Economics and Finance
Vol. 9, No. 10; 2017
MGROS > BANVIT. In addition, the results revealed that the decision makers consider the criteria C5, C18, C1, C6 and C17 significant when evaluating the stocks. Ranking of the 21 decision criteria in their order of importance according to the decision makers is shown in Table 11. Table 11. Order of importance according to decision makers of decision criteria Criteria No
Criteria Name
Order of Imp.
Criteria No
Criteria Name
Order of Imp.
C5 C18 C1 C6 C17 C4 C21 C16 C11 C19 C20
Market Value Earning Per Share Price/Earning Ratio Market Value/Book Value Return on Equity Trading Volume Sectoral Situation Return on Assets Financial Leverage Ratio Global Economic Developments Local Economic Developments
1 1 1 1 1 2 3 4 5 6 6
C15 C13 C12 C2 C14 C3 C7 C8 C9 C10
Net Profit Margin Risk of not meeting expectations Beta Price Net Profit Free Float Ratio Free Distribution of Shares % Current Ratio Liquidity Ratio Inventory Turnover
7 8 9 10 11 12 12 13 13 13
3.2 Portfolio Creation According to the Ranking Obtained from the Fuzzy TOPSIS Method While creating the portfolio based on listings of the investment recommendations of the brokerage houses determined in accordance with the Fuzzy TOPSIS method, in order to calculate the diversification and weights of the stocks to be included in the portfolio, PCi value of each stock has been deducted from Average PCi Based on these differences, the alternatives of bipartite, tripartite, quadripartite stock certificates that are the basis of diversification are determined. Portfolio weights of each alternative are calculated as a percentage of these differences. The determined portfolios and the weights of their components are shown in Table 12. Table 12. Portfolios and components of fuzzy TOPSIS method Stock Name
PCi
PCi - APCi
FROTO AKSA TAVHL ARÇ LK TUPRS TTKOM EREGL PETKM TEKFN AEFES KOZAL SELEC ENKAI MGROS BANVT Avarege (APCi)
0.553512 0.530655 0.528602 0.525514 0.510150 0.501625 0.500548 0.497274 0.497059 0.466603 0.463229 0.452797 0.447872 0.303907 0.259605 0.469263
0.084249 0.061392 0.059339 0.056251 0.040887 0.032362 0.031285 0.028011 0.027796 -0.002660 -0.006030 -0.016470 -0.021390 -0.165360 -0.209660
Weights of Portfolio and Portfolio Components 6's (%)
5's (%)
4's (%)
3's (%)
2‟s (%)
25.1881 18.3545 17.7407 16.8174 12.2240 9.6753
27.8862 20.3205 19.6410 18.6189 13.5334
32.2508 23.5010 22.7151 21.5330
41.1011 29.9502 28.9486
57.8471 42.1529
3.2.1 Determining Risk, Profit and Performance of Portfolios Created The risk, return and performance indexes for alternative portfolios with different component numbers are calculated based on the PC ranking obtained from the decision criteria as shown in Table 12. The basis of the calculation were the average prices of the stock certificates in the brokerage house recommendations between 01.01.2010-01.03.2017 and were obtained from BIST. In calculations made with Excel Solver, Markowitz's Modern Portfolio Theory criteria were taken as the portfolio model. The explanations for the operations carried out in this context are briefly as follows:
117
ijef.ccsenet.org
International Journal of Economics and Finance
Vol. 9, No. 10; 2017
Return: Is the percentage change in the stock certificate within a certain period and is calculated by the formula 𝑝𝑛+1 − 1. Return calculation is to determine the net capital gain or loss that the stock investment shows. 𝑃𝑛
Portfolio Return: The future course of financial assets is based on the assumption that it will exhibit its past performance and refers to the weighted average of the expected return of a stock certificate by its proportion in the portfolio. The formula used in the calculations is shown in equation (12) (Aksoy & Tanrıoven, 2007). 𝑅𝑝 = ∑𝑛𝑖=1 𝑅𝑖 𝑥1 = 𝑅𝑖 𝑥1 + 𝑅2 𝑥2 + ⋯ . +𝑅𝑛 𝑥𝑛 (12) ∑𝑛𝑖=1 𝑥𝑖 = 𝑥1 + 𝑥2 + … … … … … … . +𝑥𝑛 = 1 𝑣𝑒 0 ≤ 𝑥 𝑖 ≤ 1 Risk: Risk is the probability of facing an undesired event or effect in the future and represents the standard deviation that shows the probability of having less return than expected. The formula used in the calculations is shown in equation (13) (Aksoy & Tanrıoven, 2007). 𝜎𝑝 = √∑𝑛𝑖=1 𝑥𝑖2 𝜎𝑖2 + 2 ∑𝑛𝑖=1 ∑𝑖