The diluted solution was a stock solution of 25.0 mg/L Cr(VI). The stock solution was then diluted again to prepare a standard solution of 0.25 mg/L, to be used ...
Application Note UV-0004-E�
Quantitative Determination of Chromium by Diphenylcarbazide Method � Chromium is widely used for metal materials such as iron and steel, chromium alloy, and refractory products. Plating, tanning, and pigment industries use chromium compounds as well. Chromium compounds are very useful, however, chromium ions are harmful for the human body. For this reason, chromium requires careful handling and rapid quantitative determination. The most widely used quantitative method is the diphenycarbazide absorption method using a UV-Vis spectrophotometer. The detection and determination limits of chromium were examined using a JASCO V-630 spectrophotometer. Calibration curves were created by using a chromogenic kit from a reagent manufacturer for simple quantitative determinations. 1. Reagents Reagent set for water analyzer: No.31- Cr(VI) (KYORITSU CHEMICAL-CHECK Lab) Specialty grade chemicals: K2Cr2O7 Distilled water (DW) 2. Instrumentation JASCO V-630 UV-Vis spectrophotometer 10-mm rectangular cell: Quartz 3.� Reagent preparation 3.1 Standard Solution
K2Cr2O7 was dried at 150°C for one hour then placed in a desiccator. To produce the initial reagent, 8.79 mg of the K2Cr2O7 was weighed out and placed into a 100-mL measuring flask, the K2Cr2O7 was dissolved in water and diluted to 100 mL. 80.4 mL of this solution was diluted to 100 mL in a 100 mL flask. The diluted solution was a stock solution of 25.0 mg/L Cr(VI). The stock solution was then diluted again to prepare a standard solution of 0.25 mg/L, to be used for further standard preparation. 3.2 Solutions for calibration curve
Distilled water and various amounts of the 25.0 mg/L and 0.25 mg/L stock solutions were mixed to prepare 25 mL solutions of Cr(VI) standards in concentrations of 1.5, 1.0, 0.5, 0.25, 0.125, 0.060, 0.040, 0.020, 0.010, 0.00750, 0.00500, 0.00250, 0.00100 and 0.00000 mg/L. 4. Chromogenic Reaction The chromogenic reaction with the chromate solutions was processed at room temperature (21°C). One package of the reagent set for Cr (VI) water analysis was added to the calibration curve solutions immediately after opening it*1). The bottle of the analysis solution was agitated by hand for approximately 60 seconds*2) until dissolution of the reagent was confirmed *3). �
*1)
The solubility of the reagent set deteriorates with time after opening it, since the reagent absorbs moisture. Inadequate agitation does not provide a proper chromogenic reaction and will have an effect on the absorbance values obtained for the reagent reaction. *3) Granular reagent remains even if the reagent dissolves perfectly in the solution. The remainder precipitates at the bottom of cell and does not have an influence on the absorption measurements. *2)
copyright©JASCO Corporation
JASCO INTERNATIONAL CO., LTD. 4-21, Sennin-cho 2-chome, Hachioji, Tokyo 193-0835, Japan Tel: +81-42-666-1322, Fax: +81-42-665-6512
(1/3)
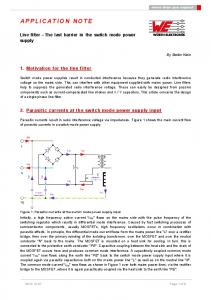
UV-0004-E� 4.1 Reaction Time �
A Cr (VI) solution of 25 mL with a concentration of 0.5 mg/L was prepared to evaluate the time required for proper reaction of the chromogenic reagent using the time course absorption measurement data from the chromogenic reaction (Figures 1 and 2). The chromogenic reagent was added to the solution right after opening and agitated for one minute, and then the time course of the absorption was measured at a wavelength of 540 nm. Here, 90 seconds were assumed as the time spent after addition of the reagent until initiating absorption measurement. The chromogenic reaction was completed approximately 150 seconds after starting the time based measurement (4 minutes after addition of the reagent). Further, the reagent color became stable 210 seconds after starting the measurement (5 minutes after addition of the reagent). �
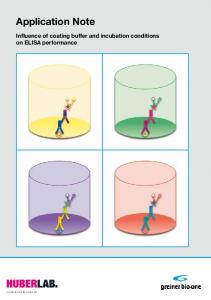
5 mins later�
Figure 1: Time course measurement data at 540 nm �
Figure 2: Color Change of sample vial �
4.2 Measurement �
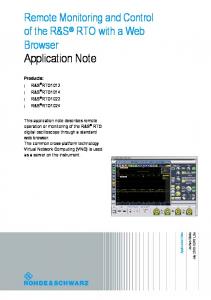
The Spectra Measurement Program was used for this experiment. The reagent was added to the solution and agitated for one minute, and then the spectra of the solutions were measured after resting for 5 minutes (Figure 3). The light path of the reference side was empty. �
Photometric Mode: Measurement range: Data pitch: Band width (UV/Vis): Response: Scanning speed:
Abs� 650 - 400 nm� 0.2 nm� 1.5 nm� Medium� 400 nm/min�
Figure 3: Absorption spectra of Cr (VI) solutions with concentration from 0.01 mg/L to 1.5 mg/L �
copyright©JASCO Corporation
JASCO INTERNATIONAL CO., LTD. (2/3)
UV-0004-E�
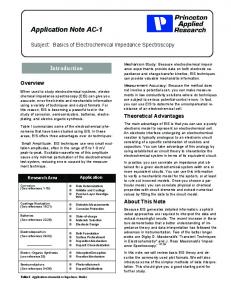
5. Results� Fluctuation of the spectral baseline was observed for the Cr (VI) solution concentrations between 0.01 mg/L and 0.001 mg/L. Thus, the calibration curves were created based on the peak height at 542 nm using peak baseline points of 402 and 635 nm, calculated peak height values outlined in Table 1. The determination limit of the calibration curve that was created with the complete calibration set was 0.09 mg/L. This demonstrates that the JASCO V-630 can easily determine chromium with a concentration range between 0.09 mg/L to 1.5 mg/L. Furthermore, when the calibration curve was created using only the data from the solutions in the range between 0.01 mg/L and 0.001 mg/L, a determination limit of 0.0025 mg/L was obtained with the truncated data set, demonstrating the excellent sensitivity of the JASCO V-630 for this determination (Figure 4).� � Y=A * X + B� A=0.63663±0.00621� B=0.00183±0.00303� Correlation Coefficient =0.99987� Standard Error=0.00749� Detection limit=0.00477 mg/L� Determination limit=0.08835 mg/L�
Abs�
Concentration [mg/L]�
� Y=A * X + B� A= 0.62824±0.02099� B= -0.00018±0.00011� Correlation Coefficient= 0.99958� Standard Error= 0.00012� Detection limit = 0.00017 mg/L� Determination limit= 0.00250 mg/L�
Abs�
Concentration [mg/L]� Figure 4: Calibration Curves (Top: All standard concentrations, Bottom: Truncated concentration range) � Table 1: Chromium Standard Concentrations and Calculated Absorption�
copyright©JASCO Corporation
JASCO INTERNATIONAL CO., LTD. (3/3)