To these ends, the U.S. Army Research Laboratory (ARL) has been investigating methods for health ... There were also sensors inserted and data collected by the Pennsylvania State University (Penn State) ..... 732 NORTH CAPITOL ST NW.
Application of Autoassociative Neural Networks to Health Monitoring of the CAT 7 Diesel Engine by Andrew J. Bayba, David N. Siegel, and Kwok Tom
ARL-TN-0472
Approved for public release; distribution unlimited.
February 2012
NOTICES Disclaimers The findings in this report are not to be construed as an official Department of the Army position unless so designated by other authorized documents. Citation of manufacturer’s or trade names does not constitute an official endorsement or approval of the use thereof. Destroy this report when it is no longer needed. Do not return it to the originator.
Army Research Laboratory Adelphi, MD 20783-1197
ARL-TN-0472
February 2012
Application of Autoassociative Neural Networks to Health Monitoring of the CAT 7 Diesel Engine Andrew J. Bayba, David N. Siegel, and Kwok Tom Sensors and Electron Devices Directorate, ARL
Approved for public release; distribution unlimited.
Form Approved OMB No. 0704-0188
REPORT DOCUMENTATION PAGE
Public reporting burden for this collection of information is estimated to average 1 hour per response, including the time for reviewing instructions, searching existing data sources, gathering and maintaining the data needed, and completing and reviewing the collection information. Send comments regarding this burden estimate or any other aspect of this collection of information, including suggestions for reducing the burden, to Department of Defense, Washington Headquarters Services, Directorate for Information Operations and Reports (0704-0188), 1215 Jefferson Davis Highway, Suite 1204, Arlington, VA 22202-4302. Respondents should be aware that notwithstanding any other provision of law, no person shall be subject to any penalty for failing to comply with a collection of information if it does not display a currently valid OMB control number.
PLEASE DO NOT RETURN YOUR FORM TO THE ABOVE ADDRESS. 1. REPORT DATE (DD-MM-YYYY)
2. REPORT TYPE
3. DATES COVERED (From - To)
February 2012
Final
October 2010 to October 2011
4. TITLE AND SUBTITLE
5a. CONTRACT NUMBER
Application of Autoassociative Neural Networks to Health Monitoring of the CAT 7 Diesel Engine
5b. GRANT NUMBER
5c. PROGRAM ELEMENT NUMBER
1NE6KK 6. AUTHOR(S)
5d. PROJECT NUMBER
Andrew J. Bayba, David N. Siegel, and Kwok Tom 5e. TASK NUMBER
5f. WORK UNIT NUMBER
7. PERFORMING ORGANIZATION NAME(S) AND ADDRESS(ES)
8. PERFORMING ORGANIZATION REPORT NUMBER
U.S. Army Research Laboratory ATTN: RDRL-SER-E 2800 Powder Mill Road Adelphi, MD 20783-1197
ARL-TN-0472
9. SPONSORING/MONITORING AGENCY NAME(S) AND ADDRESS(ES)
10. SPONSOR/MONITOR'S ACRONYM(S)
11. SPONSOR/MONITOR'S REPORT NUMBER(S)
12. DISTRIBUTION/AVAILABILITY STATEMENT
Approved for public release; distribution unlimited. 13. SUPPLEMENTARY NOTES
14. ABSTRACT
An autoassociative neural network (AANN) algorithm was applied to fault detection and classification for seeded fault testing on a Caterpillar C7 diesel engine. Data used for this work is a subset from the seeded fault testing performed at the U.S. Army Tank and Automotive Research, Development and Engineering Center (TARDEC) test cell facilities. This report extends previous work performed on fault detection and classification performed by the U.S. Army Research Laboratory (ARL) on the C7 engine by including analysis using AANN [1]. We believed that AANN would be particularly useful in the diagnosis of faults in these tests because the correlation of several sensors appeared to be nonlinear. Although AANN performed quite well, the results were similar to the previous work using linear Principal Component Analysis (PCA) Statistics. We believe that the potential benefit in using AANN was not achieved due to the nature of the tests analyzed—in particular, data collection at discrete set-points in engine operation—and that within these set-point regimes, the sensor readings tend to be linearly correlated. 15. SUBJECT TERMS
Health monitoring, diesel engine health, CAT 7 diesel engine, diesel engine prognostics and diagnostics 17. LIMITATION OF ABSTRACT
16. SECURITY CLASSIFICATION OF: a. REPORT
Unclassified
b. ABSTRACT
Unclassified
c. THIS PAGE
UU
18. NUMBER OF PAGES
22
19a. NAME OF RESPONSIBLE PERSON
Andrew J. Bayba
19b. TELEPHONE NUMBER (Include area code)
(301) 394-0440
Unclassified
Standard Form 298 (Rev. 8/98) Prescribed by ANSI Std. Z39.18
ii
Contents
List of Figures
iv
List of Tables
iv
1.
Introduction
1
2.
Experimental
1
3.
Data for Analysis
3
4.
Analysis
5
5.
Discussion
12
6.
Conclusion and Recommendations
13
7.
References
14
List of Symbols, Abbreviations, and Acronyms
15
Distribution List
16
iii
List of Figures Figure 1. Instrumented CAT 7 engine in the TARDEC test cell. ...................................................2 Figure 2. Typical stepped control of engine speed for a performance run. ....................................3 Figure 3. Neural net design. Every node connection is not shown for clarity. ...............................6 Figure 4. AANN SPE ROC curves for various bottleneck node counts for Regime 1...................8 Figure 5. AANN SPE ROC curves for various bottleneck node counts for Regime 2...................8 Figure 6. AANN SPE ROC curves for various bottleneck node counts for Regime 3...................9 Figure 7. AANN SPE ROC curves for various bottleneck node counts for Regime 4...................9 Figure 8. SPE health value for differing levels of air restriction (Regime 4). ..............................11 Figure 9. SPE health value for differing levels of exhaust restriction (Regime 4). ......................12
List of Tables Table 1. Baseline performance runs................................................................................................4 Table 2. Seeded fault performance runs. .........................................................................................4 Table 3. Signals recorded from CAN and dyno. .............................................................................5 Table 4. Operating regimes for analysis. ........................................................................................5 Table 5. AANN Optimum bottleneck node count and detection results (for 0% false positives). .................................................................................................................................10 Table 6. Detection rate comparison of AANN and PCA. .............................................................10 Table 7. AANN Sensor-fault contribution results. .......................................................................11
iv
1. Introduction The U.S. Army is very interested in monitoring the health of equipment in the field. The Army, in general, wishes to reduce operating cost, while the commander in the field is concerned about availability of equipment for operations, as well as arranging for logistical support to minimize downtime. To these ends, the U.S. Army Research Laboratory (ARL) has been investigating methods for health monitoring and assessment, with an emphasis on high value/high risk and high volume/high maintenance items. In the case of high volume and the high maintenance items, the overall cost can be significantly reduced simply due to the extensive amount of time and resources it costs to maintain them. The Caterpillar C7 engine fits into the category of high maintenance and moderate-to-high volume, thereby making it a good candidate for study. In the spring and summer of 2010, the U.S. Army Tank and Automotive Research, Development and Engineering Center (TARDEC) performed “seeded fault” testing of the C7 engine in which a variety of operating parameters were perturbed. Seeded faults in this case describe these perturbations and, in most cases, have not been shown to actually degrade engine performance, nor to permanently damage the engine. This report is a continuation of previous work on fault detection and classification performed by ARL on the Caterpillar C7 engine (1). It adds to the previous work by including analysis using an autoassociative neural network (AANN) approach. The previous report examined detection and classification using Correlation Analysis and statistics from linear Principal Component Analysis (PCA). The PCA statistics, T-Square, and Square Prediction Error (SPE), showed good results, but we believed that improvements could be made because of the suspected nonlinearity in sensor correlations. The AANN approach is a proven way of implementing nonlinear PCA (3). The data used in this analysis is the same as that used in the PCA analysis of reference 1.
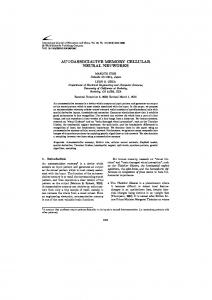
2. Experimental A military version of the Caterpillar C7 diesel engine (Model C7 DITA) was installed and instrumented in a dynamometer (dyno) test cell at TARDEC’s facilities in Warren, MI (figure 1). The basics of the setup and data collected are described here; for a detailed description of the experiment, see reference 2. The test cell supported provision of fuel, coolant, inlet air, and exhausting of the engine, as well as a load (eddy current dyno, computer controlled). Data were collected from a variety of data acquisition systems. The data acquisition systems were coordinated in time and time-stamped, but generally operated autonomously from each other at different sampling rates and, therefore, required synchronization in data processing later on. Sources for the data included existing engine sensors, test cell sensors, and a few installed 1
sensors. The data from the existing sensors were extracted from the controller-area network (CAN) vehicle bus. The data from the test cell sensors included such items as exhaust temperature and were recorded by the cell data acquisition system (DAQ). The test cell data were recorded at close to the same rate as the CAN data. The data from the installed sensors were recorded by a separate DAQ at a much higher rate and are referred to as “analog data”. A small portion of the data that is referred to as “digital data” is primarily used for timing. There were also sensors inserted and data collected by the Pennsylvania State University (Penn State) Applied Research Laboratory. Both the CAN and dyno data were collected at a relatively low rate and provided to ARL at 1 Sample/s, and could be monitored continuously during a test run. The analog data were collected at 10 kiloSamples/s and, due to the high rate, “snapshots” of data of between 1 and 30 s were collected at select times during a test run. The Penn State data were collected independently of the TARDEC data at 102.4 kiloSamples/s.
Figure 1. Instrumented CAT 7 engine in the TARDEC test cell.
Test runs were performed with various seeded faults and no fault cases. A test run consisted of running the engine through a stepwise sequence of designated speeds for a short time at each speed, as shown in figure 2, all with either no fault or with a particular seeded fault. The engine speeds with associated duration were duplicated for all the tests. It should be noted that the time duration at a given speed set-point was not precisely controlled.
2
Figure 2. Typical stepped control of engine speed for a performance run.
3. Data for Analysis The data described here is identical to the data used in the PCA analysis of reference 1; it is repeated here for clarity. The focus of this analysis is on the performance test data since these files have several baseline runs, along with several seeded fault runs. Baseline runs were test sequences at the beginning of a test day in which there was no fault but the standard test sequence was followed, and as such are viewed as “healthy states.” Table 1 shows the 15 baseline runs that were identified. For PCA and AANN-based methods, training data is required; the first column of table 1 shows the runs that were selected for training (50% of the runs, randomly selected). Table 2 shows the 33 seeded fault performance runs; however, three of these test runs are considered a baseline condition since their gain was set to 1.0, which is the nominal value. As a note, several files contained more than one run, where the additional runs were various levels of the same fault type.
3
Table 1. Baseline performance runs. Baseline Performance Test # Training 1 Training 2 Test 1 Training 3 Training 4 Test 2 Training 5 Test 3 Test 4 Test 5 Test 6 Training 6 Training 7 Test 7 Test 8
Date May 27, 2011 May 27, 2011 June 1, 2011 June 3, 2011 June 8, 2011 June 10, 2011 June 15, 2011 June 16, 2011 June 22, 2011 June 29, 2011 July 1, 2011 July 6, 2011 July 8, 2011 July 27, 2011 August 3, 2011
MatLAB File Name PerfM3_JP8_May27_ext PerfM3_JP8_May27_ext Perf_Jun1_ext Perfor_Jun3_ext Perfor_Jun8_par Perfor_Jun10_ext Perfor_Jun15_ext Perfor_Jun16_ext Perfor_C_Jun22_ext Perfor_jun29_ext Perf_Jul1_ext Perfor_Jul6_ext Perfor_Jul8_ext Perfor_Jul27_ext Perfor_ext3_ext
Run # in File 1 2 1 1 1 1 1 1 1 1 1 1 1 1 1
Train (0) or Test (1) 0 0 1 0 0 1 0 1 1 1 1 0 0 1 1
Table 2. Seeded fault performance runs. Test # 9 10 11 12 13 14 15 16 17 18 19 20 21 22 23 24 25 26 27 28 29 30 31 32 33 34 35 36 37 38 39 40 41
Date May 27, 2011 May 27, 2011 June 8, 2011 June 8, 2011 June 8, 2011 June 10, 2011 June 10, 2011 June 10, 2011 June 15, 2011 June 15, 2011 June 15, 2011 June 15, 2011 June 15, 2011 June 15, 2011 June 15, 2011 June 16, 2011 June 16, 2011 June 16, 2011 June 29, 2011 June 29, 2011 June 29, 2011 July 6, 2011 July 6, 2011 July 6, 2011 July 13, 2011 July 13, 2011 July 13, 2011 July 13, 2011 July 13, 2011 July 13, 2011 August 3, 2011 August 4, 2011 August 5, 2011
MatLAB File Name Fault Type Run in File PerfM3_IntRestr_May27_ext IntakeAir Restric Test 1 PerfM3_IntRestr_May27_ext IntakeAir Restric Test 2 PerfM3_OilP_Jun8_par OilPress High Gain 1 PerfM3_OilP_Jun8_par OilPress High Gain 2 PerfM3_OilP_Jun8_par OilPress High Gain 3 PerfM3_AirChgT_Jun10_ext Air Charge Temperature Increase 1 PerfM3_AirChgT_Jun10_ext Air Charge Temperature Increase 2 PerfM3_AirChgT_Jun10_ext Air Charge Temperature Increase 3 Perfor3_AirRestr_Jun15_ext AirRestriction Low 1 Perfor3_AirRestr_Jun15_ext AirRestriction Low 2 Perfor3_AirRestr_Jun15_ext AirRestriction Low 3 Perfor3_B_AirRestr_Jun15_ext AirRestriction High 1 Perfor3_B_AirRestr_Jun15_ext AirRestriction High 2 Perfor3_C_AirChgT_high_Jun15_ext AirChgHigh 1 Perfor3_C_AirChgT_high_Jun15_ext AirChgHigh 2 PerforM3_AirChg_low_Jun16_ext AirCharge 1 PerforM3_AirChg_low_Jun16_ext AirCharge 2 PerforM3_AirChg_low_Jun16_ext AirCharge 3 PerfM3_B_AirIntRes_Jun29_ext IntRestriction 1 PerfM3_B_AirIntRes_Jun29_ext IntRestriction 2 PerfM3_B_AirIntRes_Jun29_ext IntRestriction 3 PerforM3_B_BoostG_Jul6_ext Boost 1 PerforM3_B_BoostG_Jul6_ext Boost 2 PerforM3_B_BoostG_Jul6_ext Boost 3 PerforM3_ExhRestr_Jul13_ext ExhRestr 1 PerforM3_ExhRestr_Jul13_ext ExhRestr 2 PerforM3_ExhRestr_Jul13_ext ExhRestr 3 PerforM3_B_ExhRestr_Jul13_ext ExhRestr 1 PerforM3_B_ExhRestr_Jul13_ext ExhRestr 2 PerforM3_B_ExhRestr_Jul13_ext ExhRestr 3 PerforM3_InjPresG_ext3_ext InjPress 1 PerforM3_InjPresG_ext3_ext InjPress 2 PerforM3_InjPresG_ext3_ext InjPress 3
Severity Pos # 4 Pos # 6 Gain 1.0 Gain 0.7 Gain 1.3 Increased by 20oF Increased by 30oF Increased by 50oF Pos # 2 Pos # 3 Pos # 4 Pos #5 Pos #6
Pos #5 Pos #6 Pos #7 Gain 0.85 Gain 0.95 Gain 1.00 60% 55% 50% 42% 46% 50% Gain 1.0 Gain 0.9 Gain 1.1
From the data described, we determined to initially work with the 45 signals from the CAN and dyno. Working with this set of low-cost sensor and CAN bus signals provides a path for a practical onboard implementation, and thus, is conducted prior to considering vibration and other signals for developing health models. Since the signals were from different data acquisition 4
systems, they had to be aligned and interpolated to the same 1Sample/s acquisition rate, as well as reformatted to allow them to be processed together. The CAN and dyno signals are identified in table 3. The 32 signals highlighted in orange were used in the analysis. The other 13 signals were not included because they are either operating conditions or have a low amount of variability. Table 3. Signals recorded from CAN and dyno.
The data was collected at steady state operating points in the performance runs. Consequently, for the analysis, the 32 signals highlighted in table 3 were divided into four operating regimes, as shown in table 4. To avoid transient effects, the first and last 20 s in a particular operating regime were not included in the calculations. Table 4. Operating regimes for analysis. Regime No
Engine RPM
Engine Load
Pedal %
1
1620–1820
60–100
80–100
2
1820–2020
60–100
80–100
3
2020–2200
60–100
80–100
4
2220–2420
60–100
80–100
4. Analysis AANN is an approach for performing nonlinear principal component analysis. Its usage in diagnostics and health monitoring has ranged from sensor diagnostics (4), to aircraft engine health monitoring (5), to diesel engine diagnostics (6). Some researchers classify the AANN method as a multivariate state estimation technique, since the AANN model provides an 5
estimated sensor value for each sample. As shown in figure 3, a five-layer feed-forward network was employed. It is trained with the same targets and inputs, and is, thus, forced to try to produce the output by only using the small set of nodes in the bottleneck layer.
Figure 3. Neural net design. Every node connection is not shown for clarity.
The approach is similar to the PCA-based monitoring method in that both methods map the incoming data into a reduced number of components. The primary differences in AANN are the mapping/de-mapping functions, training, and the evaluation of health. For AANN, the sigmoid functions of the mapping and de-mapping layers can account for nonlinearities in the sensor correlations that are not possible in normal PCA. Also, while training of the PCA models involved a matrix computation and is deterministic, the AANN model is trained using a back propagation algorithm that solves an optimization problem and is not deterministic. And finally, the assessment of health based on the AANN model involves an evaluation of the de-mapped reduced set, while PCA is concerned with the analysis of the reduced set, itself. To be more specific, the AANN model is derived by training the network using healthy data such that the output matches the input; any subsequent healthy data that the model is applied to should show a negligible difference in its output layer values. However, when the model is applied to faulted data, a difference in the output layer values is expected to appear. This difference is the basis for the health estimate of the AANN method. The AANN method is computationally much more time consuming than PCA. The steps in the process are listed as follows: 1. Select regime and signal subset (four regimes). 2. Specify a training data set, defined as a portion of the baseline/healthy data, and normalize the data by subtracting the mean and dividing by the standard deviation. 6
3. Train the AANN models for each regime. 4. Save the AANN models and normalization information. 5. Normalize all the senor data using the training normalization information. 6. Calculate the AANN-based SPE health value and the mean of these for each block of data (6). The network consisted of a 32 × 12 × f × 12 × 32 architecture. The same 32 senor signals were used in the PCA analysis of reference 1. The number of nodes, f, in the bottleneck layer was varied to evaluate the performance of the network by checking the health assessment results. The value of f was varied from 1 to 10; a bottleneck layer with f = 8 was compared to the PCA model of reference 1, since the PCA model had 7 to 8 principle components retained. The number of mapping and de-mapping nodes could have been varied, but were maintained at 12 because, generally, the number of bottleneck nodes has more influence on the model performance (6). The network was trained with baseline data from each of the four operating regimes. More specifically, the training set was defined to be 50% of the baseline data, where a random number generator was used to select which runs were used. The default training settings in the Matlab neural network toolbox were used and appeared to work well; however, adjustment of these settings could be considered for future work. To monitor engine health and to determine which sensors are contributing more to the degraded engine performance, the traditional AANN approach is used—that is, to monitor SPE and examine the residuals. The residuals, E, are calculated based on equation 1 and are the difference between the modeled and actual data values:
E1xn xn 1xn y1xn ,
(1)
where n are the number signals, x1xn are the actual signal values, and y1xn are the modeled values. SPE is the sum of the residuals squared (summed from residuals for each sensor), equation 2: n
SPE E i
2
(2)
i 1
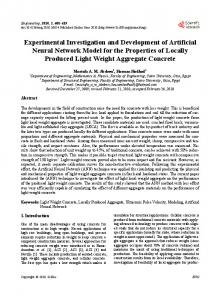
To evaluate health of the system based on the SPE, a threshold must be established above which the engine will be considered to be in a faulted state. A meaningful threshold can be obtained with the application of a receiver operating curve (ROC Curve). The ROC Curve is a common way of showing classification/detection results as a function of false positives and false negatives as a threshold is varied (7). Figures 4–7 show a series of ROC Curves for various values of the bottleneck nodes for each regime. Table 5 lists best performing node counts for each regime for a 0% false alarm rate. The corresponding detection rate is also provided.
7
Figure 4. AANN SPE ROC curves for various bottleneck node counts for Regime 1.
Figure 5. AANN SPE ROC curves for various bottleneck node counts for Regime 2.
8
Figure 6. AANN SPE ROC curves for various bottleneck node counts for Regime 3.
Figure 7. AANN SPE ROC curves for various bottleneck node counts for Regime 4.
9
Table 5. AANN Optimum bottleneck node count and detection results (for 0% false positives). Regime No
Best node count, f
False Positives (%)
Detection Rate %
1
8
0
80
2
4
0
90
3
1–10 (except 5) *
0
83.3
4
9
0
90
*All, except 5, had an equal detection rate. 5 nodes gave a detection rate of 80%.
As is shown in the figures, all bottleneck node counts gave good detection rates for all regimes (greater than 75% True Positives for 0 False Positives), except node counts of 2, 3, and 6 for regime 2. An additional measure of node count performance, calculating the Area under the ROC Curve for each node count, which spans the full trade space, was not performed because the lack of variation was obvious. A bottleneck layer node count of 8 provides good results for all regimes, 0 false positives with a detection rate of 80–83.3%. It also provides for a direct comparison to the PCA method used in reference 1. Eight PCs were selected in that analysis to produce a high-quality SPE statistic (85% of the variance was explained using eight PCs.) Table 6 compares the results of PCA and AANN using a node count of 8 for all regimes. It is seen that there is very little difference between the detection rates for the AANN and PCA methods. Table 6. Detection rate comparison of AANN and PCA. Regime No
False Positives
AANN Detection Rate
PCA Detection Rate %
1
0
80
77
2
0
83.3
80
3
0
83.3
86.6
4
0
83.3
83.3
Other results of interest include which sensors contributed most to particular faults and whether AANN could provide a measure of severity within a particular fault type. The contribution results are listed in table 7, where highest contributors are identified in the last 2 columns. The contribution information is of significant value if it is determined that the system should be monitored for a particular fault. Figures 8 and 9 are plots of air restriction and exhaust restriction faults at various levels. The figures indicate that AANN can provide a measure of fault severity.
10
Table 7. AANN Sensor-fault contribution results. Test # 9 10 12 13 14 15 16 17 18 19 20 21 22 23 24 25 26 27 28 29 30 31 33 34 35 36 37 38 40 41
MatLAB File Name PerfM3_IntRestr_May27_ext PerfM3_IntRestr_May27_ext PerfM3_OilP_Jun8_par PerfM3_OilP_Jun8_par PerfM3_AirChgT_Jun10_ext PerfM3_AirChgT_Jun10_ext PerfM3_AirChgT_Jun10_ext Perfor3_AirRestr_Jun15_ext Perfor3_AirRestr_Jun15_ext Perfor3_AirRestr_Jun15_ext Perfor3_B_AirRestr_Jun15_ext Perfor3_B_AirRestr_Jun15_ext Perfor3_C_AirChgT_high_Jun15_ext Perfor3_C_AirChgT_high_Jun15_ext PerforM3_AirChg_low_Jun16_ext PerforM3_AirChg_low_Jun16_ext PerforM3_AirChg_low_Jun16_ext PerfM3_B_AirIntRes_Jun29_ext PerfM3_B_AirIntRes_Jun29_ext PerfM3_B_AirIntRes_Jun29_ext PerforM3_B_BoostG_Jul6_ext PerforM3_B_BoostG_Jul6_ext PerforM3_ExhRestr_Jul13_ext PerforM3_ExhRestr_Jul13_ext PerforM3_ExhRestr_Jul13_ext PerforM3_B_ExhRestr_Jul13_ext PerforM3_B_ExhRestr_Jul13_ext PerforM3_B_ExhRestr_Jul13_ext PerforM3_InjPresG_ext3_ext PerforM3_InjPresG_ext3_ext
Fault Type IntakeAir Restric Test IntakeAir Restric Test OilPress High Gain OilPress High Gain AirCharge Temp high Shift AirCharge Temp high Shift AirCharge Temp high Shift AirRestriction Low AirRestriction Low AirRestriction Low AirRestriction High AirRestriction High AirChgHigh AirChgHigh AirCharge AirCharge AirCharge IntRestriction IntRestriction IntRestriction Boost Boost ExhRestr ExhRestr ExhRestr ExhRestr ExhRestr ExhRestr InjPress InjPress
Severity Pos # 4 Pos # 6 Gain 0.7 Gain 1.3 Increased by 20oF Increased by 30oF Increased by 50oF Pos # 2 Pos # 3 Pos # 4 Pos #5 Pos #6
Pos #5 Pos #6 Pos # 7 Gain 0.85 Gain 0.95 60% 55% 50% 42% 46% 50% Gain 0.9 Gain 1.1
Q Contribution 1 'T-OilGalley' 'ECM1-Boost' 'ECM1-OilPres' 'ECM1-OilPres' 'IntManiAirT' 'IntManiAirT' 'IntManiAirT' 'InjCtrlP' 'Torque' 'P-ExhB4Turbo2' 'T-OilGalley' 'ECM1-Boost' 'IntManiAirT' 'Sensor-AirIntMani' 'T-IntAirMani' 'ECM1-AirIntMani' 'P-ExhB4Turbo2' 'P-ExhB4Turbo2' 'P-ExhB4Turbo2' 'Sensor-Boost' 'ECM1-Boost' 'Sensor-Boost' 'P-ExhStack' 'P-ExhStack' 'P-ExhStack' 'P-ExhStack' 'P-ExhStack' 'P-ExhStack' 'Sensor-InjPres' 'Sensor-InjPres'
Figure 8. SPE health value for differing levels of air restriction (Regime 4).
11
Q Contribution 2 'T-ExhB4Turbo2' 'Sensor-Boost' 'EngOilP' 'EngOilP' 'Sensor-AirIntMani' 'Sensor-AirIntMani' 'Sensor-AirIntMani' 'Boost' 'P-ExhB4Turbo2' 'AirFlow' 'P-AirB4Mani' 'Sensor-Boost' 'Sensor-AirIntMani' 'ECM1-AirIntMani' 'ECM1-AirIntMani' 'IntManiAirT' 'Boost' 'AirFlow' 'AirFlow' 'ECM1-Boost' 'Boost' 'P-ExhB4Turbo2' 'T-ExhStack' 'P-ExhB4Turbo2' 'T-ExhStack' 'ECM1-Boost' 'T-ExhStack' 'T-ExhStack' 'T-ExhB4Turbo2' 'T-ExhB4Turbo2'
Figure 9. SPE health value for differing levels of exhaust restriction (Regime 4).
5. Discussion The AANN monitoring method can be considered a nonlinear version of the PCA method. This method was examined because of the suspected nonlinearity in sensor correlations, and, hence, its potential benefit. However, very little difference is seen in the detection rate between AANN and PCA. The sensor correlations are still believed to be nonlinear; however, the explanation for lack of benefit using AANN is that the “Performance” test data was acquired and analyzed at discrete set-points in vehicle operation. Consequently, the sensor correlations are likely linear within these regimes and the benefit of using AANN was not realized. Regarding network architecture and analysis, the selection of the number of nodes in the mapping/de-mapping and bottleneck layers are model parameters that can be varied to optimize the AANN monitoring method. In general the mapping/de-mapping layer nodes have less of an effect than bottleneck layer nodes (6), and were not varied because it was seen that the number of bottleneck layer nodes had little effect on the results. However, one of the drawbacks of using the AANN method is that it is difficult to generalize on what are the optimum number of nodes in the bottleneck layer and in the mapping and de-mapping layers.
12
6. Conclusion and Recommendations The AANN results for the detection rate are very good, and the fault severity corresponded with the SPE health value. The results for AANN and normal PCA (linear) were quite similar, with an almost identical false positive and detection rate. Because AANN is much more computationally intensive, we concluded that for the data set analyzed, PCA statistics provide a better method of obtaining health values. A potential option for future work would be to compare PCA and AANN using the “MiniMap” series of runs, which is more suitable to analyze as a single data set without separation into regimes. In this case, any correlation nonlinearities should be “active” and the AANN method would be expected to perform better than PCA. Finally, as in the previous report ARL-TR-5677, reference 1, it should be pointed out that the engine testing was not seeded fault testing in a traditional sense; that is, the “seeded faults” were temporary perturbations in operating conditions and were not known to cause degradation in engine performance (let alone permanent damage). Consequently, what is “detected” in this work are these perturbations; additionally, the missed detections are at the lower levels of these perturbations. With this in mind, both the PCA and AANN analysis should be considered as performing very well.
13
7. References 1. Bayba, A.; Siegel, D.; Tom, K.; Ly, C. Approaches to Health Monitoring of the CAT 7 Diesel Engine; ARL-TR-5677; U.S. Army Research Laboratory: Adelphi, MD, September 2011. 2. MIS 2000, Final Report, A Dynamic Neural Network Approach to CBM, Cooperative Agreement W911-09-2-0036. 3. Kramer, M. A. Nonlinear Principal Component Analysis Using Autoassociative Neural Networks. AIChe Journal, 37 (2), 233–243. 4.
Hines, J. W.; Uhrig, R. E. Use of Autoassociative Neural Networks for Signal Validation. Journal of Intelligent and Robotic Systems 1997, 21, 143–154.
5.
Hu, X.; Qiu, H.; Iyer, N. Multivariate Change Detection for Time Series Data in Aircraft Engine Fault Diagnostics. IEEE Proceedings of Systems, Man and Cybernetics, 2007.
6. Antory, D. Application of a Data-driven Monitoring Technique to Diagnose Air Leaks in an Automotive Diesel Engine: A Case Study. Mechanical Systems and Signal Processing 2007, 21 (2), 795–808. 6. Hines, J. W.; Garvey, D.; Seibert, R.; Usyin, A. Technical Review of On-line Monitoring Techniques for Performance Assessment: volume 2: Theoretical Issues, U.S NRC, 2008. 7. Zweig, M.; Campbell, G. Receiver-operating Characteristics (ROC) Plots: A Fundamental Evaluation Tool in Clinical Medicine. Clinical Chemistry, 39 (4), 561–577.
14
List of Symbols, Abbreviations, and Acronyms AANN
autoassociative neural network
ARL
U.S. Army Research Laboratory
CAN
controller-area network
DAQ
data acquisition system
Dyno
dynamometer
PCA
Principal Component Analysis
ROC Curve
receiver operating curve
SPE
Square Prediction Error
TARDEC
U.S. Army Tank and Automotive Research, Development and Engineering Center
15
NO. OF COPIES ORGANIZATION
NO. OF COPIES ORGANIZATION
1 ELEC
ADMNSTR DEFNS TECHL INFO CTR ATTN DTIC OCP 8725 JOHN J KINGMAN RD STE 0944 FT BELVOIR VA 22060-6218
1 ELEC
NASA GLENN US ARMY RESEARCH LAB ATTN RDRL VTP H DECKER BLDG 23 RM W121 CLEVELAND OH 44135-3191
1
US ARMY RSRCH DEV AND ENGRG CMND ARMAMENT RSRCH DEV & ENGRG CTR ARMAMENT ENGRG & TECHNLGY CTR ATTN AMSRD AAR AEF T J MATTS BLDG 305 ABERDEEN PROVING GROUND MD 21005-5001
3 ELEC
US ARMY TARDEC ATTN RDTA RS C BECK ATTN RDTA RS K FISHER ATTN RDTA RS S HUSSAIN MS# 204 6501 E 11 MILE RD WARREN MI 48397-5000
1 ELEC
USAMSAA ATTN T. S. KILBY 392 HOPKINS RD APG MD 21005
1
US ARMY INFO SYS ENGRG CMND ATTN AMSEL IE TD A RIVERA FT HUACHUCA AZ 85613-5300
1
COMMANDER US ARMY RDECOM ATTN AMSRD AMR W C MCCORKLE 5400 FOWLER RD REDSTONE ARSENAL AL 35898-5000
1
US GOVERNMENT PRINT OFF DEPOSITORY RECEIVING SECTION ATTN MAIL STOP IDAD J TATE 732 NORTH CAPITOL ST NW WASHINGTON DC 20402
3 ELEC
DIRECTOR US ARMY RESEARCH LAB ATTN RDRL VTM M HAILE ATTN RDRL VTM A GHOSHAL ATTN RDRL VTM M MURUGAN BLDG 4603 APG MD 21005
1 ELEC
NASA GLENN US ARMY RESEARCH LAB ATTN RDRL VTP B DYKAS BLDG 23 RM W121 CLEVELAND OH 44135-3191
6
16
US ARMY RSRCH LAB ATTN IMNE ALC HRR MAIL & RECORDS MGMT ATTN RDRL CIO LL TECHL LIB ATTN RDRL CIO LT TECHL PUB ATTN RDRL SER E A BAYBA ATTN RDRL SER E D SIEGEL ATTN RDRL SER E K TOM ADELPHI MD 20783-1197