image texture features of apple discs has been studied too machine vision equipped with ..... Ramos, I.N., C.L.M. Silva, A.M. Sereno and. (JAST), 11: 391-400.
World Applied Sciences Journal 17 (7): 860-869, 2012 ISSN 1818-4952 © IDOSI Publications, 2012
Vision Based Features in Moisture Content Measurement During Raisin Production Adel Bakhshipour, Abdolabbas Jafari and Ali Zomorodian Department of Agricultural Engineering, Shiraz University, Shiraz, Iran Abstract: Apparent characteristics of fruits are different in various moisture contents. Some feature changes can be quantified in different stages of drying process. Study on these changes is useful to determine the qualitative properties of dried product. This article represents an approach to investigate the effects of dehydrating on some apparent characteristics of raisin comprising shape, color and texture which are interpretable by machine vision systems. The correlation between the time and the image based characteristics were correlated in raisin drying. Samples were dried under 50°C in an oven dryer. Variations in five shape, nine color and five texture features corresponding to the moisture contents of the kernels were measured at different time intervals during the drying process. All morphological features decreased smoothly with drying time. Several ANN models were employed to predict the moisture content. Overall performance of the network was verified using the excluded test data. Results showed that the machine vision system integrated with the neural networks is a proper tool to predict the moisture content with acceptable values of coefficient of determination (R2 = 99.84%), Root Mean Squared Error (RMSE = 0.00078) and Mean Absolute (MAPE = 0.0312%). Key words: Raisin % Moisture content % Image processing % Neural networks INTRODUCTION
Raisins are produced by drying some specific grape varieties like Sultana and Flame grapes. The preservation of grapes by drying is a major industry in many parts of the world where grapes are grown [6]. Raisin is a source of carbohydrates and it contains large amounts of iron, vitamins A, B1, B2, B3, B6 and minerals. It is usually included in breakfast cereals, dairy, bakery and confectionery [7]. The raisin that is made from white seedless grape is the most popular and favorable in marketing. During the drying processes, high moisture content materials such as fruits are exposed to physical and chemical changes. Quality of dehydrated products is a complex resultant of properties characterizing the final products [8]. Almost the primery factor for consumers to assess the quality of food is apparent characteristics which affect their acceptability. Visual sensation is a mix of the color, shape and size of the product [9]. During drying process these quality values may be changed by amount the water content. Morphological features are widely used in automated grading, sorting and detection of objects in industry [10]. Morphological features describe the changes in sample
Computer vision is a technology for acquiring and analyzing an image of a real scene by computers to obtain information or to control processes [1]. Due to the rapidly increasing capacities of computers, image processing and on-line classification systems gain more and more importance in many areas [2]. Machine vision has the potential to be used as precise method for recognition and assessment of apparent characteristic of materials such as shape and color. Such approach could potentially be fast, noninvasive, as well as inexpensive, considering the new advances in image technologies [3]. Grapes (Vitis vinifera) are usually grown on far more land than is used for any other sub-tropical fruit [4]. Grape is one of the largest fruit crops in the world. According to the latest published reports of FAO about grape commodity, the total grape production all over the world in 2008 was about 6.66 million tones and Iran was one of major producers of this fruit (1.74 million tones)[5]. Grapes can be consumed raw or used for making jam, juice, jelly, vinegar, wine, grape seed extracts, raisins and grape seed oil.
Corresponding Author: Abdolabbas Jafari, Department of Agricultural Engineering, Shiraz University, Shiraz, Iran. Tel: +98 711 613 8370, Fax: +98 711 228 6104.
860
World Appl. Sci. J., 17 (7): 860-869, 2012
shape during drying process. Changes in shape and size of the products influence their physical properties which in turn modify final texture and transport properties of the dried foods [11]. A machine vision system has been developed to determine potato slice shrinkage during drying process which demonstrated the possibility of using machine vision in drying applications [12]. Color segmentation methods must be used when significant difference exists between the colors of samples at the different processing steps. Several colour spaces are used in colour analysis. RGB (Red, Green, Blue), HSI (Hue, Saturation, Intensity) and L*a*b (L* is the luminance, a* and b* are chromatic components) are the most common color spaces used in food processing applications. The correlations of colour and M.C. of large cooked beef joints have been investigated by computer vision. Colour features including the mean and the standard deviation in two color spaces, RGB and HSI have been used in that study. It was found that saturation had the highest correlation to the M.C. of the meat which shows its potential in determining the M.C. of the products being dried [13]. In case of rice quality evaluation it was found that the hue, saturation and intensity (HSI) color space could be used to evaluate various kernel defects, including kernel discolorations and chalkiness [14]. Also the development of color formation in pre-dried potato slices during frying has been studied analyzing color components of L*a*b color space [15]. Shrinkage of fruit due to dehydration changes the appearance of fruit texture. Texture can be regarded as a similarity grouping in an image. Image texture is an important image feature and has been applied greatly in the food industry [16]. The effect of drying on shrinkage, colour and some image texture features of apple discs has been studied too [17]. A relationship between area shrinkage and moisture content as well as color intensity was observed in case of ginseng drying [18]. In addition to size, shape, colour and texture, M.C. also plays a crucial role in prediction of the deterioration of food quality [19]. Excessive drying uses much of energy and affects on product quality indicators and if moisture is not brought down to desired limit, can lead to mildew product. Therefore, one of the most important factors in the process of drying is to achieve an optimum M.C. of the product. Measuring the M.C. during drying is not satisfactory due to some technical limitations in the sensor accuracy [20].
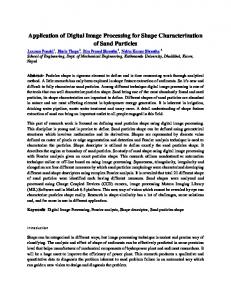
Artificial Neural Network (ANN) is a calculative approach that correlates input data with desired outputs by means of special learning processes. ANN does not need such a specific equation form. Instead, it needs sufficient input–output data [21]. ANNs are widely used in recent decade to simulate and predict useful parameters in drying [19, 22-28]. An ANN was developed for modeling the drying of carrots. Since simulated drying curves obtained with the model fit adequately the curves determined experimentally, it was concluded that the model was appropriate to be used for rough estimations in the selection of optimal operational conditions [29] while prediction of physical properties of osmotically dehydrated pumpkin achieved with R2 more than 0.9 when ANNs were used in combination with image analysis techniques [26]. Neural networks are capable to yield a superior accuracy with respect to statistical models [25]. Up to now, sampling at different time intervals is the most common way to measure the M.C. of the material. Such tests are not only destructive but also time consuming which is an obstacle for continuous drying systems. Developing a measuring tool that can instantly measure the M.C. of the samples is a requisite for continuous drying systems while machine vision techniques are useful methods reported in food quality related literatures [15, 30-33]. The incorporation of artificial neural networks with machine vision provides systems that can be trained by watching visual properties of the samples. This makes the system easy to use, flexible and able to work with many agricultural products. Several researches have been done on the drying of grapes in various fields up to now [6, 34-37]. However there is no study to assess the effect of dehydrating on the grape image apparent characteristics and the ability of machine vision equipped with ANN for grape M.C. estimation during drying; which is the objective of this article. MATERIAL AND METHODS Data Acquisition: White seedless grape samples were obtained from a local market. Raw and fresh samples used in the project were selected manually. Each of the grape samples was weighed. To avoid the shades, an illumination chamber was made to produce indirect uniform lighting on samples (Fig 1). A CCD camera (Canon IXUS 960IS; a 12 megapixel camera with 3.7x optical zoom) was mounted on top of the chamber at a
861
World Appl. Sci. J., 17 (7): 860-869, 2012
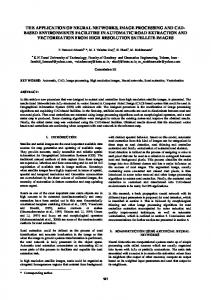
Image Processing: Sample images in different time intervals were analyzed according to the algorithm shown in Fig. 2. The procedure of image analysis and feature extraction was coded in MATLAB [38]. The gallery of image analysis steps is illustrated in Fig. 3. At the first step preprocessing operations was performed on the sample images to enhance the image contrast and remove the noises. Image segmentation was carried out to separate the samples from the background. Initial study of the main RGB components led to define a segmentation index denoted by M in equation 1: Fig. 1: Illumination chamber M=2B-G distance of 30 cm above the drying samples. Samples were placed on ceramic planes coated with heat-resistant paint and dried in an electrical oven (BM120, 800W, 220V with dimensions of 60×68×97 cm) at constant temperature of 50°C. Sampling, include weighing and image acquisition was performed every hour for the first 4 hours and every 2 hour for the last 12 hours. All sample photos taken with a resolution of 1600*1200. M.C. of the samples was determined by drying the samples at 105°C until a constant weight was attained. Dry basis M.C. was calculated and used for further operations in this work.
(1)
Optimal threshold Kcal was determined based on Otsu algorithm as a criterion to differentiate the grape samples from the background using the equation 1. The result was a binary image with ones and zeros corresponding to the grape berry and background respectively. All the foregoing stages of feature extractions must be done on raisins excluding the pedicel appears in some images. To remove the pedicel, morphological operations including subsequent erosion and dilation so called
Fig. 2: Flowchart of the image segmentation and feature extraction; K: grey-level intensity; Kcal: optimal threshold
862
World Appl. Sci. J., 17 (7): 860-869, 2012
Rs =
Shape Feature Extraction: The main goal of image processing algorithms is to extract useful information from processed image. The extracted information can then be analyzed and used for several operations depend on the aim of project. The developed algorithm was able to extract following morphological feature data from the images:
C
C
C
Surface area (As): The area of the raisin was determined by counting the number of pixels having a value of 1. The area could be mentioned in millimeter considering the area occupied by a single pixel that was 0.81 mm2. Perimeter (P): The perimeter was measured by counting the number of pixels laying on the border of the grape berry. Max diameter (Dmax) and Min diameter (Dmin) which are respectively the major and minor axis lengths of the object in the binary image. Equivalent diameter (Deq): Also called Feret diameter, is the diameter of the circle with the same area as the object [39]: Deq =
C
(3)
Entropy: measures the disorder of an image and it achieves its largest value when all elements in GLCM matrix are equal [40]. Entropy = −
∑∑ Cij log Cij i
(4)
j
Where Cij is (i,j)th element of GLCM. C
Energy: also called Angular Second Moment [42] or Uniformity [40], is a measure of textural uniformity of an image. Energy =
∑∑ Cij2 i
C 4 As π
)2
Texture Features Extraction: There are different statistical and structural approaches to describe the texture of a region. The Grey-level co-occurrence matrix (GLCM) is a statistical method which was used in this study. GLCM is often found a fairly good texture analysis method [41]. This matrix is then constructed from the image by estimating the pair-wise statistics of pixel intensity [42]. The co-occurrence matrices of ROI were calculated for four different orientations (0°, 45°, 90° and 135°) with a distance of 1 pixel between two adjacent pixels. The average of these GLCM was used and 4 textural features of 14 (widely used in literatures) were extracted from the ROI of images as below;
opening operation was performed on binary images. This operation was performed using a disk with 5 pixel diameter as the structuring element.
C
2
Color Features Extraction: In order to extract color information from the region of interest (ROI) and eliminate the data related to image background, logical AND was used to superimpose the binary image to the original color image. The resulting image was then converted from RGB to HSI and L*a*b* color spaces using the transformation equations [40] coded in Matlab as built-in function makecform [38]. The average values of color components for samples in each aforementioned color spaces were calculated.
Fig. 3: Several steps of image analysis: (a) original colour image of sample; (b) 2B-G image; (c) binary result of segmentation ; (d) removing the peduncle; (e) complement of image d; (f) superimposing image a on f
C
π(
As Dmax
(2)
Surface roundness (Rs): In a noncircular object, roundness is defined as the ratio of the area of the object to the area of the smallest circumscribed circle to the object [39]:
Inertia: also called contrast, is a measure of the amount of local variations present in an image. A high contrast value indicates a high degree of local variation [43]. Inertia =
∑∑ (i − j)2 Cij i
863
(5)
j
j
(6)
World Appl. Sci. J., 17 (7): 860-869, 2012
C
Correlation: measures the correlation between the elements of the matrix. When correlation is high the image will be more complex [42]. Correlation =
∑∑ i
(i − µ x )( j − µ y )Cij σ xσ y
j
(7)
Where µx, µy, Fx and Fy are average and standard deviation of Cx and Cy respectively. Cx and Cy are calculated as: Ng
C x (i ) =
∑
Ng
Cij
and
Cy ( j ) =
j =1
∑ Cij
(8)
i =1
Where Ng is the number of gray levels. Fig. 4: Structure of the ANN for M.C. prediction C
Inverse Difference Moment (IDM): measures image homogeneity. This parameter achieves its largest value when most of the occurrences in GLCM are concentrated near the main diagonal. IDM was calculated by eq. 9 [42]. IDM =
The best performance of the ANNs was selected based on higher values of coefficient of determination (R2), lowest values of the root means square error (RMSE) and mean absolute percentage error (MAPE) [21]. R 2 = 1 −
C
∑∑ 1 + (i −ij j)2 i
(9)
j
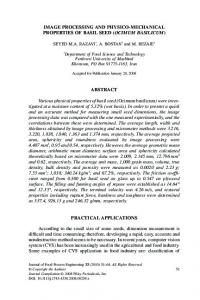
All of the morphological, textural and color information were exported to Excel sheet for further investigations. Artificial Neural Networks (ANN): To develop a robust M.C. measurement tool based on the whole extracted features including color, texture and shape features, multilayer perceptron neural networks with two hidden layers were developed. The back-propagation learning algorithm was used in the networks. Several topologies were assessed by changing the number of neurons in each hidden layer. The ANN was trained with LevenbergMarquardt (LM) learning algorithm which is known to be very efficient when applied to ANN [44]. Due to the large number of input data, principal component analysis (PCA) was used to omit the ineffective features from the inputs. Experimental M.C. values were output target vectors. To calibrate and evaluate the neural networks, 126 raisin samples were used in total. Input data were randomly divided to three parts; 60% of data were used for training, 20% for validation and 20% of data were excluded from the training stage and used for the network test. The network was coded in MATLAB. A schematic of ANNs with two hidden layer for M.C. prediction is shown in Fig. 4.
N
∑ (Yexp,i − YANN ,i )2 i =1
N
∑ (YANN ,i ) i =1
2
× 100
(10)
1/ 2
1 RMSE = N
(YANN ,i − Yexp,i )2 i =1
∑
(11)
1 MAPE = N
(YANN ,i − Yexp,i ) × 100 YANN ,i i =1
(12)
N
N
∑
Where, N is the number of samples, YANN,i is output of ANN for sample i and Yexp,i is the measured M.C. (target of ANN) for sample I. RESULTS AND DISCUSSION Sequential images of one of raisin samples during drying are shown in Fig. 5. As it can be seen, changes in the size, shape and color of the sample are evident. The variations of M.C. with drying time for raisin are shown in Fig. 6. The graph depicts that the M.C. of raisin was changed smoothly with drying time. The average initial M.C. of samples was about 4.56 (g H2O/g dry 864
World Appl. Sci. J., 17 (7): 860-869, 2012
The rate of changes in morphological features over 4 – 8 hours of drying process was more than the other intervals. This non linearity in morphological feature changes may be due to the distortion resistance of the product skin at the early period of moisture migration. Indeed, at the early stages of drying, free water can transfer from the capillary tubes without causing a significant change in the shape of the product. While as drying goes on, the structure of the tubes cannot sustain the contractions and collapses which causes the product shape to be changed deeply. After this period, changes in shape and volume reached nearly to its minimum magnitude so the rate of the changes decreased in the next stages. Changes of textural features for grape images are shown in Fig. 8. The textural information for each interval was normalized by dividing them to the first step data to facilitate the comparison. It can be seen in fig. 8 that the values of contrast (inertia) and entropy increased during the time while in case of inertia the trend was steeper than entropy. Entropy displays the irregularity of grayscale image and takes large values in texturally non-uniform images. Inertia represents the manner of local variations in an image. Unlike Entropy and inertia, the trend of changes in energy, correlation and IDM of images was decreasing. Energy reaches its highest value when grey level distribution has either a constant or a periodic form [46]. Correlation can be defined as the predictability of the grey level of a specific pixel regarding the second one in a pixel pair. This value closes to 1 (the highest value) in completely homogenous images. IDM is inversely related to the inertia. Generally it can be say that the energy,
Fig. 5: Changes of a single grape sample as a function of drying time (time in hours)
Fig. 6: The variations of M.C. during the time of drying matter) (about 81.5% w.b.). Under drying process the final M.C. decreased to 0.175 (g H2O/g dry matter) (about 15% w.b.). Fig. 7 illustrates the variations of morphological characteristics. It is evident that all morphological features of raisin decreased gradually with increase in drying time. This result conforms the results reported by [45] also matches to what have been reported for apple slices [17] and potato disks [12].
Fig. 7: The variations of morphological features during the time of drying 865
World Appl. Sci. J., 17 (7): 860-869, 2012
Fig. 8: The variations of textural features during the time of drying
Fig. 9: The variations of color features during the time of drying correlation and IDM decreased as the uniformity of sample images decreased due to dehydration. However, the variation of IDM over time was very low. In the Fig. 9, the changes in several components in RGB, HSI and L*a*b color spaces are depicted. Dehydration did not affect the Hue component appreciably. It means that the color of the samples is still the same color. It is the same for saturation value that means samples did not become pale or saturated during the drying; while drying caused the raisins to get darker respect to original grapes which in turn reduced the intensity component. All of other color components (except b*) had almost decreasing trend with drying time passed. a* is a chromatic component ranging between green and magenta (negative values indicate green while positive values indicate magenta). b* varies from blue to yellow (negative values indicate blue and positive values
indicate yellow). a* and b* components range from -120 to +120. As samples dried, the greenness decreased and magenta increased. These results were similar to those reported for changes in the color of apple disks during drying [17]. Although b* didn’t show a distinct trend as drying proceeded in this study. Tables 1 to 3 show that there were considerable linear relations with high correlation coefficient (R) more than 90% between M.C. and most of the extracted features. This means that some of the visual characteristics of raisin can be used as indices for prediction the M. C. by means of simple linear equations. Finally, to combine the different features and to enhance the accuracy of prediction, an ANN was developed and examined. Several topologies of multilayer perceptron networks were tested. Among the extracted features, 12 of them were selected after PCA and used as 866
World Appl. Sci. J., 17 (7): 860-869, 2012
CONCLUSIONS Relation between machine vision definable features with the moisture content of seedless grapes during dehydration was investigated. All morphological features decreased gradually as the M.C. decreased. Drying caused contractions in the grape skin which in turn increases the non-uniformity of the fruit surface and the appearance of the texture. Variation of color components in RGB and L*a*b color spaces was evident in the samples being dried. Eventually the ability of ANN was studied in M.C. prediction based on image extracted features. The final goal to predict the moisture content of the grape was carried out by exploiting a MLP neural network using visually extracted features. Assessment of the developed ANNs demonstrated the capability of using image based features as a measurement tool for M.C. determination instead of direct offline sampling.
Fig. 10: Performance of the ANN model for M.C. prediction Table 1: Correlation coefficients between M.C. and morphological features Feature
As
P
Deq
Dmax
Dmin
Rs
M.C.
0.905
0.717
0.886
0.522
0.941
0.591
REFERENCES
Table 2: Correlation coefficients between M.C. and textural features
1.
Feature
Entropy
Energy
Inertia
Correlation
IDM
M.C.
0.894
0.851
0.8057
0.962
0.948
Table 3: Correlation coefficients between M.C. and color features Feature R M.C.
G
B
H
S
V
L*
a*
2. b*
0.912 0.959 0.917 0.846 -0.573 0.915 0.965 -0.729 0.964
Table 4: Results of several MLP networks
3.
ANN
RMSE
R2 (%)
MAPE (%)
12-10-10-1
0.00235
99.70
0.1635
12-10-12-1
0.00247
99.51
0.1051
12-10-14-1
0.00078
99.84
0.0312
12-12-12-1
0.00175
99.73
0.0606
12-12-14-1
0.00196
99.76
0.0526
12-14-14-1
0.00094
99.80
0.0764
4.
5. inputs for the ANN. The calculated R2, RMSE and MAPE values are shown on table 4. According to Table 1, the ANN with two hidden layers (12-10-14-1) and tangent sigmoid transfer function showed the best results with maximum value of the R2 (99.84%), lowest values of the RMSE (0.00078) and MAPE (0.0312%). The predicted versus measured M.C. values are plotted in Fig. 10. The developed ANN model can be employed for predicting the grape M.C. and other drying behaviors during dehydration based on image extracted information with high accuracy over 99.6%.
6.
7.
8.
867
Brosnan, T. and D.W. Sun, 2002. Inspection and grading of agricultural and food products by computer vision systems-a review. Computers and Electronics in Agriculture, 36: 193-213. Hemming, J. and T. Rath, 2001. Computer-Visionbased Weed Identification under Field Conditions using Controlled Lighting. J. agricultural Engineering Researches, 78: 233-243. Mohebbi, M., M.R. Akbarzadeh, F. Shahidi, M. Moussavi and H.B. Ghoddusi, 2009. Computer vision systems (CVS) for moisture content estimation in dehydrated shrimp. Computers and Electronics in Agriculture, 69: 128-134. Khair, S.M. and S.A.S. Shah, 2005. Grape Drying: An Indigenous Profitable Enterprise in Balochistan. J. Applied Science, 5(3): 563-568. FAO; FAOSTAT Database: agriculture data. Accessed 30 june 2010. Available on the Internet: http://faostat.fao.org /site /339 /default.aspx. Fadhel, A., S. Kooli, A. Farhat and A. Bellghith, 2005. Study of the solar drying of grapes by three different processes. Desalination, 185: 535-541. Doymaz, I., 2006. Drying kinetics of black grapes treated with different solutions. J. Food Engineering, 76: 212-217. Kiranoudis, C.T. and N.C. Markatos, 2000. Pareto design of conveyor-belt dryers. J. Food Engineering, 46: 145-155.
World Appl. Sci. J., 17 (7): 860-869, 2012
9.
10.
11.
12.
13.
14.
15.
16.
17.
18.
19.
20.
21.
Paulus, I. and E. Scherevens, 1999. Evaluating and modelling the size classification of apples. J. Agricultural Engineering Research, 74(4): 411-419. Jayas, D.S., J. Paliwal and N.S. Visen, 2000. Multilayer neural networks for image analysis of agricultural products. J. Agricultural Engineering Research, 77(2): 119-128. Yan, Z., J.M. Sousa-Gallagher and A.R.F. Oliveira, 2007. Shrinkage and porosity of banana, pineapple and mango slices during air-drying. J. Food Engineering, 83(3): 430-440. Yadollahinia, A. and M. Jahangiri, 2009. Shrinkage of potato slices during drying. J. Food Engineering, 94: 52-58. Zheng, C., D.W. Sun and L. Zheng, 2006. Correlating colour to moisture content of large cooked beef joints by computer vision. J. Food Engineering, 77: 858-863. Jinorose, M., S. Prachayawarakorn and S. Soponronnarit, 2010. Development of a Computer Vision System and Novel Evaluation Criteria to Characterize Color and Appearance of Rice. Drying Technology, 28(9): 1118-1124. Pedreschi, F., J. Leon, D. Mery, P. Moyano, R. Pedreschi, K. Kaack and K. Granby, 2007. Color development and acrylamide content of pre-dried potato chips. J. Food Engineering, 79: 786-793. Wu, D., H. Yang, X. Chen, Y. He and X. Li, 2008. Application of image texture for the sorting of tea categories using multi-spectral imaging technique and support vector machine. J. Food Engineering, 88: 474-483. Fernández, L., C. Castillero and J.M. Aguilera, 2005 An application of image analysis to dehydration of apple discs. J. Food Engineering, 67: 185-193. Martynenko, A.I., 2006. Computer-vision system for control of drying processes. Drying Technology, 24(7): 879-888. Du, C.J. and D.W. Sun, 2004. Recent developments in the applications of image processing techniques for food quality evaluation. Trends in Food Science & Technology, 15: 230-249. Farkas, I., P. Remenyi and B. Biro, 2000b. Modeling aspects of grain drying with a neural Network. Computers and Electronics in Agriculture, 29: 99-113. Menlik, T., M.B. Özdemir and V. Kirmaci, 2010. Determination of freeze-drying behaviors of apples by artificial neural network. Expert Systems with Applications, 37: 7669-7677.
22. Kaminisky, W., P. Strumillo and E. Tomczak, 1998. Neural computing approaches to modeling of drying process dynamics. Drying Technology, 16: 967-992. 23. Farkas, I., P. Remenyi and B. Biro, 2000a. A neural network topology for modeling grain drying. Computers and Electronics in Agriculture, 26: 147-158. 24. Hernandez-Perez, J.A., M.A. Garc2a-Alvarado, G. Trystram and B. Heyd, 2004. Neural networks for the heat and mass transfer prediction during drying of cassava and mango. Innovative Food Science and Emerging Technologies, 5: 57-64. 25. Martynenko, A., S.X. Yang and A. Leilei, 2007. Intelligent computation of moisture content in shrinkable biomaterials. Drying Technology, 25(10): 1667-1676. 26. Shafafi, M., S. Devahastin, M.A. Razavi, F. Shahidi and H.R. Poreza, 2008. Use of artificial neural network and image analysis to predict physical properties of osmotically dehydrated pumpkin. Drying Technology, pp: 132-144. 27. Momenzadeh, L., A. Zomorodian and D. Mowla, 2010. Experimental and theoretical investigation of shelled corn drying in a microwave-assisted fluidized bed dryer using Artificial Neural Network. Food and bioproducts processing. In Press, Corrected Proof. 28. Zomorodian, A., L. Momenzadeh and D. Mowla, 2010. Applying Artificial Neural Network for Drying Time Prediction of Green Pea in a Microwave Assisted Fluidized Bed Dryer. J. Agricultural Science and Technology (JAST). In Press, Corrected Proof. 29. Cubillos, F. and A. Reyes, 2003. Design of a model based on a modular neural network approach. Drying Thechnology, 21: 1185-1195. 30. Lu, J., J. Tan, P. Shatadal and D.E. Gerrard, 2000. Evaluation of pork color by using computer vision. Meat Science, 56: 57-60. 31. Sun, D.W. and T. Brason, 2003. Pizza quality evaluating using computer vision. Part 2. Pizza topping analysis. J. Food Engineering, 57: 91-95. 32. Louka, N., F. Juhel, V. Fazilleau and P. Loonis, 2004. A novel colorimetry analysis used to compare different drying fish processes. Food Control, 15: 327-334. 33. Yam, K.L. and S.E. Papadakis, 2004. A simple digital imaging method for measuring and analyzing color of food surfaces. J. Food Engineering, 61(1): 137-142.
868
World Appl. Sci. J., 17 (7): 860-869, 2012
34. Tulasidas, T.N., G.S.V. Raghavan and E.R. Norris, 1996. Effects of dipping and washing pre-treatment on microwave drying of grape. J. Food Process Engineering, 19: 15-24. 35. Pangavhane, D.R., R.L. Sawhney and M. Sarsavadia, 2000. Drying kinetics studies on single layer Thompson seedless grape under controlled heated air conditions. J. Food Processing and Preservation, 24: 335-352. 36. Hamdy, H.E.G., 2006. Experimental investigation and empirical correlations of thin layer drying characteristics of seedless grapes. Energy Conversion and Management, 47: 1610-1620. 37. Zomorodian, A. and M. Dadashzadeh, 2009. Indirect and mixed mode solar drying models for Sultana grape. J. Agricultural Science and Technology (JAST), 11: 391-400. 38. The Mathworks, Inc. 2010. Matlab software, version 7.10.0.499 (R2010a). 39. Mohsenin, N.N., 1986. Physical Properties of Plant and Animal Materials. (2nd edition). New York: Gordon and Breach Science Publishers. 40. Gonzales, R.C. and R.E. Woods, 2002. Digital image processing (2nd edition). Prentice-Hall Incorporation, New Jersey.
41. Sharma, M. and S. Singh, 2001. Evaluation of texture methods for image analysis. Proceedings of the 7th Australian and New Zealand Intelligent Information Systems Conference, pp: 117-121. 42. Haralick, R.M., K. Shammugam and I. Dinstein, 1973. Textural features for image classification. IEEE Transactions on Systems, Man and Cybernetics, 3: 610-621. 43. Park, B. and Y.R. Chen, 2001. Co-occurrence matrix texture features of multi-spectral images on poultry carcasses. J. Agricultural Engineering Research, 78(2): 127-139. 44. Hagan, M.T. and M.B. Menhaj, 1994. Training feed-forward networks with the Marquardt algorithm. IEEE Transactions on Neural Networks, 5: 989-993. 45. Ramos, I.N., C.L.M. Silva, A.M. Sereno and J.M. Aguilera, 2004. Quantification of microstructural changes during first stage air drying of grape tissue. J. Food Engineering, 62(2): 159-164. 46. Pennacchio, S. and D. Rizzo, 2005. Intelligent Traction Control for Wheeled Space Vehicles. Proceedings of the 6th WSEAS International Conference on FUZZY SYSTEMS, Lisbon, Portugal, pp: 51-55.
869