ANALYTICAL BIOCHEMISTRY ARTICLE NO.
240, 134–141 (1996)
0340
Application of Multivariate Curve Resolution to Voltammetric Data II. Study of Metal-Binding Properties of the Peptides J. Mendieta, M. S. DıB az-Cruz, R. Tauler, and M. Esteban1 Departament de QuıB mica AnalıB tica, Facultat de QuıB mica, Universitat de Barcelona, Av. Diagonal 647, 08028 Barcelona, Spain
Received March 25, 1996
The complexation of Cd2/ by glutathione (GSH), in 0.13 M borate buffer at pH 9.5, was studied by differential pulse polarography (DPP) and multivariate curve resolution. The Cd–GSH system has been chosen as a model to check the possibilities of this new polarographic approach to the study of metal ion complexation by peptides. Experimental data obtained by DPP for different Cd2/-to-GSH concentration ratios have been analyzed by a procedure which consists of using several chemometrical techniques based on factor analysis: principal component analysis, evolving factor analysis, and multivariate curve resolution with alternating least-squares (ALS) optimization. The use of different constraints during the ALS optimization process, such as nonnegativity and unimodality constraints, yields the optimal sought solution from a chemical point of view. In the present work, a new constraint has been implemented during ALS optimization to take into account the expected peak-shaped signal of DPP. This data treatment allows us to detect simultaneously the formation of 1:1 and 1:2 Cd:GSH complexes which were very difficult to detect by univariate analysis of DPP data. It is concluded that the described multivariate curve resolution method could be a reliable tool for studying metal-binding properties of peptides. q 1996 Academic Press, Inc.
Metal ions play an important role in the stabilization of the spatial structure of a variety of proteins. For instance, zinc is an important structural component of enzymatic proteins, such as aspartate transcarbamoylase (1), and it is necessary to keep the DNA-binding activity in zinc finger transcription factors (2). Other 1 To whom correspondence should be addressed. Fax: 34-34021233. E-mail:
[email protected].
gene regulatory proteins also contain small domains structurally organized around coordinated Zn ions. This is the case with steroid receptors (3) and GAL4 families (4). In some cases, the DNA-binding activity can be efficiently restored by other heavy metals with the same coordination features (i.e., Cd) (5). Among metalloproteins, metallothioneins (MT)2 are a very interesting example of the capacity of metal ions to induce acquisition of a definite three-dimensional structure. In MTs, the polypeptidic chain is folded around two polynuclear clusters of cadmium and/or zinc in which metal ions are linked by bridging and terminal cysteine thiolate ligands (6, 7). Voltammetric techniques have been widely used to study the interactions between metal ions and a diversity of ligands (8), including either simple monomeric ligands (such as amino acids) or macromolecular ligands (9), especially those of environmental interest such as humic acids (10), polycarboxilic acids (11), or some polysaccharides (12). These techniques can yield information about the physicochemical properties of the metal complexes. Furthermore, some of the more sophisticated voltammetric techniques, such as differential pulse polarography (DPP), are reliable at very low concentrations, much lower than those used in classical spectrophotometric and potentiometric investigations. However, voltammetry has been rarely used in the analysis of metalloproteins, at least in comparison with other families of compounds (13), but some model compounds for the investigation of the heavy metal interaction with sulfhydryl groups have been used, including the tripeptide glutathione (GSH) and the syn2 Abbreviations used: ALS, alternating least squares; DPP, differential pulse polarography; EFA, evolving factor analysis; FA, factor analysis; MT, metallothionein; GSH, glutathione (g-L-glutamyl-Lcysteinylglycine); PCA, principal component analysis; SMDE, static mercury drop electrode.
134
AID
0003-2697/96 $18.00 Copyright q 1996 by Academic Press, Inc. All rights of reproduction in any form reserved.
AB 9682
/
6m1c$$$$61
08-05-96 22:01:06
aba
AP: Anal Bio
MULTIVARIATE CURVE RESOLUTION OF VOLTAMMETRIC DATA
thetic peptide acetylcysteine methyl amide (14), as well as the synthetic peptide Ala-Cys-Cys-Thr-Cys-Lys corresponding to the C-terminal fragment of mouse liver MT I (15). The interpretation of voltammetric data is cumbersome in some cases, especially when several signals appear in the voltammogram and their relative sizes and morphologies change during experiment. For some well-known paradigmatic cases, proper interpretation of voltammetric data (obtained for metal ions in the presence of ligands) can be made using an a priori theoretical model about the complexation and the main features of the electrochemical process, followed by fitting the parameters of the deduced electrochemical equations of such a model to the experimental data. This approach can be designated hard modeling, and it is the common approach used in electrochemical investigations. However, in many cases the postulation of an a priori theoretical model is very difficult due to either the rather complicated electrode process or the involved complexation process. In these cases another type of approach could be of the highest interest. A completely different approach is soft modeling. This approach involves the identification of a model from numerical and statistical analyses of a data set instead of fitting of an a priori assumed external theoretical model to the experimental data (16). With the explosive growth of chemometrics in recent years, this new general approach has been very useful, for instance, in the study of multiequilibria systems by spectrophotometric titrations (17). Soft modeling is based on the use of a family of computational and statistical techniques concerned with the isolation of sources of variation in an experimental data set. Among these techniques, factor analysis (FA) techniques play a key role (18). Within FA, a recently developed multivariate curve resolution method (17, 19) has been shown to be a powerful method for the study of metal ion complexation processes by spectrophotometric means. Later, this method was applied to the voltammetric study of metal ion complexation with some homofunctional macromolecular ligands (polycarboxylic acids), allowing a chemical model to be identified from the resolution of the concentration profiles for species distribution and of the individual voltammograms for each species. Moreover, the apparent stability constants were determined (20). The ability of this approach to investigate the interactions of the metal ions with peptides by electrochemical means is unexplored. In this work, the Cd2/ – GSH system has been chosen to investigate the possibilities of the soft modeling approach as a new tool for studying metal – peptide complexes by electrochemical means. The voltammetric behavior of GSH in the presence of Zn2/
AID
AB 9682
/
6m1c$$$$62
08-05-96 22:01:06
135
and Cd2/ was already studied by DPP, in Tris buffer at pH 9.1, by a classical approach (14). Through the titration of Cd2/ with GSH, it was observed that, in contrast to the reaction of Cd2/ with cysteine, equimolar concentrations of GSH were not sufficient for the completion of the reaction with the metal ion. Only at thiol concentrations corresponding to a 1:2 molar ratio of Cd:GSH did the reaction seem to be terminated. These findings suggested the predominant formation of the 1:2 Cd:GSH complex without formation of a stable 1:1 intermediate. From the titrations of GSH with Cd2/, a semilogarithmic representation (peak height of the complex reduction vs log [Cd2/]) showed a slight slope change which was associated with the formation of the less stable 1:1 complex. The global formation constant was determined by competitive complexation with nitrilotriacetic acid (NTA): log b2 Å 14.4. However, it must be mentioned that the complexity of the polarographic responses shown suggests that the measurement of the peak height cannot be a simple matter in some cases. On the other hand, metal complexes of GSH have been extensively studied (21), mainly by potentiometric means (22, 23), proton NMR (24), and 13C NMR (25). In potentiometric studies, the concentration diagrams of species distribution in a wide pH range were obtained, and the stability constants were determined. It must be mentioned, however, that some discrepancies about some of the postulated species can be observed (22, 23). Because of the previous investigations of GSH by different techniques based on completely different phenomena, the choice of the Cd – GSH system seemed to us as very idoneous to check the possibilities of the proposed multivariate curve resolution method, especially with respect to previous classical approaches (14). Additionally, a new procedure is proposed for optimal recovery of voltammetric peak shapes, which has not been proposed in previous investigations (20). MATERIALS AND METHODS
Materials Reduced glutathione (GSH) (ú99% iodometric purity) and a standard solution of Cd2/ (Titrisol) were purchased from Merck. All other chemicals were of analytical grade. Ultrapure water from a Milli-Q plus 185 system was used. DPP measurements were carried out with an Autolab System (EcoChemie, The Netherlands) attached to a Metrohm 663 VA Stand (Metrohm, Switzerland) and a personal computer using a GPES2 software package (EcoChemie). The system was also connected to a Metrohm 665 Dosimat for the automatic addition of the standard solution of Cd2/. In all experiments, the working, reference, and auxiliar electrodes were the static mercury drop electrode (SMDE), with
aba
AP: Anal Bio
136
MENDIETA ET AL.
a drop area of 0.40 mm2, Ag/AgCl, KCl (3 M), and glassy carbon, respectively. Pulse duration of 40 ms, pulse amplitude of 25 mV, drop time of 0.8 s, and a scan rate of 6 mV/s were used. Measurements were performed at room temperature in a glass cell. Purified nitrogen was used for deaeration. GSH additions were made with a Socorex Swiss micropipete. Methods Twenty-five milliliters of 0.13 M borate buffer at pH 9.5 was placed into the voltammetric cell and deareated with pure nitrogen for 20 min. Then, the DPP voltammogram was recorded. An aliquot of the standard GSH solution (oxygen-free, fresh, and containing the same borate buffer solution) was added, with a micropipet, to the cell. After deareation for 1 min, with mechanical stirring, a new DPP curve was recorded. Then, the aliquots of a standard Cd2/ solution were automatically added to the cell in order to change the Cd2/to-GSH concentration ratio, and the respective DPP curves were recorded. All of these solutions were deaerated after the Cd2/ addition for 1 min. During the measurements, nitrogen was passed over the surface of the solutions. Data Treatment Experiments were carefully planned in order to fulfill the necessary conditions for use of FA (18). First, experimental data obtained from various polarographic runs at different metal-to-peptide ratios must be equally spaced; i.e., voltammograms are recorded with the current measured at equally spaced potentials that are always identical. This can easily be ensured by the use of a computerized electrochemical system which can program and store the measuring procedure, run the experiments, and store the data and procedure on the disk unit. Second, it is preferable that the measured signal (current) be linearly dependent on the concentration of the electroactive species present in the investigating system, and this condition is usually satisfied for the electrochemical techniques normally used (20). In this work, DPP has been chosen in order to obtain peak-shaped signals and, as a consequence, a higher resolution between responses corresponding to different chemical species, at least in relation with other electrochemical techniques giving sigmoidalshaped signals, such as direct current polarography or normal pulse polarography. In all cases the background current (obtained for supporting electrolyte) was subtracted from the currents obtained in the presence of the electroactive substances. Individual voltammograms recorded at different metal-to-peptide ratios were smoothed by fast Fourier transform filtering using TableCurve 2D software (Jandel Scientific) and arranged in a data matrix of
AID
AB 9682
/
6m1c$$$$62
08-05-96 22:01:06
currents I(nR,nC), with as many nR rows as number of recorded voltammograms at each metal-to-ligand ratio and as many nC columns as potentials scanned during the current measurements. The first basic goal of FA and principal component analysis (PCA) (18) is to decompose mathematically the experimental data matrix I into a product of two abstract orthogonal matrices, usually denoted scores Q(nR,nS) and loadings PT(nS,nC), for a preselected number of components nS, contributing to the measured signal. This can be expressed as I Å QPT / E,
[1]
where E is a residual matrix containing the variance not explained by Q and PT. The number of components, nS, is chosen to minimize the residual data variance in E, leaving in it if possible only the experimental error contribution. There are many methods proposed for such a selection of the number of components. In this work the set of the more probable number of components is first investigated simply from inspection of the magnitude of singular values of matrix I and from the magnitude of residuals of unexplained data variance in E. From this pure mathematical analysis of data, a reduced set of more probable number of components is deduced, usually a set of two or three possible number of components. One of the basic assumptions is that the major components are associated with the different chemical sources of data variation, loosely interpreted here as chemical species. Once this number is estimated, the data structure is analyzed using evolving factor analysis methods (EFA) (26, 27), which provide estimations of the windows of existence of each species and how the system evolves during the experiment. Another useful tool is the local rank analysis by evolving factor analysis with a fixedsize window (27) which allows one to estimate how many species coexist at the different stages of the experiment, starting with an excess of the ligand and finishing with an excess of the metal ion (see Materials and Methods). From these techniques it is possible to detect where (at what metal-to-ligand ratio or at what potential) a certain species predominates (28). From initial estimations derived from EFA or from individual voltammograms acquired at metal-to-ligand ratios where one species predominates, a constrained alternating least-squares (ALS) optimization is started to try to recover the correct set of concentration profiles and individual voltammetric responses. This recovery is based on the assumption that the instrumental responses of the chemical contributions are bilinear and can be expressed in the matrix equation I Å CV / E,
aba
AP: Anal Bio
[2]
137
MULTIVARIATE CURVE RESOLUTION OF VOLTAMMETRIC DATA
where C is a matrix describing how the chemical contributions (e.g., species distribution) change, with a number of rows equal to the number of experimental measured voltammograms and a number of columns equal to the number of proposed chemical contributions; and V is the matrix of the pure individual voltammetric contributions, with a number of rows equal to the number of proposed chemical contributions and a number of columns equal to the number of scanned potentials. When an initial estimation of the individual voltammograms is available, the best least-squares solution of the concentration profiles is estimated from C Å IV/ ,
[3]
where V/ is the pseudoinverse (29) of the V matrix. If an initial estimation of the concentration profiles is available, then the best least-squares estimation of the voltammetric contributions is estimated from V Å C/ I,
[4]
where now C/ is the pseudoinverse of the C matrix. The least-squares solutions obtained in this way are pure mathematical solutions which probably will not be optimum from a chemical point of view. For instance, they can have negative concentrations, and the shapes of the concentration and voltammetric profiles can be unreasonable, with double peaks. Therefore an ALS optimization procedure is started, resolving iteratively the two equations previously given and constraining, at each stage of the iterative optimization, the solutions to be nonnegative and unimodal. This iterative procedure is carried out until the solutions and the experimental data fitting do not improve. Details on the implementation of this method are described elsewhere and it has been applied to different types of chemical data (30, 31). In the present work, a new constraint has been implemented during the ALS optimization to take into account the expected peak-shaped signal of DPP. The main features of the peaks depend on the characteristics of the electrode process. Thus, the width at half peak depends on the electron transfer rate. Other factors can disturb the symmetry of the peaks, yielding tailed or asymmetric peaks. After a preliminary study about how the electrochemical response of a solution of Cd2/ fits to a set of possible peak equations, the asymmetric logistic equation was chosen as the best one. This equation yields, on one hand, a very good fit of the voltammograms and gives, on the other hand, a set of parameters which is easily related with the morphological features of the peaks. The parametric form of this equation is given by the expression
AID
AB 9682
/
6m1c$$$$62
08-05-96 22:01:06
S
S
DD
x / cln(d) 0 b c
y Å a 1 / exp 0
S
0d01
d0d
D
x / cln(d) 0 b , [5] c
(d / 1)d/1 exp 0
where a corresponds to peak amplitude and b corresponds to the x value at the peak maximum. Parameters c and d are related to the width at half peak and the degree of asymmetry of the peak, respectively. Similar expressions have been proposed for the deconvolution of polarographic peaks (32, 33). The implementation of this equation in the ALS program is carried out during the iterative optimization of the pure individual voltammetric contributions in VT. Optionally, each individual contribution, estimated at every ALS iterative cycle, is fitted to the equation previously given. The optimal values of a, b, c, and d are found by application of Marquardt’s nonlinear leastsquares method (34), implemented, as the rest of the described procedure, through MATLAB high-performance numeric computation and visualization software (35). These values of the parameters are then used to rebuild the new voltammetric contribution, which substitutes the previously estimation from the linear Eq. [3]. RESULTS AND DISCUSSION
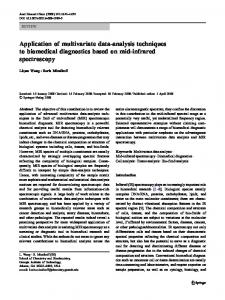
Electrochemical Behavior of GSH in the Presence of Cd2/ A DPP voltammogram of a metal-free solution of GSH at pH 9.5 shows a broad peak with a maximum at 00.62 V. The nature of the electrochemical response of –SH-containing molecules in mercury electrodes is still controversial in some details, but the generally agreed mechanism involves a strong adsorption step, which can be considered minimal at low concentrations, and a predominantly diffusion-controlled mechanism, involving electrochemical oxidation of the mercury from the electrode in the presence of –SH groups, giving the mercuric complex (13–15). The presence of increasing concentrations of Cd2/ strongly modifies the DPP voltammogram of GSH solutions (Fig. 1). The peak corresponding to free GSH decreases steadily until the Cd2/ concentration reaches a value close to the GSH half concentration, where it disappears completely. At more positive potentials (not shown in Fig. 1) a new peak appears. By analogy to other –SH-containing compounds (15), this new peak can be assigned to the oxidation of the mercury in the presence of a Cd–GSH complex. The evolution of this peak is the opposite of that of the free GSH peak and it has not been taken into account in this study.
aba
AP: Anal Bio
138
MENDIETA ET AL.
FIG. 1. Differential pulse polarograms of the Cd2/ –GSH system for different concentration ratios at 20 mM GSH and pH 9.5. (Mesh has been plotted from the experimental data matrix after the background current subtraction and the smoothing of individual polarograms by fast Fourier transform filtering.)
At low Cd2/-to-GSH ratios, a new well-defined peak, which corresponds to the reduction of Cd–GSH complexes, appears at 00.75 V. Its peak current increases at the same time that the Cd2/ concentration increases. However, when the concentration ratio of Cd2/ to GSH is higher than 0.5, the evolution of this peak becomes unusual, with the shape of the peak being strongly modified, increasing the width at half peak. The increment in peak current with increasing Cd2/ concentration is lower than that obtained at low Cd2/-to-GSH concentration ratios. For concentration ratios close to 1, a new peak appears at 00.65 V. This peak occurs at potentials coincident with those of the reduction of free Cd2/ under our experimental conditions.
in data variance from four (1.76%) to five (1.12%) components is negligible for the level of our instrumental error (ca. 1%). Once the number of components was assumed to be 4, an estimate of the evolution of these four components for different Cd2/-to-GSH concentration ratios was obtained from EFA. From this estimation, the ALS optimization previously described (20) is started to try to recover the correct set of chemical contributions and pure individual voltammetric responses. During the first optimization, only one constraint was applied: nonnegativity. Under these conditions, the lack of fit obtained was 4.64%. This relatively high value compared with PCA solution (lack of fit of 1.73%) must be explained as a result of the background subtraction procedure, which was rather difficult to apply because the background current changes during the experiment, probably due to the presence of adsorption phenomena. Figure 3 shows the normalized individual voltammograms (a), the distribution of residuals versus the potential at different Cd2/-to-GSH concentration ratios (b), and the contribution profiles for each signal (c) finally recovered after ALS optimization was applied to the data matrix, using only the nonnegativity constraint. The normalized individual voltammogram assigned to free Cd2/ presented two electrochemical peaks (curve IV in Fig. 3a). The main peak presents a maximum at the potential of free Cd2/ (00.65 V), but another peak at more negative potential (00.77 V) was also present. Because a double peak for the reduction of free Cd2/ has no sense, a unimodality constraint has also been used to prevent this signal from being composed of more than one peak. When a unimodality constraint was also imposed, the lack of fit increased to 8.01%. Figure 4 shows the results obtained using both nonnegativity and unimodality constraints. In the
Multivariate Curve Resolution without Shape Constraint The whole experiment shown in Fig. 1 was reordered in a matrix of currents in which PCA was applied. Figure 2 shows the singular-value analysis plots obtained for an increasing number of considered components. From these results, it is possible to conclude that experimental data can be explained satisfactorily by assuming the contribution of four components. This conclusion is also supported by the results expressed as a percentage of the lack of fit values for a particular number of components. These values express the percentage of unexplained data variance when three, four, or five components are considered. Whereas the unexplained change in data variance is still important from three (4.91%) to four (1.73%) components, the change
AID
AB 9682
/
6m1c$$$$63
08-05-96 22:01:06
FIG. 2. Singular values of the experimental data matrix obtained for the Cd–GSH system (20 mM GSH, pH 9.5).
aba
AP: Anal Bio
MULTIVARIATE CURVE RESOLUTION OF VOLTAMMETRIC DATA
139
Cd–GSH complexes in solution, the electrochemical contributions of surface phenomena, such as the adsorption, were intended to be left in the residuals and not taken into account, even if the lack of fit increased appreciably (from 4.64 to 8.01%). However, this question will require further investigation. Voltammogram I in Fig. 4a corresponds to the GSH signal in the absence of Cd2/ and, therefore, can be interpreted as due to free GSH. Voltammograms II and III are associated with the contributions of Cd–GSH complexes. The well-defined peak II is assigned to the complex detected at low Cd2/ concentrations. The contribution of the second Cd–GSH complex is a broader peak (III in Fig. 4a), different from the theoretical DPP peaks, and overlaps almost completely with peak II. The estimated electrochemical contribution profiles
FIG. 3. Alternating least-squares (ALS) optimization of the experimental data with the nonnegativity constraint. (a) Individual voltammograms I, II, III, and IV. (b) Residual distribution as a function of the potential. (c) Contribution profiles for I, II, III, and IV.
case of the voltammogram identified as free Cd2/ (IV in Fig. 4a), the maximum current was at the expected potential (00.65 V), but an important amount of residuals accumulated at potentials around 00.77 V (Fig. 4b), just where the electrochemical contribution associated with free Cd2/ presented a secondary peak when the unimodality constraint was not applied during ALS optimization (Fig. 3b). The other residuals presented a distribution similar to that obtained when the unimodality constraint was not used. The fact that residuals had a peak shape, especially in the region at more negative potentials, and their magnitude was correlated with the Cd2/ concentration could be due to the presence of induced adsorption phenomena (37). Because the goal of this work was the characterization of the
AID
AB 9682
/
6m1c$$$$63
08-05-96 22:01:06
FIG. 4. Alternating least-squares (ALS) optimization of the experimental data with the nonnegativity and unimodality constraints. a, b, and c as in Fig. 3.
aba
AP: Anal Bio
140
MENDIETA ET AL.
are shown in Fig. 4c. No significant changes can be observed in relation to those obtained when the unimodality constraint was not applied during the ALS optimization (Fig. 3c). Free GSH (curve I) decreases when the first Cd–GSH complex (curve II) starts to be formed. This first complex reaches a maximum at the same Cd2/-to-GSH concentration ratio that the second Cd–GSH complex (curve III) is detected. For higher Cd2/-to-GSH concentration ratios, a progressive substitution of the first Cd–GSH complex by the second one is observed. Free Cd2/ (curve IV) is detected when the second Cd–GSH complex reaches saturation, and it increases linearly for Cd2/-to-GSH concentration ratios higher than 1. These results are chemically compatible with the formation of a 1:2 (Cd:GSH) complex, at low Cd2/-to-GSH concentration ratios, which is progressively substituted by a second 1:1 complex when the Cd2/-to-GSH concentration ratios increase. Multivariate Curve Resolution with Shape Constraint Despite the finding that the electrochemical contribution profiles obtained after constrained ALS optimization can be chemically interpreted, the shape of the normalized individual voltammogram III cannot be explained, in electrochemical terms, as a single chemical contribution. Voltammogram III is truncated and almost completely contains voltammogram II. Visual inspection of the voltammogram III shows that it is possibly formed by two overlapping electrochemical contributions, one from peak II and the other from another peak with a maximum at less negative potentials. In order to overcome this problem, a shape constraint was imposed during the ALS optimization, taking into account the theoretically expected shape for DPP peaks (see data treatment, Eq. [5]). Initial ALS estimations of the C matrix were taken from the optimized profiles obtained without the shape constraint. Figure 5 shows the results obtained when the nonnegativity, unimodality, and shape constraints were applied. The lack of fit after this constrained ALS optimization increased to 13.43%. The normalized individual voltammograms (Fig. 5a) now present the theoretical shape for DPP peaks. Although the peaks partially overlap, their maxima are well defined. The width at half peak and the degree of asymmetry are different for each peak, indicating some differences in the electrode processes. Very well-defined peak shape residuals (Fig. 5b) are now even more accumulated in the more negative region. Although nonsignificant differences were detected for free GSH and Cd2/ profiles, the profiles of metal complexes are significantly different from those obtained without the shape constraint (Fig. 4c vs Fig. 5c). Curves II and III reach a saturation plateau at Cd2/-to-GSH concentration ratios of ca. 0.5 and 1, respectively. The differences between the pro-
AID
AB 9682
/
6m1c$$$$63
08-05-96 22:01:06
FIG. 5. Alternating least-squares (ALS) optimization of the experimental data with the nonnegativity, unimodality and shape constraints. a, b, and c as in Fig. 3.
files of Figs. 4c and 5c can be explained if individual voltammograms obtained with the shape-constrained algorithm are interpreted not as pure individual voltammograms of chemical species but as electrochemical responses due to the reduction of Cd2/ in two different chemical environments (i.e., coordinated to groups of different nature). At low Cd2/-to-GSH concentration ratios, the Cd(GSH)2 complex is the predominant species, but when the Cd2/ concentration increases, a second Cd2/ is incorporated into the complex given a final stoichiometry 1:1 Cd:GSH. Because the profiles of voltammograms II and III do not change at Cd2/-to-GSH ratios higher than 1 (there are no substitutions of the first complex for the second one), the Cd2(GSH)2 complex, with two different binding sites for Cd2/, seems to be the actual predominant
aba
AP: Anal Bio
MULTIVARIATE CURVE RESOLUTION OF VOLTAMMETRIC DATA
species. This hypothesis is in agreement with observations from 113Cd NMR corresponding to 113Cd(II)–GSH complex with chemical shifts similar to those of 113Cd(II)MT, in which cadmium is present in a polynuclear cluster linked by bridging cysteine thiolate ligands (21). This hypothesis allows an alternative explanation for the residuals accumulated at the more negative potentials. If the two cadmium-binding sites are not completely independent (i.e., the two ions are organized in a binuclear cluster), then the incorporation of the second Cd2/ could modify the electrochemical response of the first Cd(GSH)2 complex, hindering the fitting when only one peak is considered for this species for all the Cd2/-to-GSH ratios studied. However, because the residuals that were obtained increase linearly with the concentration of Cd2/, even after the saturation of the signals corresponding to Cd–GSH complexes (no more complex formation), the more probable explanation for the residuals would be the induced adsorption phenomenon together with the unavoidable background subtraction applied to raw experimental data. In order to obtain more information about the precise nature of the two different Cd2/ binding sites, additional experiments are being carried out. In conclusion, the present study provides evidence that DPP associated with the multivariate curve resolution allowed the association of pure individual voltammograms with the signals corresponding to specific metal ions bound to different binding sites. The use of factor analysis techniques associated with the voltammetric methods is found to be a very useful tool for the study of metal ions in biological systems. ACKNOWLEDGMENTS The authors gratefully acknowledge financial support from the Ministerio de Educacio´n y Ciencia (DGICYT, Projects PB93-1055 and PB93-0744), from the Direccio´ General de Universitats de la Generalitat de Catalunya (GRQ93-1028), and also Professor A. Sorribas, from the Departament de Cie`ncies Me`diques Ba`siques of the Universitat de Lleida, for the facilities of using TableCurve 2D software (Jandel Scientific). J. Mendieta also acknowledges financial support from the Programa de Acciones para la Incorporacio´n de Doctores y Tecno´logos from the Ministerio de Educacio´n y Ciencia.
REFERENCES 1. Markby, D. W., Zhou, B. B., and Schachman, H. K. (1991) Proc. Natl. Acad. Sci. USA 88, 10568–10572. 2. Klug, A., and Rhodes, D. (1987) Trends Biochem. Sci. 12, 464– 469. 3. Luisi, B. F., Xu, W. X., Otwinowski, Z., Freedman, L. P., Yamamoto, K. R., and Sigler, P. B. (1991) Nature 352, 497–505. 4. Marmorstein, R., Carey, M., Ptashne, M., and Harrison, S. C. (1992) Nature 356, 408–414. 5. Pan, T., and Coleman, J. E. (1989) Proc. Natl. Acad. Sci. USA 86, 3145–3149. 6. Stillman, M. J. (1995) Coord. Chem. Rev. 144, 461–511.
AID
AB 9682
/
6m1c$$$$63
08-05-96 22:01:06
141
7. Stillman, M. J., Shaw, C. F., III, and Suzuki, K. T. (Eds.) (1992) Metallothioneins: Synthesis, Structure and Properties of Metallothioneins, Phytochelatins and Metal–Thiolate Complexes, VCH, New York. 8. Buffle, J. (1988) Complexation Reactions in Aquatic Systems: An Analytical Approach, Chap. 9, pp. 467–562, Ellis Horwood, Chichester. 9. Esteban, M., Arin˜o, C., DıB az-Cruz, J. M., and Casassas, E. (1993) Trends Anal. Chem. 12, 276–286, and references cited therein. 10. van den Hoop, M. A. G. T., and van Leeuwen, H. P. (1993) Anal. Chim. Acta 273, 275–287, and references cited therein. 11. DıB az-Cruz, J. M., Arin˜o, C., Esteban, M., and Casassas, E. (1993) Anal. Chim. Acta 273, 289–296, and references cited therein. 12. Nadal, A. M., Arin˜o, C., Esteban, M., and Casassas, E. (1992) Electroanalysis 4, 757–764. 13. Se`quaris, J. M. (1994) in Analytical Voltammetry (Smyth, M. R., and Vos, J. G. Eds.), pp. 115–157, Elsevier, Amsterdam. 14. Wagner-Roos, L., Zahn, H., Se´quaris, J. M., and Valenta, P. (1989) Toxicol. Environ. Chem. 22, 77–90. 15. Mendieta, J., Chivot, J., Mun˜oz, A., and Rodriguez, A. R. (1995) Electroanalysis 7, 663–669. 16. Brown, S. D., and Bear, R. S., Jr. (1993) Crit. Rev. Anal. Chem. 24, 99–131. 17. Tauler, R., Izquierdo-Ridorsa, A., and Casassas, E. (1993) Chemom. Intell. Lab. Syst. 18, 293–300, and references cited therein. 18. Malinowski, E. R. (1991) Factor Analysis in Chemistry, Wiley, New York. 19. Tauler, R., Smilde, A. K., and Kowalski, B. R. (1995) J. Chemom. 9, 31–58. 20. DıB az-Cruz, J. M., Tauler, R., Grabaric´, B. S., Esteban, M., and Casassas, E. (1995) J. Electroanal. Chem. 393, 7–16. 21. Rabenstein, D. L. (1989) in Glutathione: Chemical, Biochemical, and Medical Aspects (Dolphin, D., Avramovic, O., and Poulson, R., Eds.), pp. 147–186, Wiley, New York. 22. Perrin, D. D., and Watt, A. E. (1971) Biochim. Biophys. Acta 230, 96–104. 23. Corrie, A. M., Walker, M. D., and Williams, D. R. (1976) J. Chem. Soc. Dalton Trans., 1012–1015. 24. Rabenstein, D. L. (1973) J. Am. Chem. Soc. 95, 2797–2803. 25. Fuhr, B. J., and Rabenstein, D. L. (1973) J. Am. Chem. Soc. 95, 6944–6950. 26. Gampp, H., Maeder, M., Meyer, Ch., and Zuberbuhler, A. D. (1985) Talanta 32, 1133–1139. 27. Keller, H. R., and Massart, D. L. (1991) Anal. Chim. Acta 246, 279–290. 28. Windig, W., and Guilment, J. (1991) Anal. Chem. 63, 1425–1432. 29. Golub, G. H., and van Loam, Ch. F. (1989) Matrix Computation, The John Hopkins Univ. Press, Baltimore. 30. Casassas, E., Tauler, R., and Marques, M. (1994) Macromolecules 27, 1729–1737. 31. Tauler, R., and Casassas, E. (1992) Analusis 20, 255–268. 32. Huang, W., Henderson, T. L. E., Bond, A. M., and Oldham, K. B. (1995) Anal. Chim. Acta 304, 1–15. 33. Kamenev, A. I., Rumyantsev, A. Y., and Bogdanova, I. R. (1995) J. Anal. Chem. 50, 52–56. 34. Marquardt, D. W. (1963) J. Soc. Ind. Appl. Math. 11, 431–441. 35. Matlab Version 4.2 (1994) Math Works Inc., Cochituate Place, MA. 36. Mun˜oz, A., and RodrıB guez, A. R. (1995) Electroanalysis 7, 670– 673. 37. Anson, F. C. (1975) Acc. Chem. Res. 8, 400–407.
aba
AP: Anal Bio