Proceedings of the 9th AIAA/ISSMO. Symposium on Multidisciplinary Analysis and Optimization, AIAA Paper 2002-5531, Atlanta GA,. September 4-6, 2002.
APPLICATION OF PROBABILITY METHODS TO ASSESS CRASH MODELING UNCERTAINTY Karen H. Lyle* Langley Research Center, Hampton VA, 23681 Alan E. Stockwell† Lockheed Martin Space Operations, Hampton VA, 23681 Robin C. Hardy‡ NASA Langley Research Center, Hampton VA, 23681
Abstract Full-scale aircraft crash simulations performed with nonlinear, transient dynamic, finite element codes can incorporate structural complexities such as: geometrically accurate models; human occupant models; and advanced material models to include nonlinear stress-strain behaviors, and material failure. Validation of these crash simulations is difficult due to a lack of sufficient information to adequately determine the uncertainty in the experimental data and the appropriateness of modeling assumptions. This paper evaluates probabilistic approaches to quantify the effects of finite element modeling assumptions on the predicted responses. The vertical drop test of a Fokker F28 fuselage section will be the focus of this paper. The results of a probabilistic analysis using finite element simulations will be compared with experimental data. I. Introduction One goal of the NASA Aviation Safety Program System�s Approach to Crashworthiness element was the development of a validated crash simulation methodology, Ref. [1]. A validated simulation methodology can be utilized to aid in the future design and certification process, by reducing cycle times and costs. In order to validate the modeling approaches, correlation of the simulation results with experimental data is necessary. References [2] and [3] contain additional information about the correlation effort supported by this program. A major deficiency in the correlation approaches is the lack of information to adequately compute the effect of modeling assumptions and simplifications. In addition, insufficient information is available to quantify the uncertainty in the experimental data. The cost of performing a destructive test of a full-scale fuselage or fuselage section severely limits the number of repeat tests that can be performed. Factors affecting modeling and experimental uncertainty include: off-nominal impact conditions (e.g., attitude, velocity); material property
*
Aerospace Engineer, MS 495 Langley Research Center Senior Engineer, MS 389 Langley Research Center ‡ Aerospace Engineer, MS 495 Langley Research Center †
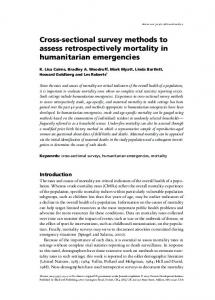
variations (e.g., yield, hardening modulus, failure, rate dependencies); and fabrication anomalies (e.g., nonuniform cross-sections, imperfect structural assembly). Many papers concerning probabilistic analysis for aerospace or vehicular applications exist in the literature. Sample applications can be found in Refs. [4-6]. An example specifically related to crashworthiness is found Ref. [7] for an automotive application. Although extensive work has been done to enable the use of probabilistic analysis, few applications involve impact dynamics of aircraft structures. Preliminary work utilizing probabilistic analysis to bound modeling uncertainty and for design optimization for an aircraft application has been documented in Ref. [8]. The objective of the present work is to demonstrate the application of probabilistic analysis to aircraft impact dynamics. The probabilistic analysis will be used to bound modeling uncertainty and identify areas for future work. The next section of the paper describes an impact test of a Fokker F28 fuselage section. The following sections then describe the pre-test finite element development and probabilistic analysis details. After the probabilistic analysis description, a comparison of the analytical results with experimental data will be presented. II. Description of Test A pre-test photograph of the structure to be studied is shown in Figure 1. The Fokker F28 section is from a retired commuter aircraft. The section is primarily fabricated from aluminum and is 1.5 meters long and 3.3 meters in diameter. This particular section was nearly symmetric axially as well as transversely. This near symmetry of the structure facilitates the development of the finite element model and the reduction of the experimental data. Twenty 75-lb. bars were attached to the seat rails to approximate the weight of the seats, occupants, etc. These simple bars were incorporated to minimize any additional structure and therefore reduce modeling complexity. Simplifying the add-on components enabled concentration on the fuselage structure details. The test was conducted at the NASA Langley Research Center (LaRC) Impact Dynamics Research Facility (now referred to as Landing and Impact Research Facility), Ref. [9], using the 70-ft drop tower. To attain a purely vertical impact velocity of 9.2 m/s, the section was released from a height of 4.3 m. The velocity was selected to reflect an aircraft undergoing a severe but survivable vertical impact. The nominal impact attitude was zero degrees of pitch, roll, and yaw. This test was planned to be the first in a series of tests designed to provide data to validate modeling approaches for a full aircraft crash simulation. As such, the test section was instrumented with 112 transducers to enable a detailed evaluation of simulation capabilities. This instrumentation included accelerometers, strain gages and displacement transducers. Visual targets were affixed to the structure for use in photogrammetric computations. For the purposes of this paper, selected vertical accelerations measured on the seat rails were used for comparison with the analytical results, see Figure 2. The 12 locations on the floor were selected because
these measurements are typical of fuselage impact applications. The comparisons between the experimental and probabilistic results will be based on the mean acceleration from 0 to 0.11 seconds after impact for each location. Several aspects were considered in the down-selection to the mean acceleration as the appropriate quantity for this application. First, the mean acceleration provides a global measure of the acceleration, independent of filtering frequency and instantaneous time. Second, the computation of the mean acceleration over a defined time period is readily automated. Third, the mean acceleration is frequently reported in the literature as a quantity used to evaluate the accuracy of finite element simulations. Based on the above information and extensive data evaluations, the experimental data were considered to be of sufficiently high quality to adequately evaluate and guide the development of the probabilistic analysis work.
Figure 1. Photograph of Fokker F28 fuselage section.
Seat rails
1
10
42
33
Accelerometers Starboard
4
13
45
36
7
14
46
39
Port
75-lb weights Top View
Figure 2. Schematic of fuselage floor with selected accelerometer locations numbered.
A sample frame from the video recorded during the test, see Figure 3, shows the fuselage just prior to the subfloor impact on the floor support. During the first 0.11 seconds, the primary nonlinear behavior was below the floor. A review of the video acquired during the test shows the yielding and failure of the ring frame/castellation at several circumferential locations. The upper structure was responding in a linear elastic manner and therefore, not of interest for this application. Although axial variations were visible post-test, Figure 3 shows that the deformations up to this point in time showed little variation in the axial direction.
Figure 3. Photograph of deformed Fokker F28 fuselage section. III. Description of Finite Element Simulations The pre-test finite element model development was based on three requirements to make it suitable for this study. The finite element model and simulations must be computationally efficient, stable, and capable of capturing the basic physics of the structural response. Computational efficiency is necessary to enable completion of numerous simulations. The simulations must be stable over the span of input parameters to avoid non-physical or non-feasible responses. Finally, the simulation must capture the basic physics of the aluminum fuselage section that experiences a vertical impact. In evaluating computational efficiencies, the authors were not only concerned with simulating the vertical drop test of the F28 fuselage section, but also with assessing the feasibility for future impact simulations of an entire aircraft. For pre-test predictions, a finite element model was developed by modifying an existing model of a similar aircraft. A structural loads finite element model of a Fokker 70 aircraft was obtained, see Figure 4(a). A four-frame section forward of the wings was extracted for use in the impact simulations, Figure 4(b). This section model is similar in location on the aircraft to the test article. The Fokker model was originally developed for conducting static stress analysis of a Fokker 70 aircraft for certification purposes and therefore incorporated many simplifying approximations. For example, the skin was modeled with a single row of elements between ring frames and stringers. The approximate modeling of the ring frames was another area of concern. The aircraft frames are attached to the skin by flexible members called “castellations” in order to reduce the stress in the frames when the fuselage is pressurized. A cross-sectional sketch of a typical frame/castellation detail is shown in Figure 5(a) along with the corresponding idealization used in the static stress model, Figure 5(b), and the impact model, Figure 5(c). All of the assumptions used in the static stress model (as well as the
metrics used to judge the performance of the approximation) were based on linear static behavior. The mesh density for the skin, ring frames and stringers was doubled in the circumferential, radial, and axial directions for the impact model. In addition, the CSHEAR elements were converted to CQUAD4 elements and the CBAR elements to CBEAM elements. The capitalized terms refer to specific designations in the codes. Any remaining improvements of frame and castellation modeling were postponed until after the test. The existing model was also modified to include test hardware such as the equipment mounting plate at the center of the floor section. Concentrated masses were used to model the 75-lb bars. Each concentrated mass represents one-half of the mass of the bar.
(a) Full aircraft model
(b) Impact section model
Figure 4. Schematic of finite elements models. Frame Castellation Skin
(a) Schematic of skin with frame and castellation CBEAM
CROD
CQUAD4
CQUAD4 CQUAD4
CROD CSHEAR CROD
(b) Stress model representation
CQUAD4
CBEAM CQUAD4 CBEAM
(c) Impact model representation
Figure 5. Details of ring frame modeling (Note: the modifications for the impact model are highlighted in bold in (c).) The aluminum material was modeled as bilinear elastic-plastic, with a maximum plastic strain failure mode. Different parameters were used to describe the material definitions for the castellations and frames, reflecting the fact that the castellations and frames were not fabricated from the same aluminum alloy. The skin, frames, castellations, floor support structure, and equipment mounting plates were modeled with CQUAD4 shell elements using the Key-Hoff formulation. Belytschko-Schwer beam elements were used to
model stringers, frame flanges, and floor support struts. The pre-test simulation model was comprised of approximately 6,000 elements. Each simulation executed using the nonlinear transient dynamic finite element code, MSC.Dytran�§, Ref. [10], required 75 minutes of CPU time. The deformed shape of the model just prior to subfloor impact on the floor supports is shown in Figure 6. As observed in the test, see Figure 3, substantial material yielding and failure was exhibited below the floor. However, little variation was evident in the axial direction. In addition, the simulation results show that the floor was substantially stiffer in the finite element model than existed in the test article. A gross comparison of experimental and analytical results are presented through the deformed shapes. However, direct comparison of time histories was not considered appropriate since the objective was to bound the analytical results based on several simulations with varying input parameters.
Figure 6. Sample simulation deformation.
IV. Description of Probabilistic Analysis A probabilistic approach was explored to approximate the uncertainty inherent in the modeling and simulation of a highly nonlinear structural impact. These uncertainties include: the use of simple shell and beam elements; and the approximation of nonlinear material behavior using a bilinear relationship between stress and strain. Although off-nominal impact conditions can be important, they were considered to be secondary in importance for this application.
This section contains a summary of previous work that is
followed by descriptions of: 1) the random variables; 2) the probabilistic analysis approach; and 3) an evaluation of the accuracy of the approach.
§
The use of trademarks or names of manufacturers in the report is for accurate reporting and does not constitute an official endorsement, either expressed or implied, of such products or manufacturers by the National Aeronautics and Space Administration.
Extensive probabilistic investigations were performed utilizing at 2-D beam model to represent a fuselage section undergoing an impact from a drop test. Details of the work are contained in Ref. [8]. A major conclusion was that a response surface method approximation was suitable for this type of application. The response surface is a mathematical approximation of the simulation model. Once the response surface approximation was developed, a Monte Carlo analysis was used to compute the cumulative distribution function (CDF). The CDF computations were used to bound the uncertainty in responses. This approach was selected because: it is fairly efficient for a small number of random variables; the outputs are expected to vary smoothly and relatively linearly over the span of input variables; and, unlike probabilistic analyses such as First Order Reliability Methods (FORM), the results of several output quantities or locations can be computed at one time. A relatively small set of key structural and material parameters was selected based on their predicted influence on the overall structural response. A major area of concern was the frame and castellation modeling. The uncertainty in this complex modeling detail was simplified by choosing the frame web thickness and castellation thickness as variables. Material property uncertainty was approximated by varying the yield stress, hardening modulus, and failure strain of the two aluminum alloy materials. A description of the 6 random variables used in the probabilistic analysis is provided in Table A. The random variables (RV), with corresponding numbers indicated in the table, were used as factors that were then multiplied by the nominal values of the input parameters. This approach was utilized to minimize the number of input variables. All variables were assigned uniform distributions. The upper and lower bounds were established based on engineering judgment. A brief discussion of the justification of the random variable descriptions has been included. Because the yield stresses for both materials were fairly close numerically and the uncertainty is relatively small, one factor (RV #1) was used to represent the yield stresses. Similarly a second factor (RV #2) was used to represent the uncertainty in the hardening moduli for both materials. In contrast, the failure strain was very different for the two materials. The failure strain for the frame (RV #6) was in the range typical for such materials. Therefore the nominal value was considered appropriate for the mean. However, more uncertainty was expected than for the material yield and hardening modulus. For these reasons, the frame failure strain factor ranged from 0.8 to 1.2. On the other hand, the bounds in the failure strain for the castellation material (RV #3) was selected to be larger to reflect the uncertainty in the castellation modeling. Therefore the random variable factor was allowed to vary from 0.5 to 1.0. The ring frames and castellations were modeled with shells of different nominal thicknesses. This results from the variation of the thickness as a function of circumferential or axial location. The factor for the frame thickness (RV #4) varied from 0.9 to 1.1. A wider range – 0.5 to 1.0 – was chosen to represent the considerable uncertainty in the castellation modeling (RV #5). The response surfaces were computed using the Box-Behnken method, Ref. [11], to select the parameter values for input to the finite element simulations. Each variable was allowed to take on one of three values: mean, upper bound, or lower bound. For 6 random variables, 49 simulations were required.
Acceleration and displacement plots for all locations and simulations were examined to verify their suitability for this application. The response surface coefficients were computed in Matlab, Ref. [12], using a 2nd-order regression to fit the data, Ref. [13]. For each of the 12 selected response locations, a set of unique coefficients was computed. As a check, a Monte Carlo analysis based on 20 additional simulations was performed. The mean accelerations computed by the finite element code using the 20 input values were compared to the mean accelerations computed by the response surface approximations. The error, in percent, averaged over the 20 simulations for outboard and inboard locations is provided in Tables B and C, respectively. The error has a magnitude less than 2% for 10 of the 12 locations with less than 8% average error for the remaining 2 locations. These two locations are the outboard positions at the axial mid-point. This indicates that results computed at these locations using the response surface approximation are less reliable. Nonetheless, a response surface approximation is sufficient for use as the basis for the CDF computations. Table A. Description of input variables (units: kg, s, mm) Variables
Bounds
Lower (bL)
Upper (bU)
stress
0.9
1.10
420.
275.
2
Hardening modulus
0.9
1.1
1245.
1236.
3
Castellation failure strain
0.5
1.0
-
0.17
4
Frame thickness
0.9
1.1
1.5, 1.6, 2.9, 3.0
-
5
Castellation thickness
0.5
1.0
-
0.55, 0.74
6
Frame 0.8
1.2
0.05
-
# 1
Physical quantity
Nominal values
Frame
Castellation
Yield
failure strain
Table B. Accuracy of outboard response surface approximations. Location
Average error, %
1
0.99
4
-7.07
7
0.96
33
1.54
36
--5.29
39
1.36
Table C. Accuracy of inboard response surface approximations. Location
Average error, %
10
1.17
13
1.17
14
1.74
42
1.55
45
-1.70
46
1.33
Once the response surface coefficients were computed, a Monte Carlo analysis using 7,500 random samples with uniform distribution was performed to compute the mean accelerations at the 12 response locations. These computations took 61 hours to complete, whereas 7,500 simulations using the finite element code would have required over 390 days. V. Comparison of analytical and experimental results Sample CDF curves for locations 14 and 7, inboard and outboard, respectively, are shown in Figure 7. The usefulness of a chart such as Figure 7 is that it provides a range of analytical values within which the experimental data should fall. For example, the mean acceleration for the outboard location should fall within the range from 6.4 to 9.9 g for CDF values of 0.05 and 0.95, respectrively. If the experimental data falls within this band, then the analytical results would be considered as accurate as can be expected based on the modeling uncertainty. For all 12 response locations, the bounds on the mean acceleration, using CDF values of 0.05 and 0.95, are shown in Figure 8. The mean acceleration for the test data is also included. For 10 of the 12 locations, the mean accelerations fall within the analytical bounds. The two locations that fall outside the bounds are on the port side. Some discrepancies between the test data and the analytical results are evident. For example, the port responses as defined in Figure 8 show a definite trend with axial location while the starboard responses show little variation with respect to axial location. For both the port and starboard sides, the inboard locations have lower accelerations than the respective outboard locations. The analytical results show significantly smaller variations in the transverse and axial directions. The uncertainty bounds are large (~ 50% of the mean value) and therefore areas for decreasing uncertainty need to be identified. To aid in the process of determining the modeling deficiencies, a sensitivity analysis was performed. To compute the sensitivities, the gradients of the mean acceleration at each location as a function of each input were computed. For the response surface approach, the gradient is computed by first analytically differentiating the response surface expression and then substituting the mean value for each variable into the algebraic expression for the derivative. To normalize the results, the gradients were multiplied by the mean of the input variable. For each variable, the normalized gradient averaged over all the locations was computed, see Figure 9. The average value was deemed appropriate for evaluating the global effect of each variable. The gradient information reflects the effect of small changes about the mean. However, it does not incorporate the known uncertainty for the input variable. For this reason, the gradients were multiplied by the standard deviation (�) for the input variable, see Figure 10. The standard deviation for uniform distributions is computed by �=(bu- bl) /(2�3).
Figure 7. Cumulative distribution function of the mean accelerations for the outboard locations. Starboard
Outboard
Inboard
Port
Outboard
Inboard
Figure 8. Comparison of probabilistic analysis bounds and experimental results for the mean acceleration. The normalized gradient and sensitivity information, Figures 9 and 10, respectively, can be used to identify the variables that contribute most to the uncertainty. This information can be used to allocate resources for future work to improve (reduce) the uncertainty in the simulation results. In the present study, these results show that the castellation modeling uncertainty is dominating the uncertainty in the mean acceleration. In addition, the yield stresses and hardening moduli exhibit less influence on the mean accelerations. The ring frame thickness and failure strain have modest influence on the mean acceleration.
Figure 9. Average normalized gradient of mean acceleration as a function of input variables.
Figure 10. Average sensitivity of mean acceleration as a function of input variables. VI. Concluding Remarks An application of probabilistic analysis to compute the effect of modeling uncertainty on the mean acceleration has been presented. The sample structure was an aluminum commuter aircraft section undergoing a severe but survivable vertical impact. The pre-test finite element model development relied on several approximations. These approximations reflected unknowns in the castellation and frame physics and the materials modeling. A response surface approach was selected to approximate the mean accelerations computed from the finite element simulations. A Monte Carlo analysis using 7,500 samples was performed
using the response surface approximation. The results studied in this application were the mean vertical accelerations at 12 locations on the floor supports. Results showed that:
1) The mean error in the response surface approximation was less than 2% at 10 of the 12 response locations and less than 8% for the two remaining locations. Therefore, using a response surface approximation followed by a Monte Carlo probability computation provided the accuracy required, while at the same time limiting the number of costly and time-consuming finite element simulations.
2) A comparison of probabilistic analysis with the experimental data shows good bounding of the test data. However, the range of the bounds is nearly 50% of the mean value. In addition, some trends seen in the test data are not reflected in the analytical results.
3) The probabilistic bounds provide for a reasonable evaluation of pre-test simulation accuracy.
4) The gradient and sensitivity information is useful to identify areas for future modeling improvements. The sensitivity information incorporates not only the gradient information, but also the amount of uncertainty associated with the input parameter.
The results indicate that this method shows promise for future applications. Although modeling uncertainty was featured in this paper, the effect of experimental uncertainty can be determined using a similar methodology. VII. References 1. Jones, L. E.: Overview of NASA the Systems Approach to Crashworthiness Program. Proceedings of American Helicopter Society 58th Annual Forum, Montreal Canada, June 11-13, 2002. 2. Lyle, K. H.; Bark, L. W.: Data Reduction and Its Impact on Test-Analysis Correlation. Proceedings of the FAA Fire and Cabin Safety Conference, Atlantic City, NJ, October 22-25, 2001. 3. Lyle, K. H.; Bark, L. W.; and Jackson, K. E.: Evaluation of Test/Analysis Correlation Methods for Crash Applications. Journal of the American Helicopter Society. Vol. 47 No. 4, October 2002, pp. 233-242. 4. Thacker, B. H., et al: Errors and Uncertainties in Probabilistic Engineering Analysis, Proceedings of the 42nd AIAA/ASME/ASCE/AHS/ASC Structures, Structural Dynamics, and Materials Conference and Exhibit, Non-Deterministic Approaches Forum, AIAA Paper 2001-1239, Seattle, WA, April 16-19, 2001. 5. Hoser, S. et al: Observations on CFD Simulation Uncertainties. Proceedings of the 9th AIAA/ISSMO Symposium on Multidisciplinary Analysis and Optimization, AIAA Paper 2002-5531, Atlanta GA, September 4-6, 2002.
6. Long, M. W.; and Narciso, J. D.: Probabilistic Design Methodology for Composite Aircraft Structures. DOT/FAA Report No. AR-99/2, June 1999. 7. Yang, R. J, et al: Reliability-Based Multidisciplinary Design Optimization of a Full Vehicle System. Proceedings of the 43rd AIAA/ASME/ASCE/AHS/ASC Structures, Structural Dynamics, and Materials Conference and Exhibit, AIAA Paper 2002-1758, Denver CO, April 22-25, 2002. 8. Lyle, K. H.; Padula, S. L.; and Stockwell, A. E.: Application of Probabilistic Analysis to Aircraft Impact Dynamics. Proceedings of the 44th AIAA/ASME/ASCE/AHS/ASC Structures, Structural Dynamics, and Materials Conference and Exhibit, Non-Deterministic Approaches Forum, AIAA Paper 2003-1482, Norfolk VA, April 7-10, 2003. 9. Vaughan, V. L., Jr.; and Alfaro-Bou, E.: Impact Dynamics Research Facility for Full-Scale Aircraft Crash Testing. NASA TN D-8179, April 1976. 10. Anon., MSC.Dytran User�s Manual, Version 2002, Santa Ana CA, November 2001. 11. Box, G. E. P.; and Behnken, D. W.: Some New Three Level Designs for the Study of Quantitative Variables. Technometrics, Vol. 2, No. 4, 1960, pp. 455-475. 12. Anon: Using Matlab, Version 6, The MathWorks, Inc. Natick MA, 2000. 13. Lapin, L. L.: Probability and Statistics for Modern Engineering. PWS Publishers, Boston MA, 1983.