Journal of Cell and Molecular Research (2015) 7 (1), 38-46
Research Article
Application of Random Amplified Polymorphic DNA (RAPD) to Detect the Genotoxic Effect of Cadmium on Tow Iranian Ecotypes of cumin (Cuminum cyminum) Soraya Salarizadeh, Hamid Reza Kavousi* Department of Plant Biotechnology, College of Agriculture, Shahid Bahonar University of Kerman, Kerman, Iran Received 9 December 2014
Accepted 3 January 2015
Abstract Cadmium, a metal widely used in industrial processes, has been recognized to be a highly toxic and dangerous environmental pollutant. Random amplified polymorphic DNA (RAPD) test is a feasible method to evaluate the toxicity of environmental pollutants on vegetal organisms. Herein, two Iranian ecotypes of Cuminum cyminum (cumin) plantlets following exposure to cadmium (Cd) concentrations of 300–1050 µM for 7 days were screened for DNA genetic alterations by DNA fingerprinting. 10 RAPD primers of 50–70% GC content were found to produce unique polymorphic band profiles on treating cumin seedlings. After Cd treatment, significant changes were observed in RAPD profiles of both ecotypes. These changes included variation in band intensity, disappearance of bands, and appearance of new PCR products in comparison to the control group, and they were dose dependent. These results indicated that genomic template stability (GTS, a qualitative measure reflecting changes in RAPD profiles) was significantly affected at the above Cd concentrations. The GTS index in both ecotypes gradually decreased with an increase in Cd concentrations. These findings suggest that DNA polymorphism detected by RAPD analysis could be a powerful eco-toxicological tool to evaluate the genotoxic effects of cadmium on plants. Keywords: : Cadmium (Cd), Genomic Template Stability, RAPD, Genotoxicity, Cuminum cyminum
Introduction
Heavy metal toxicity is one of the major current environmental health problems and potentially dangerous due to bioaccumulation through the food chain and in plant products for human consumption. Therefore, heavy metal contaminations of soils and plants have become an increasing problem (Michael et al., 2012). Cadmium (Cd) is a highly toxic heavy metal that enters the environment mainly from industrial processes and phosphate fertilizers. It can reach high levels in agricultural soil and easily accumulates in plants. Cd ions are taken up readily by the plant roots and translocated to the aboveground vegetative parts (Shamsi et al., 2008). The presence of Cd at higher concentrations in the soil damages root tips, reduces nutrient and water uptake, impairs photosynthesis and inhibits growth of the plants (Sharma and Dubey, 2006). Furthermore, Cd directly or indirectly induces reactive oxygen species (ROS), which affect the redox status of the cell and cause oxidative damage
Corresponding authors E-mail:
*
[email protected],
[email protected]
to proteins, lipids, and other biomolecules (Schutzendubel et al., 2001; Amirthalingam et al., 2013). Cd damages the nucleoli in cells of root tip, alters the synthesis of RNA, inhibits ribonuclease activity and inhibits the DNA repair mechanism (Amirthalingam et al., 2013). The genetic material (DNA, except in the case of some viruses in which it is RNA) carries the information necessary for determining the properties of an organism and is responsible for transmitting information from parent to offspring. During the cell cycle, DNA undergoes conformational and structural changes, but it is of paramount importance that its structural integrity be maintained throughout the life of the cell. Organisms are continuously exposed to environmental stresses that may result in DNA damage. Genotoxicity of metals such as Cd is directly related to its effect on the structure and function of DNA and several studies have used the comet assay, micronucleus assay or chromosome aberration assay to measure the genotoxic effect of metals on plants (Angelis et al., 2000; Liu et al., 2009a,b; Cambier et al., 2010). Advantages of measuring effects of genotoxic chemicals directly Licensed as CC-BY
Journal of Cell and Molecular Research (2015) 7 (1), 38-46
on DNA are mainly related to the sensitivity and short response time. Recently, the development of molecular marker technology has provided new tools for detection of genetic alteration in response to heavy metal tolerance by looking directly at the level of DNA sequence and structure. The random amplified polymorphic DNA (RAPD) assay, developed by Williams et al.(1990) and Welsh and McClelland (1990), is a PCR-based technique that amplifies random DNA fragments of genomic DNA with single short primers of the arbitrary nucleotide sequence under low annealing conditions. This technique is used extensively for species classification, genetic mapping and phylogeny etc. In addition, their use in surveying genomic DNA for evidence of various types of DNA damage and mutation shows that RAPD may potentially form the basis of novel biomarker assays for the detection of DNA damage and mutational events (e.g. rearrangements, point mutation, small insertions or deletions of DNA and ploidy changes) in cells of bacteria, plants, invertebrate and vertebrate animals (Savva, 1996; Savva, 2000; Atienzar et al., 2000). Fragments generated by RAPD are visualized after agarose gel electrophoresis and ethidium bromide staining. The resulting DNA profiles may differ due to band shifts, missing bands or the appearance of new bands. Detection of genotoxic effect using RAPD involves the comparison of profiles generated from control (unexposed) and treated (exposed) DNA. The aims of this study was the evaluation of the random amplified polymorphic DNA (RAPD) assay for the detection of DNA damage in two Iranian ecotypes of cumin (C. cyminum) seedlings measured in laboratory condition. Materials and Methods Plant materials and growth condition The experimental plant used in this investigation was two Iranian ecotypes of cumin (C. cyminum) seeds, namely Isfahan and Khorasan that kindly provided by Dr. Mahammadinejad, Department of Agronomy and Plant Breeding, Shahid Bahonar University of Kerman, IRAN. Seeds were surface sterilized by immersion in 70% ethanol for 3 min., followed by stirring in sodium hypochlorite (5% chlorine) for 20 min. The surface sterilized seeds were rinsed 3 times with sterile distilled water for 5 min. The seeds then placed in petri dishes (90-mm diameter) on filter paper (Whatman # 42) under dark condition, so simulate the soil condition at 20°C. Uniform germinated seeds were transferred
to petri pots (diameter 9.5 cm and height 14 cm) containing sands at sizes 1-3 mm (40%) and perlite (60%). Petri pots were incubated in a growth chamber at a temperature of 20 ± 2°C and a 16-hday-8-h-night photoperiod. The plants were fertilized by Hoagland solution once a day. After 21 days, seedlings were treated with 0 (as control), 300, 450, 600, 750 and 1050 µM of Cd under the above mentioned laboratory condition for 7 days. DNA extraction and RAPD procedures For both the control and Cd treatments, shoots were collected and flash frozen in liquid nitrogen prior to storage at -70°C. Total DNA was extracted from approximately 100 mg of shoots using a CTAB protocol (Doyle and Doyle, 1987). The quantity and quality of DNA were estimated using scan Drop UV-Visible spectrophotometer (Analytik Jena, Germany) at 260 nm and 280 nm. The integrity of DNA was examined by gel electrophoresis in 1% agarose in 0.5 X TBE buffer. Electrophoresis of DNA was performed at 100 V for 35 min and DNA was visualized with a UV Transilluminator after staining with ethidium bromide PCR conditions were optimized according to Williams et al. (1990). PCR was performed in a reaction mixture of 25μl containing approximately 80 ng of genomic DNA, 20 pmol of decanucleotide primer (Table 1), 200 μM dNTPs (50 µM of each), 2 mM MgCl2 , 1 U of Taq DNA polymerase (Thermo Scientific) and 1X reaction buffer (10 mM Tris-HCl pH 8.3, 50 mM KCl). For amplification, the reaction mixtures were denatured at 94°C for 3 min, followed by 35 cycles at 94°C for 30 sec (denaturation), 37°C for 60 sec (annealing) and 72°C for 60 sec (extension), with an additional extension period of 8 min at 72°C. All amplifications were conducted twice in order to evaluate the reproducibility of the polymorphic bands. A negative control, without genomic DNA, was run in parallel with every set of samples to confirm that no contaminating DNA was present in the reactions. Amplification was carried out in a thermocycler (Eppendorf, Germany) with heated lid. Amplification mixtures were stored at 4°C before use. PCR reaction products were mixed with one-fifth volume of gel loading buffer (SinaClone, Iran), and then separated by electrophoresis on a 1.2% agarose gel, using a Tris-borate-EDTA (TBE) system (0.5 x TBE = 45 mM Tris-base, 45 mM boric acid, and 1 mM EDTA). Agarose gel dimensions were 10 × 8 × 0.5 cm3. Electrophoresis was carried out at room temperature at 75 V for 1.5 h and after which the gels were stained with EB
Journal of Cell and Molecular Research (2015) 7 (1), 38-46
solution (0.015%) in distilled water. The image of the gel was visualized with a UV Transilluminator and the size of each amplification product was estimated using the Total Lab TL120 software. For comparison, DNA molecular size marker (100 bp DNA Ladder, Thermo Scientific) was used for each agarose gel. In all PCR-gels, the marker bands visualized were, from top to bottom, 3000, 2000, 1500, 1200, 1000, 900, 800, 700, 600, 500, 400, 300, 200 and 100 bp Table1. Sequences of primers used in this study Sequences of primer Primer Sequences of primer Primer (5 → 3)
(5 → 3)
OPE-07
AGATGCAGCC
OPI-14
TGACGGCGGT
OPF-05
CCGAATTCC C
OPJ-19
GGACACCACT
OPJ-01
CCCGGCATAA
OPQ-06
GAGCGCCTTG
OPJ-20
ACGAGGGACT
OPB-17
AGGGAACGAG
OPP-06
GTGGGCTGAC
OPS-17
TGGGGACCAC
OPU-20
ACAGCCCCCA
OPK-14
CCCGCTACAC
OPC-08
TGGACCGGTG
OPJ-21
ACGAGGGACT
Estimation of genomic template stability Genomic template stability (GTS, %) was calculated as follows: GTS (%) = (1 − )× 100 Where a is the average number of polymorphic bands detected in each treated sample, and n is the number of total bands in the control. Polymorphism observed in RAPD profiles included the disappearance of a normal band and appearance of a new band in comparison to control RAPD profiles (Atienzar et al., 1999; Luceri et al., 2000), and the average was then calculated for each experimental group exposed to different Cd treatment. Estimation of band sharing index In our investigations, we have used the band sharing index (BSI) as a measure of similarity between two samples and this was calculated using the following equation: BSI = 2s/ (a + b) Where s is the number of bands shared between two samples, a is the number of bands in the first sample and b the number of bands in the second sample. A BSI value of 1 indicates that two samples are identical, while a BSI value of zero indicates that two samples are totally different (Savva, 2000).
Results DNA extraction The suitability of the CTAB extraction method for DNA extraction was evaluated on the basis of the DNA purity and integrity. Concentration and purity of DNA extracted are usually measured at OD260 and by 260 nm/280 nm absorbance ratio. The purity grade of DNA extracted from the control and the exposed seedlings for 7 days of treatment was in the range of 1.6–1.7, and the yield obtained was approximately 85 µg (100 mg)-1 (FW) tissue in the control plantlets. The integrity of the genomic DNA extracted by the CTAB method was shown in Figure 1. These results indicated that the CTAB method was suitable for DNA extraction from cumin and yielded high quality DNA samples, which is crucial for good RAPD analysis (Williams et al., 1990).
Figure 1. Genomic DNA of about 150-400 ng extracted by CTAB in C. cyminum
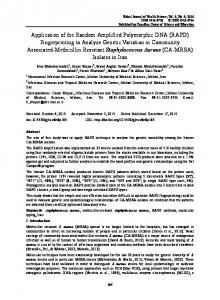
Effect of Cd stress on RAPD profile In total, fourteen 10-mer oligonucleotide primers were utilized for screening the cumin genome for alteration in response to Cd stress, whilst only 10 priming oligonucleotides yielded specific and stable results (Figure 2 and Table 2). In all cases, RAPD patterns generated by the Cd-exposed plantlets were clearly different from those obtained using control DNA and exhibited a distinct change with increasing Cd concentration in both ecotypes. The differences in RAPD patterns refer to band intensity, loss of normal bands and appearance of new bands as compared with the control.
Journal of Cell and Molecular Research (2015) 7 (1), 38-46
Table 2. Changes of total bands in control, and of polymorphic bands and varied bands in Cd-treated seedlings of Isfahan ecotype (up) and Khorasan ecotype (below). No. of primers 0
300 b c
a OPE-07 OPF-05 OPJ-01 OPJ-20 OPP-06 OPU-20 OPC-08 OPI-14 OPJ-19 OPQ-06 Total bands a+b a+b+c+d
8 8 6 8 5 11 3 7 8 8 72
0 1 2 0 1 1 1 2 0 2 0
0 1 0 1 0 2 0 7 0 0 1 3 0 1 0 2 0 0 0 0 1 17 11 42
Cd concentration (µM) 450 600 b c d a b c d
d
a
2 0 4 0 2 0 0 0 2 4 14
0 0 1 2 1 0 1 0 2 0 2 5 0 0 7 0 0 0 1 2 1 1 4 0 1 0 1 1 2 0 2 0 0 0 0 2 2 0 1 4 9 1 20 16 10 46
No. of primers 0 a
300 b c
d
a
450 b c
0 1 2 0 2 1 1 2 0 2 11
0 1 0 0 0 2 0 0 0 0 3
1 1 2 0 2 5 7 0 0 4 2 2 1 0 2 2 0 2 1 5 18 21 14 53
Cd concentration (µM) 600 d a b c d
750 b c
a 0 2 2 0 0 1 1 5 0 2 13
0 0 0 0 0 2 0 1 0 0 3
d
1 1 2 7 0 1 1 1 0 0 14
2 1 6 0 4 2 0 3 2 5 25
750 b c
d
16 55
a
1050 b c
a
d
0 6 2 0 2 0 1 1 2 2 0 5 0 0 7 0 0 0 0 3 1 2 5 0 1 0 0 1 2 1 2 0 1 0 0 3 2 0 0 5 11 11 17 18 22 57
a
1050 b c
d
OPE-07 8 0 0 0 1 0 0 1 1 0 0 3 1 0 0 1 4 0 0 2 3 OPF-05 9 0 0 0 1 0 0 1 0 1 0 1 3 0 2 5 0 0 2 3 1 OPJ-01 6 2 0 0 4 2 0 0 4 2 0 0 4 2 0 0 6 2 1 2 2 OPJ-20 8 0 0 3 0 0 0 3 0 0 0 3 0 0 0 5 0 0 0 5 0 OPP-06 5 1 0 0 0 1 0 0 1 1 0 0 4 3 0 0 4 1 0 0 4 OPU-20 12 0 0 1 0 0 0 1 0 0 0 0 2 0 0 0 1 0 1 1 0 OPC-08 3 2 0 1 1 0 0 1 1 0 0 1 1 0 0 1 1 0 0 1 1 OPI-14 7 0 0 0 0 0 0 0 0 0 0 0 0 0 0 0 0 0 0 0 0 OPJ-19 8 0 0 5 0 0 0 5 0 0 0 4 0 0 0 3 0 0 0 0 2 OPQ-06 4 5 0 0 7 5 0 0 7 5 0 0 7 5 0 0 6 5 0 0 6 Total bands 70 10 0 10 14 8 0 14 14 9 0 14 22 10 2 17 22 8 4 16 19 a+b 10 8 9 12 12 a+b+c+d 34 36 45 51 47 * a: indicates appearance of new bands, b: disappearance of normal bands, c: decrease in band intensities, and d:increase in band intensities. a+b denotes polymorphic bands, and a+b+c+d, varied band
Almost all of the primers detected more than such alteration in a given sample. For instance, extra bands of amplified DNA appeared in the case of 300, 450, 600, 750 and 1050 µM cadmium-treated cumin with 5 and 8 primers in Isfahan and Khorasan ecotypes respectively. Five primer namely OPE-05 (one and seven new bands in Isfahan and Khorasan ecotype respectively), primer OPJ-01 (ten new bands in both ecotypes), primer OPP-06 (seven and three new bands in Isfahan and Khorasan ecotype respectively), primer OPC-08 (two and five new bands in Isfahan and Khorasan ecotype respectively) and primer OPQ-06 (twenty five and ten new bands in Isfahan and Khorasan ecotype respectively) produced new band in both ecotypes (Table 2). Primers OPE-07 and OPJ-20 were not amplified any new band under
different concentrations of cadmium in two ecotypes. The remanding primers including OPU20, OPI-14 and OPJ-19 produced five, thirteen and one new bands respectively only in Khorasan ecotype. Extra bands of molecular size from approximately 500–3000 bp were indicated to appear. The number of disappearing RAPD bands increased with the increasing Cd concentration for three primers in Isfahan ecotype and five primers in Khorasan ecotype, and bands of molecular size about 525–2516 bp was shown to disappear. The number of disappeared bands in Khorasan ecotype was much higher than another ecotype. Overall, the number of disappeared RAPD bands correlated positively with the concentration of the cadmium (Table 2).
Journal of Cell and Molecular Research (2015) 7 (1), 38-46
Furthermore the decrease and increase in band intensity were particularly obvious for both cumin ecotypes exposed to all cadmium concentration used in this experiment for almost all primers (Table 2). Ten primers gave a total of 142 RAPD fragments (70 and 72 bands in Isfahan and Khorasan ecotype respectively) ranging from 200-3000 bp in molecular size in the control (Figure 2). Different polymorphic bands were detected at each concentration of Cd for different primers. Value of polymorphisms in Isfahan ecotypes was P (%) = 14.3%, 11.4%, 12.9%, 17.1% and 17.1% for 300, 450, 600, 750 and 1050 µM Cd, respectively. In Khorasan ecotypes the value of polymorphisms of mentioning concentration was 15.3%, 13.9%, 19.4%, 22.2% and 30.5%. The value of observed polymorphism in RAPD patterns in response to Cd stress in Khorasan ecotype was greater than Isfahan ecotype. In all cases, polymorphisms were due to the loss and/or gain of amplified bands in the treated samples compared with the control. Table 2 also indicates that changed bands observed in RAPD profiles (e.g. disappearance, appearance of bands, decrease and increase in band intensity in comparison to control) in the Cd-contaminated cumin seedlings increased dramatically after exposure to Cd. In addition, further experiments confirmed that the variation in band intensities in Figure 2 was stable and not a consequence of either a change in concentration of template DNA within a certain range or a change in PCR reagent concentration (results not shown). Effect of cadmium pollution on Band Sharing Index (BSI) The value of Band Sharing Index (BSI) for each treatment group compared with the control was calculated in both ecotypes (Table 3). Table 3. Effect of Cd on Band Sharing Index (BSA) of two ecotypes compared with control seedlings Cd concentration (µM) 300 450 600 750 1050
Figure 2. RAPD profiles of genomic DNA from cumin seedlings exposed to varying Cd concentrations (300-1050 µM). NC: negative control, C: control, and M: 100 bp DNA ladder.
Isfahan ecotype 0.912 0.937 0.927 0.912 0.912
Khorasan ecotype 0.889 0.898 0.871 0.869 0.801
Results showed that in both ecotypes with the increase of Cd concentration following 7 days of treatment, the BSI value was decreased (With the exception of 450 µM concentration). These results reflect the existence of diversity among of RAPD patterns of samples treated with different
Journal of Cell and Molecular Research (2015) 7 (1), 38-46
concentrations of Cd compared with control. However, the variation in RAPD pattern in response to different concentrations of cadmium was greater in Khorasan ecotype compared with another ecotype. In other words, there was a higher degree of diversity in Khorasan ecotype in response to Cd pollution. However, the band sharing index, despite being very simple to estimate, is not as valuable as GTS index, because it does not take into consideration the absence of bands in profiles. Effect of cadmium pollution on genomic template stability (GTS) content Changes in the RAPD patterns were expressed as decreases in GTS, a qualitative measure reflecting obvious changes to the number of RAPD profile generated by the Cd-exposed cumin seedlings, in relation to profiles obtained from control seedlings. A comparison between GTS content of two ecotypes in each treatment is shown in Figure 3. Results indicate that the general tendency of above mentioned index was a progressive reduction with ascending Cd concentration in the culture media. The decreasing trend of the GTS index in Khorasan ecotype was much greater than other ecotype. However the GTS of cumin seedlings increased at 450 µM Cd in both ecotypes only. This effect is ascribed to the multiple changes in RAPD profiles (loss or addition of bands) which tend to counterbalance each other.
Figure 3. Comparison of genomic DNA template stability in two ecotypes of cumin seedlings exposed to different Cd concentration.
Discussion Plant growth and development under stress conditions are generally negatively affected. One of these stress conditions that affect plants is heavy metals. Recently, heavy metals have become a hot topic of research for many researchers around the world, mostly due to their detrimental effects on many organisms including plants. Much research has been conducted on the effect of Cd on crops
and other agricultural plants. However, little information is available on the toxicity of Cd on medicinal plants. In ecotoxicology, the effective evaluation and proper environmental monitoring of potentially genotoxic contaminant will be improved with the development of sensitive and selective methods to detect toxicant-induced alterations in the genomes of a wide range of biota. In the present study, the RAPD-PCR technique was used to determine the potential genotoxic effect of cadmium in C. cyminum The results of this study showed that Cd levels affected DNA profile in both ecotypes of C. cyminum by different magnitudes and significant changes in RAPD profiles of both ecotypes was observed here. Once optimized, the use of RAPD for the detection of DNA damage presents a number of advantages. The assay, which is suitable for any extracted DNA of sufficient quality, allows rapid analysis of a large number of samples. As arbitrary primers are used, specific details of DNA damage or the genome sequence in organisms are not needed. Furthermore, no radioactivity or enzymatic degradation of PCR products is required prior to analysis (Atienzar et al., 1999). The modifications to the genomic DNA were detected by RAPD profiles through the use of randomly primed PCR reactions. These effects include changes in oligonucleotide priming sites and variations in the activity of the Taq DNA polymerase. Such effects lead to visible changes in the electrophoretic profiles of RAPD reaction products. The changes in amplified band fluorescence intensity, obvious disappearance of amplified bands and appearance of new PCR products occurred in RAPD profiles generated from the Cd-exposed organisms in comparison to the control (Figure 2 and Table 2) To test the reproducibility of the RAPD-PCR, the experiments were repeated at least twice for each primer and faint bands were ignored; only reproducible bands obtained in repeated experiments were taken into account. It has been reported that cadmium can induce a range of DNA damage such a single- and doublestrand breaks, abasic sites, modified bases, DNAprotein cross-links, oxidized bases, 8hydroxyguanine and even bulky adducts representing intra strand dimerization of adjacent purine bases (dimmers) in organisms (Hsiao and Stapleton, 2004; Liu et al., 2007). Dimmers can alter the structure of the DNA (Liu et al., 2007). These DNA damage and structure variations can be better identified by our multiple biomarker approach presented here.
Journal of Cell and Molecular Research (2015) 7 (1), 38-46
Modifications of band intensity and lost bands are likely to be due to one or a combination of the following events: (1) changes in oligonucleotide priming sites due mainly to genomic rearrangements and less likely to point mutations and DNA damage in the primer binding sites (because the binding site is only 10 base long whereas genomic rearrangements occur in much longer fragments, e.g. several kb), and (2) interactions of DNA polymerase in cumin seedlings with damaged DNA. These events could act to block or reduce (bypass event) polymerization of DNA in the PCR reaction. The by-pass event is a complicated process that depends on the enzymatic properties of the DNA polymerase, the structure of the lesion and the sequence context of its location (Enan, 2006). In this experiment, increase in band intensity occurred in the all Cd concentrations for primer OPJ-01, OPP-05, OPJ-19 and OPQ-06 in Khorasan ecotype and for primer OPE-07, OPJ-01, OPC-08 and OPQ-06 in Isfahan ecotype (Table 2). Decrease in band intensity occurred in all used Cd concentrations in this experiment for primer OPJ20 and OPC-08 in Isfahan ecotype and for primer OPE-07, OPJ-01, OPJ-20, OPU-20 and OPI-14 in Khorasan ecotype (Table 2). In this study the frequency of band loss was shown to enhance with ascending Cd doses (Table 2).The disappearance of PCR products in some cases affected the high molecular weight bands (i.e. greater than 1 kb) for primers OPE-07 and OPU-20 in Khorasan ecotype and for primer OPJ-01 in Isfahan ecotype because the odds of obtaining DNA damage increased with the length of the amplified fragment. However, some smaller amplicons in this experiment were even much more affected in both ecotypes, thus suggesting a nonrandom interaction between DNA and Cd contamination in soil. Highest number of disappeared bands that was observed in both ecotypes with cadmium at high concentration (750 and especially 1050 µM) suggests that cadmium maybe cause the same above mentioned changes to the DNA of the treated plants that consequently resulted in the disappearance of DNA bands. Appearance of new PCR products or appearance of bands could be attributed to the presence of oligonucleotide priming sites which become accessible to oligonucleotide primers after structural change or because some changes in DNA sequence have occurred due to mutations (resulting in new annealing events) or large deletions (bringing two pre-existing annealing sites closer) or homologous recombination (Atienzar et al., 1999; Enan, 2006). New amplified fragments of mainly
greater than 1 Kb in molecular size appeared for all Cd concentrations in both ecotypes. The presence of some extra band in this experiment may also be the results of genomic template instability related to the level of DNA damage, the efficiency of DNA repair and replication (Atienzar et al., 1999). Our results (Figure 2 and Table 2) indicating increased polymorphism with increasing concentration of Cd, agree well with the observations of other researchers who have also demonstrated a dose-dependent relationship between the DNA changes in treating seedlings and the cadmium concentrations with the RAPD analyses (Liu et al., 2005; Liu et al., 2007; Liu et al., 2009a; Liu et al., 2012). On the other hand, the genomic template stability in the cumin decreased with increasing of Cd concentrations, which indicated that the genomic template stability was significantly affected by Cd stress (Figure 3). Previous studies have also shown that changes in RAPD profiles induced by pollutants can be regarded as changes in genomic DNA template stability and this genotoxic effect can be directly compared with alterations in other parameters (Atienzar et al., 2000). Similar effect on DNA damage was reported due to UV radiation in a marine alga Palmaria palmate (Atienzar et al., 2000). Meanwhile, other studies have reported that RAPD or amplified fragment length polymorphism was more sensitive than classic tests such as the comet and micronucleus assay since RAPD analysis was capable of detecting temporary DNA changes at lower concentration of pollutants that may not finally manifest themselves as mutations (Liu et al., 2005; Atienzar and Jha, 2006). Recently, RAPD technique has been successfully utilized to detect various types of DNA damage and mutation in animals, bacteria and plants induced by low doses of pollutants (Atienzar et al., 1999; Theodorakis, 2001; Atienzar et al., 2002; Rong and Yin, 2004; Liu et al., 2005; Liu et al., 2007; Liu et al., 2009a). The main advantages of the RAPD method were already mentioned. However, RAPD is only a qualitative method. Effect of each category of DNA damage (e.g. strand breakage, modified bases, abasic sites, oxidized bases, and bulky adducts) on RAPD profiles can only be speculated unless amplicons are analyzed (e.g. sequencing) and more specific methods such as the comet assay and 32Ppostlabelling assay is needed to obtain quantitative data (Liu et al., 2009a). In conclusion the RAPD method has successfully been used as a sensitive means of detecting Cdinduced DNA damage and showed potential as a reliable assay for soil genotoxicity. From RAPD,
Journal of Cell and Molecular Research (2015) 7 (1), 38-46
ten 10 bp RAPD primers were found to produce a total of 142 RAPD fragments (70 and 72 bands in Isfahan and Khorasan ecotype respectively) ranging from 200-3000 bp in molecular size in the control. The change occurring in RAPD profiles of the seedlings following Cd treatment presents alterations in band intensity, gain or loss of bands compared with control. New amplified fragments of 500–3000 bp in molecular size appeared for all Cd concentrations. The number of missing bands enhanced with the increasing Cd concentration and the genomic template stability reflecting changes in RAPD profiles were significantly affected. This study suggests that the RAPD analysis can be a powerful tool for detection of genotoxic effects of metal contamination in soils. References 1. Amirthalingam T., Velusamy G. and Pandian R. (2013) Cadmium -induced changes in mitotic index and genotoxicity on Vigna unguiculata (Linn.) Walp. Journal of Environmental Chemistry and Ecotoxicology 5(3): 57-62. 2. Angelis K. J., Mcguffie M., Menke M. and Schubert I. (2000) Adaption to alkylation damage in DNA measured by the comet assay. Environmental and Molecular Mutagenesis 36: 146–150. 3. Atienzar F. A., Conradi M., Evenden A. J., Jha A. N. and Depledge M. H. (1999) Qualitative assessment of genotoxicity using random amplified polymorphic DNA: Comparison of genomic template stability with key fitness parameters in Daphnia magna exposed to benzo[a]pyrene. Environmental Toxicology Chemistry 18: 2275–2282. 4. Atienzar F. A., Cordi B. and Donkin M. E. (2000) Comparison of ultraviolet-induced genotoxicity detected by random amplified polymorphic DNA with chlorophyll fluorescence and growth in a marine macroalgae, Palnaria palnata. Aquatic Toxicology 50: 1–12. 5. Atienzar F. A., Venier P., Jha A. N. and Depledge M. H. (2002) Evaluation of the random amplified polymorphic DNA (RAPD) assay for the detection of DNA damage and mutations. Mutation Research 521: 151–163. 6. Atienzar F. A. and Jha A. N. (2006): The random amplified polymorphic DNA (RAPD) assay and related techniques applied to genotoxicity and carcinogenesis
7.
8.
9.
10.
11.
12.
13.
14.
15.
16.
studies: a critical review. Mutation Research 613: 76-102. Cambier S., Gonzalez P., Durrieu G. and Bourdineaud J. P. (2010) Cadmiuminduced genotoxicity in zebra fish at environmentally relevant doses. Ecotoxicology and Environment Safety 73: 312–319. Doyle J. J. and Doyle J. L. (1987) A rapid DNA isolation procedure for small quantities of fresh leaf tissue. Phytochemical Bulletin 19: 11-15. Enan M. R. (2006) Application of random amplified polymorphic DNA to detect genotoxic effect of heavy metals. Biotechnology and Applied Biochemistry 43: 147–154. Hsiao C. J. and Stapleton S. R. (2004) Characterization of Cd induced molecular events prior to cellular damage in primary rat hepatocytes in culture: activation of the stress activated signal protein JNK and transcription factor AP-1. Journalof Biochemical and Molecular Toxicology 18 (3): 133–142. Liu W., Li P., Qi X., Zhou Q., Zheng L., Sun T. H. and Yang Y. S. (2005) DNA changes in barely (Hordeum vulgare) seedlings induced by cadmium pollution using RAPD. Chemosphere 61: 158-167. Liu W., Yang Y. S., Zhou Q., Xie L., Li P. and Sun T. (2007) Impact assessment of cadmium contamination on rice (oryza sativa L.) seedlings at molecular and population levels using multiple biomarkers. Chemosphere 67: 1155-1163. Liu W., Yang Y. S., Li P. J., Zhou Q. X., Xie L. J. and Han Y. P. (2009a) Risk assessment of cadmium contaminated soil on plant DNA damage using RAPD and physiological indices. Journal of Hazardous Materials 161: 878-883. Liu W., Zhou Q. X., Li P. J., Gao H. R., Han Y. P. and Li X. J. (2009b) DNA mismatch repair related gene expression as potential biomarkers to assess cadmium exposure in Arabidopsis seedlings. Journal of Hazard Materials 167: 1007–1013. Liu W., Sun L., Zhong M., Zhou M., Zhou Q., Gong Z., Li P. and Tai P. (2012) Cadmium-induced DNA damage and mutations in Arabidopsis plantlet shoots identified by DNA fingerprinting. Chemosphere 89: 1048–1055. Luceri C., Filippo C., Caderni G., Gambacciani L., Salvadori M., Giannini A.
Journal of Cell and Molecular Research (2015) 7 (1), 38-46
17.
18.
19.
20.
21.
22.
23.
24.
25.
26.
and Dolara P. (2000) Detection of somatic DNA alterations in azoxymethane-induced F344 rat colon tumors by random amplified polymorphic DNA analysis. Carcinogenesis 21: 1753–1756. Michael W. H., Evangelou A., Hockmann K., Pokharel R., Jako A. and Schulin R. (2012) Accumulation of Sb, Pb, Cu, Zn and Cd by various plants species on two different relocated military shooting range soils. Journal of Environmental Management 108: 102-107. Rong Zh. Y. and Yin H. W. (2004) A method for genotoxicity detection using random amplified polymorphism DNA with Danio rerio. Ecotoxicology and Environmental Safety 58: 96–103. Savva D. (1996) DNA fingerprinting as a biomarker assay in ecotoxicology. Toxicology and Ecotoxicology News Reviews 3: 110–114. Savva D. (2000) The Use of Arbitrarily Primed PCR (AP-PCR) Fingerprinting to Detect Exposure to Genotoxic Chemicals. Ecotoxicology 9: 341-353. Schutzendubel A., Schwanz P., Teichmann T., Langenfeld-Heyser G. K., Godbold D. L. and Polle A. (2001) Cadmium-induced Changes in antioxidative systems, hydrogen peroxide content, and differentiation in scots pine roots. Plant Physiology 127: 887-898. Shamsi I. H., Wei K., Zhang G. P., Jilani G. and Hassan M. J (2008) Interactive effects of cadmium and aluminum on growth and antioxidative enzymes in soybean. Biologia Plantarum 52:165-169. Sharma P. and Dubey R. S. (2006) Cadmium uptake and its toxicity in higher plants. In: Khan N.A., Samiullah, S. (Eds.). Cadmium Toxicity and Tolerance in Plants. Narosa publishing House, New Delhi, pp. 63-86. Theodorakis C. W. (2001) Integration of genotoxic and population genetic endpoints in biomonitoring and risk assessment. Ecotoxicology 10: 245–256. Theodorakis C. W., Bickham J. W., Lamb T., Medica P. A. and Lyne T. B. (2001) Integration of genotoxicity and population genetic analyses in kangaroo rats (Dipodomys merriami) exposed to radionuclide contamination at the Nevada Test Site. Environmental Toxicology and Chemistry 20: 317-326. Welsh J. and McClelland M. (1990)
Genomic fingerprinting using arbitrarily primed PCR and a matrix of pairwise combinations of primers. Nucleic Acids Research 18: 7213–7218. 27. Williams J., Kubelik A. R. and Livak K. J. (1990) DNA polymorphisms amplified by arbitrary primers are useful as genetic markers. Nucleic Acids Research 18: 6531–6535.
Open Access Statement: This is an open access article distributed under the Creative Commons Attribution License (CC-BY), which permits unrestricted use, distribution, and reproduction in any medium, provided the original work is properly cited