The most known signal specific sensing technique is the cyclo- stationary detector [4]. This detector offer high performances but need a long time for computation ...
Application of Smoothed Estimators in Spectrum Sensing Technique Based on Model Selection Bassem Zayen and Aawatif Hayar
Hamza Debbabi and Hichem Besbes
Department of Mobile Communication Eurecom Institute Sophia Antipolis, France Email: {zayen, hayar}@eurecom.fr
Ecole Sup´erieure des Communications de Tunis 7 Novembre University Carthage Tunis, Tunisia Email: {debbabi, besbes}@supcom.rnu.tn
Abstract—In cognitive radio networks, secondary user (SU) does not have rights to transmit when the primary user (PU) band is occupied, that’s why a sensing technique must be done. Recently, a new blind spectrum sensing technique based on distribution analysis was developed for sensing the spectrum holes in the PU band. Specifically, assuming that the noise of the radio spectrum band can still be adequately modeled using Gaussian distribution, this detector decide if the distribution of the received signal fits the noise distribution or not. This technique is computationally simple and fast. In this paper1 , we investigate the effect of applying smoothed estimators for this spectrum sensing technique. We will show that the application of smoothed periodograms offers good performances and keeps a reasonable complexity. Simulations results and performances evaluation presented in this paper are based on experimental measurements captured by Eur´ecom RF Agile Platform. Index Terms—Cognitive radio, spectrum sensing, distribution analysis, smoothed estimators.
While the first don’t need any prior knowledge about the transmitted signal, the second need some infirmations about the features of the signal such as carrier frequency, symbol period, modulation type, etc. This classification leads to decide whether one of these choices best fit the CR. The elaboration of sensing techniques that use some prior information about the transmitted signal is interesting in terms of performances. The most known signal specific sensing technique is the cyclostationary detector [4]. This detector offer high performances but need a long time for computation since it have a high complexity. Others methods that exploit a recorded form of the covariance matrix are also derived in the literature [5]. In fact, by this way primary users are detected even in very low SNR. However this kind of detection is not interesting because only few transmitted signals are considered, that leads to consider a specific band to scan.
I. I NTRODUCTION
On the other hand, completely blind sensing techniques that not consider any prior knowledge about the transmitted signal are more convenient to cognitive radio. Few methods that belong to this category were proposed, but most of them suffer from the noise uncertainty and fading channels. One of the most popular is the energy detector [6]. Despite it’s easy implementation and few complexity, the energy detector does not perform in low SNR and cannot differentiate between noise and signals. Moreover, this kind of detector will be inconvenient when the level of noise is completely unknown. Another blind technique was proposed in [7]. This technique exploits the distribution of the PU received signal to sense vacant frequency sub-bands over the spectrum band [8]. Specifically, assuming that the noise of the radio spectrum band can still be adequately modeled using Gaussian distribution, this detector decide if the distribution of the received signal fits the noise distribution or not. In this paper, we adopt the same framework to detect vacant sub-bands given in [7].
Nowadays, spectrum is considered to be a scarce resource since major of frequency bands have been allocated to specific users. However, recent results show that most of the granted spectrum is under utilized at both time and space. This fact leads to consider a new paradigm for wireless communication known as cognitive radio (CR) [1]. The main goal of CR is to sense periodically the spectrum environment over a wide range of frequency bands and uses the unoccupied bands for wireless transmission [2]. This concept concern secondary user (SU) or unlicensed users which does not have rights to transmit on any frequency bands and primary user (PU) or licensed users which have rights to transmit on specific frequency sub-bands. In fact SU must dynamically detect the presence of PU and based on this detection a transmission would occur or not. Consequently, spectrum sensing is a fundamental component of cognitive radio. Nevertheless, several factors make this task difficult such as low SNR, fading and noise uncertainty [3]. A number of different spectrum sensing techniques are proposed for identifying the presence of signal transmission. These techniques are mainly categorized in two family: Blind sensing techniques and signal specific sensing techniques. 1 The work reported herein was partially supported by the European project SENDORA and the National project GRACE.
CR was introduced in order to increase spectrum utilization. SU should know the spectrum of the received signal in order to detect spectrum holes. However, when there is a finite samples of the received signal, the spectrum is hence estimated. For this purpose, two kinds of spectral estimation are used in the literature: Parametric estimation and non
c 9781-4244-3941-6/09/$25.00 �2009 IEEE
parametric estimation. The parametric methods for spectrum estimation offers better results. However, their utilization in cognitive radio is not tolerable. In fact, they are based on solving matrix equation which requires matrix inversion that lead to high complexity. On the other hand, non parametric spectral estimation are few time consuming and can hence be applied to cognitive radio context. In this paper, we give some basic concepts of non parametric spectral estimation in order to use it on sensing technique for CR. In particular, we apply some smoothed spectral estimators to the PU detection problem given in [7]. However, we investigate the effect of applying smoothed periodograms for this spectrum sensing technique. We will show that cleaning frequency samples leads to have better results with PU detection. This paper is organized as follows. After the presentation of spectrum sensing techniques based on distribution analysis in Section II, the non parametric spectral estimators are discussed in Section III. In Section IV, we apply smoothed spectral estimator in the spectrum sensing technique based on distribution analysis. Finally, Section V concludes the paper. II. S PECTRUM S ENSING T ECHNIQUE BASED ON M ODEL S ELECTION In this section, we give the main ideas of the blind spectrum sensing technique based on model selection. The channel model that will be used throughout this paper is given by (1): xn = An sn + wn
(1)
where xn is the received signal at a SU. The transmitted signal sn from the PU is convolved with a multi-path channel An and a Gaussian noise wn is added. The goal of spectrum sensing is to decide between the following two hypothesis: � wn H0 (2) xn = An sn + wn H1 where H0 , signal does not exist; and H1 , signal exists. Let PF be the probability of false alarm given by: PF = P (H1 | H0 ) = P (xn is present | H0 )
(3)
that is the probability of the spectrum detector having detected a signal under hypothesis H0 , and PD the probability of detection expressed as: PD
= =
1 − PM = 1 − P (H0 | H1 ) 1 − P (xn is absent | H1 )
(4)
the probability of the detector having detected a signal under hypothesis H1 where PM indicates the probability of missed detection. The mean idea of the blind spectrum sensing technique based on distribution analysis is to decide if the distribution of the observed signal xn fits the candidate model. In fact, it is assumed that the samples of the received signal xn are distributed according to an original probability density function f , called the operating model. The operating model is usually unknown, since only a finite number of observations is available. Therefore, approximating probability model (i.e.
candidate model) must be specified using the observed data, in order to estimate the operating model. The candidate model is denoted as gθ , where the subscript θ indicates the U dimensional parameter vector, which in turn specifies the probability density function. Akaike’s proposal was to select the model which gives the minimum Akaike Infirmation Criterion (AIC) [9] [10], defined by: AIC = −2
N �
log gθˆ(xn ) + 2U
(5)
n=1
The parameter vector θ for each family should be estimated ˆ which minimizes using the minimum discrepancy estimator θ, the empirical discrepancy. The sensing technique selects the distribution that best fits the data. In fact, we consider that the norm of the Gaussian noise can be modeled using Rayleigh distribution and the presence of signal can be modeled using Rice distribution. From the received signal, we estimate parameters θˆ for Rayleigh and Rice distribution. Then, we compute the AIC for both distributions according to (5). In order to show the results of comparison between distributions in a clearly manner, we introduce the Akaike weights Wrice and Wrayleigh derived from AIC values and given by: � � exp 12 Φrice � � � � (6) Wrice = exp 12 Φrice + exp 12 Φrayleigh � � exp 12 Φrayleigh � � � � Wrayleigh = (7) exp 12 Φrayleigh + exp 12 Φrice where Φrice = AICrice − min (AICrice , AICrayleigh )
(8)
and Φrayleigh = AICrayleigh − min (AICrice , AICrayleigh ) (9) As consequence, a signal is present if Wrice is lower than Wrayleigh and vice versa. III. N ON PARAMETRIC S PECTRAL E STIMATORS In this section, we give some basic concepts of non parametric spectral estimation in order to use it on sensing techniques for CR. We will discuss a time modified estimator; Welch estimator [11], and a frequency modified estimator; Lee estimator [12], in order to develop our estimator as a combination between them. For that, we consider the discrete-time k=∞ signal {sn }n=0,1,2,··· with covariance sequence {rk }k=−∞ and power spectral density (PSD) Φ. The main goal is to estimate Φ from an observed sample {xn }n=0,1,··· ,N −1 of the signal. To achieve this, there is two main definitions of the PSD: Φ=
k=∞ �
rk e−iωk
(10)
k=−∞
� Φ = lim E N →∞
1 N
n=N �−1 n=0
� −iωn
xn e
(11)
An extensively studied and commonly used estimator of Φ is the periodogram given by: ˆP = 1 Φ N
n=N �−1
xn e−iωn
(12)
n=0
where the subscript P denotes the Periodogram estimate. While the estimator is asymptotically unbiased, the problem ˆ P , as commented in papers such of periodogram estimator Φ as [13], is its high variance which does not converge to zero as N increases but to Φ2P . To overcome this problem, many different modified periodograms have been proposed. These techniques exploit various windowing methods (in both time, lag and frequency domain). All these process, that are used to decrease the variance of the estimator, are assimilated to smoothing periodograms. The Welch periodogram use weighted segmented periodograms in order to average and obtain the spectrum estimate. In fact a subsequence from the signal is used to calculate its power spectral density using an M -point FFT and M point weighted window {winn }n=1···M . That leads to: �2 � M � �� 1 � � φˆj = xn winn e−iwn � (13) � � M� n=1
for j = 1, ..., L the number of windows. Then the estimated spectrum of the signal is calculated using the average: 1 φˆW = L
L �
φˆj
(14)
j=k+J �
IV. A PPLICATION OF S MOOTHED E STIMATOR IN THE S PECTRUM S ENSING T ECHNIQUE In this section, we apply non parametric spectral estimation to the blind sensing technique presented in Section II. The validation of the proposed approach is based on experimental measurements captured by Eur´ecom RF Agile Platform. This interface is an experimental real time hardware and software platform for air-interface experimentation. It consists of dualRF CardBus/PCMCIA data acquisition cards called CardBus MIMO I. The RF section is time-division duplex and operates at 1.900-1.920GHz with 5MHz channels and 21dBm transmit power per antenna for an OFDM waveform. Eur´ecom has a frequency allocation for experimentation around its premises in Sophia Antipolis. The cards house a medium-scale FPGA (Xilinx X2CV3000) allowing for an embedded HW/SW system implementing the physical layer. 5
FFT estimation
x 10 1 0 −1
−3
−2
−1
0 1 Frequancy [Hz] Non parametrique estimation
6
x 10
−60 −3
−2
−1
0 1 Frequancy [Hz] Akaike weights Rayleigh
2
3 6
x 10
1 0.5
winf (j)φˆp (ωj )
(15)
Regarding the choice of the window {winfj } of size J, several different windows have been suggested. The Danniell method [14] for non parametric spectral estimation correspond to: 1 (16) winfj = 2J + 1 Lee proposed the following window [15]: ˜ winf j winfj = J ˜ winf
(17)
k=−J
k
�
3 ˜ winf k = 4J
3
−20
0
−3
−2
−1
j=k−J
where
2
−40
j=1
In order to reduce the variance of the periodogram, an average of samples of the periodogram in the frequency domain could be applied: φˆD (ωk ) =
advantages of both time modified periodogram and frequency modified periodograms. However, the choice of the estimator is not unique. Others optimally smoothed periodograms are derived in the literature, we can cite [15] or the smoothed periodograms that use cepstral coefficients introduced in [16].
j2 1− 2 p
(18)
For our estimation, we propose to use averaging in the frequency domain of Welch periodogram using Lee window with J = 3. However, the choice of the span of frequency window can be depicted according to [15]. This combination leads to our nonparametric spectral estimator which exhibits a clean spectrum of signals. In fact, this estimator takes the
0 1 Frequancy [Hz] Akaike weights Rice
2
3 6
x 10
1 0.5 0
−3
−2
−1
0 Frequancy [Hz]
1
2
3 6
x 10
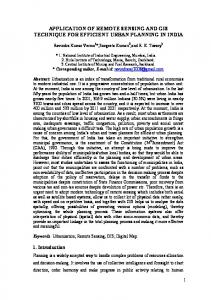
Fig. 1. Spectrum sensing with the blind spectrum approach based on distribution analysis: Application of the non-parametric spectral estimator for a GSM signal at carrier 1835 MHz
The spectrum sensing using a simple Fourrier transform (FFT) and the smoothed estimator is shown in Fig. 1 for a GSM signal at carrier 1835Mhz. As seen in this figure, we obtain interesting results in terms of PU signal detection. We remark that, when we estimate the distribution of the received signal, it’s obviously more interesting to deal with frequency cleaned samples. An intuitive explication could be handled in this way: When we use smoothed periodograms, we decrease the variance of the signal. In this case, the distribution of the received signal will move away a Gaussian distribution that represents a noise distribution. So, if we want to estimate the distribution of the received signal, using first before smoothed periodograms is evidenced.
P = 0.05
SNR = −8dB
F
1
1 0.9
0.9 0.8
0.7
0.7
0.6
0.6
PD
PD
0.8
Cyclostationary detector Akaike weights detector (1) Akaike weights detector (2) Energy detector
0.5
0.5
0.4
0.4
0.3
0.3
0.2
0.2
0.1
0.1
0 −18
−16
−14
−12
−10 −8 SNR [dB]
−6
−4
−2
0
Fig. 2. Probability of detection vs. SNR for the sensing techniques based on model selection: (1) with application of smoothed estimator, (2) without application of smoothed estimator, in comparison with cyclostationary detector and energy detector.
Fig. 2 depicts the detection comparison of the modified detector and the initial detector with energy detector and cyclostationary detector. This figure shows the probability of detection versus SNR ranging between −18 dB and 0 dB at a constant false alarm rate (PF = 0.05) for the four sensing detectors. From the simulation results, we show that the proposed detector outperforms the initial detector under the same interference condition. For further comparison, the performance simulation compared the complementary receiver operating characteristics (ROC) for the modified detector and the initial detector, and energy detector and cyclostationary detector, as is shown in Fig. 3. All detectors work at SNR = −8dB condition with data length: N = 2048 samples. From the curve, we show that the modified detector outperforms the energy detector and model selection based detector without application of smoothed estimator. In conclusion, the proposed detector still has satisfying performance. V. C ONCLUSION The concept of cognitive radio is based essentially on the performances of spectrum sensing techniques. Recently, a blind spectrum sensing detector was developed to sense vacant sub-bands in the PU spectrum. This sensing technique is based on distribution analysis of the received PU signal. In this paper, we propose to use non parametric spectral estimation to the PU received signal in order to apply the blind sensing technique. A global performances evaluation have been proposed to compare the different techniques. Nevertheless, we notice that blind spectrum sensing technique that use cleaned frequency signal to detect the presence of PU represents a good opportunity since the complexity of the initial technique is not well affected.
0
Cyclostationary detector Akaike weights detector (1) Akaike weights detector (2) Energy detector 0
0.1
0.2
0.3
0.4
0.5 P
0.6
0.7
0.8
0.9
1
F
Fig. 3. ROC curve for the sensing techniques based on model selection: (1) with application of smoothed estimator, (2) without application of smoothed estimator, in comparison with cyclostationary detector and energy detector with SNR = −8dB.
R EFERENCES [1] J. Mitola. Cognitive radio for flexible mobile multimedia communications. IEEE International Workshop on Mobile Multimedia Communications, 1999. [2] J. Mitola. Cognitive radio: An integrated agent architecture for software defined radio. Doctor of Technology, Royal Inst. Technol. (KTH), Stockholm, Sweden, 2000. [3] A. Sahai and D. Cabric. Spectrum sensing: fundamentals limits and practical challenges. IEEE International Symposium on New Frontiers in Dynamic Spectrum Access Network(DySPAN), November 2005. [4] A.V. Dantawate and G.B. Giannakis. Statistical tests for presence of cyclostationarity. IEEE Transactions on Signal Processing, 42(9):2355– 2369, Sept. 1994. [5] M.A. Lagunas-Hernandez, M.A. Rojas, and P. Stoica. New spectral estimation based on filterbank for spectrum sensing. IEEE International Conference on Acoustics, Speech and Signal Processing, April 2008. [6] H. Urkowitz. Energy detection of unknown deterministic signals. Proceeding of the IEEE, 55(4):523–531, Apr. 1967. [7] B. Zayen, A. Hayar and D. Nussbaum. Blind spectrum sensing for cognitive radio based on model selection. CrownCom, May 15-17 Singapore, 2008. [8] M. Ghozzi, B. Zayen and A. Hayar. Experimental study of spectrum sensing based on distribution analysis. 18th ICT-MobileSummit Conference, June 10-12 Santander, Spain, 2009. [9] H. Akaike. Information theory and an extension of the maximum likelihood principle. Second International Symposium on Information Theory, Budapest, pages 267–281, Budapest, Hungary, 1973. [10] H. Akaike. On the likelihood of a time series model. The Statistician, 27(3):217–235, Dec. 1978. [11] P.D. Welch. The use of fast fourrier transform for the estimation of power spectra: A method based on time averaging over short, modified periodograms. IEEE Transactions on Audio Electroacoustics, AU(15):70–73, June 1967. [12] T.C.M. Lee. A simple span selector for periodogram smoothing. Biometrica, 84:965–969, 1997. [13] P. Stoica and R. Moses. Introduction to spectral analysis. Prentice hall, Upper Saddle River,NJ, 1997. [14] P.J. Daniell. On the theoretical specification and sampling properties of autocorrelated time-series. J. Royal Statistical Society, 8:88–90, 1946. [15] P. Stoica and T. Sundin. Optimally smoothed periodogram. Conference Record of the Thirty-Third Asilomar Conference on Signals, Systems and Computers, 2:1082–1086, 1999. [16] P. Stoica and N. Sandgren. Smoothed nonparametric spectral estimation via cepstrum thresholding. IEEE Signal Processing magazine, 23(6):34– 45, November 2006.