Application of Taguchi-based Grey Fuzzy Logic for Simultaneous Optimization in TiO2/WSix-based Vertical Double-gate MOSFET K.E.Kaharudin, F.Salehuddin, A.S.M.Zain and M.N.I.A.Aziz Centre for Telecommunication Research and Innovation, Faculty of Electronics and Computer Engineering, Universiti Teknikal Malaysia Melaka (UTeM), Hang Tuah Jaya, Durian Tunggal, 76100 Melaka
[email protected]
Abstract— This present study focuses on finding the optimal process parameters, considering multiple electrical properties of titanium dioxide/tungsten silicide (TiO2/WSix)-based vertical double-gate MOSFET via L9 orthogonal array (OA) Taguchibased grey fuzzy logic. Four process parameters that are VTH implant energy, halo implant dose, source/drain (S/D) implant dose and S/D implant tilt angle, are optimized to obtain the most desired value of on-current (ION), off-current (IOFF) and subthreshold slope (SS). The design of experiment (DoE) is based on the L9 OA of Taguchi method and the experimental value for multiple electrical characteristics are represented by a grey fuzzy reasoning grade (GFRG). The most optimal level of four process parameters towards ION, IOFF and SS are chosen based on the highest GFRG. The results of analysis of variance (ANOVA) show that the most dominant process parameter is S/D implant tilt angle with 96.76% factor effect on GFRG. The most optimal value for ION, IOFF and SS after the optimization are 1589.2 µA/µm, 8.483E-10 A/µm and 68.21 mV/dec respectively with 0.564 of GFRG. Index Terms—ANOVA; GFRG; Off-Current; On-Current.
I. INTRODUCTION Process parameter variations are one of the main factors to have a significant influence on the electrical properties of the Metal-oxide-semiconductor Field Effect Transistor (MOSFET). As stated in the International Technology Roadmap for Semiconductor (ITRS) [1], the key problems that circuit designers face due to further shrinking of feature sizes is the increasing variability of design-related parameters, resulting from process parameter variations, e.g., channel doping [2]. The channel region of a MOSFET is doped with impurity atoms. These atoms are randomly distributed into the channel via dopant implantation processes that leads to statistical variations of the implanted impurities [3]. The process parameter variations can be categories into global and local variations. For global variations, such as doping concentration, energy and tilt angle do change equally for all MOSFETs [4]. In contrast, local variations are recognized as random uncorrelated variations in which each MOSFET is affected differently. In other words, variations are distinguished by their spatial correlation distance where local variations have no correlation, whereas global variations has a very large correlation distance [3]. Channel doping is regarded as global variations since they can be intentionally biased to attain extremely slow and fast switching operation of the MOSFET.
Several previous reports have utilized various of statistical methods to reduce the process parameter variations in order to obtain the desired electrical properties of MOSFETs. For instance, a technical report by Ramakrishnan applied response surface methodology (RSM) to model the variability for 65nm technology of MOSFET [3]. The results indicated that the RSM did succeed to model the threshold voltage (VTH), ION, IOFF and SS of the 65nm MOSFET simultaneously. However, this approach was quite time consuming because it requires a lot of data for design of experiment (DoE). Alternatively, Taguchi method can be applied to solve the optimization problems related to process parameter variations in MOSFETs [5] . Salehuddin et al. and Afifah Maheran et al. have utilized Taguchi method for solving various of optimization problems in MOSFETs [6]– [9]. Although, Taguchi method does require a least of experimental data, it is however, only restricted to a single electrical characteristic’s optimization. To overcome this particular drawback, grey fuzzy logic approach is introduced to compensate the weakness of Taguchi method. Several previous works on the application Taguchi-based grey fuzzy logic have been reported in many engineering areas [10]–[13]. The Taguchi-based grey fuzzy logic approach is basically based on DoE consists of a special orthogonal array (OA) that is assigned to every involved factor (process parameter) with their corresponding levels. To solve multiple optimization problems, the experimental data retrieved from the DoE are converted into grey relational coefficients (GRCs). These GRCs are then converted into grey fuzzy reasoning grade (GFRG) to represent multiple electrical properties. This case study emphasizes on the simultaneous optimization of ION, IOFF and SS in TiO2/WSix-based vertical double-gate MOSFET using L9 OA of Taguchi-based grey fuzzy logic approach. II. TCAD SIMULATION This section will provide a brief description on the simulation of the TiO2/WSix-based vertical double-gate MOSFET using Silvaco TCAD Tools. A. Process Simulation The 2-D simulation for 10-nm gate length (Lg) TiO2/WSixbased vertical double-gate n-channel MOSFET is studied using ATHENA module of Silvaco TCAD tools. The geometric design is built based on the previous report in [14], [15]. Table 1 lists the physical parameters used in the
e-ISSN: 2289-8131 Vol. 9 No. 2-13
23
Journal of Telecommunication, Electronic and Computer Engineering
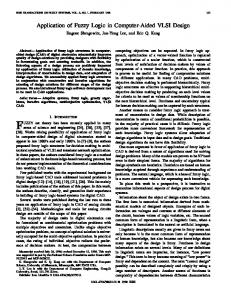
simulated device. The 2-D cross-section of the device which define the geometry like gate length (Lg), channel length (Lc), silicon pillar’s height (Hsp) and etc. are shown in Figure 1. Table 1 Physical Parameters for Simulated TiO2/WSix-based Vertical Double-gate MOSFET Parameters Gate Length (Lg) Gate Thickness (Tg) Silicon Pillar Heigth (Hsp) Silicon Pillar Thickness (Tsp) TiO2 Thickness Spacer Nitride Thickness (TSi3Ni4) Channel Length (Lc) Metal-gate Workfunction (WF)
Value 10 nm 9 nm 14 nm 15 nm 3 nm 15 nm 20 nm 4.5 eV
Figure 2: Contour Mode of 10nm Lg of WSix/TiO2-based Vertical Double-gate NMOS
Figure 1: Cross section of 10nm Lg of WSix/TiO2-based Vertical Doublegate NMOS
B. Device Simulation The device simulation of the TiO2/WSix-based vertical double-gate MOSFET was conducted by using an ATLAS module of Silvaco TCAD tools. Figure 2 illustrates the contour mode of the device, showing the tabulation of silicon, WSix, TiO2, silicon nitride (Si3Ni4) and aluminum. Figure 3 depicts the subthreshold ID vs. VG curve at VD = 0.05 V and VD = 1.0 V for the device. The value of ION, IOFF and SS was extracted from the curve. The initial value of ION, IOFF and SS were observed to be 1588.3 µA/µm, 8.477E-10 A/µm and 68.24 mV/dec respectively. The subthreshold swing (SS) was extracted from the inverse slope of log10 ID vs VGS characteristic shown in (1) [16]:
d (log 10 I DS ) SS dVGS
24
1
(1)
Figure 3: Graph of subthreshold drain current (ID)-gate voltage (VG)
III. SIMULTANEOUS OPTIMIZATION OF ION, IOFF AND SS In this study, the L9 OA of Taguchi method was combined with a grey fuzzy logic approach to optimize multiple electrical characteristics of the device. The steps for conducting a simultaneous optimization by using L9 OA of Taguchi-based grey fuzzy logic approach is shown in Figure 4. A. L9 Orthogonal Array (OA) of Taguchi Method There are four process parameters studied in this study, which are known as VTH implant energy, halo implant dose, S/D implant dose and S/D implant tilt angle. Since four process parameters are involved, the L9 OA of Taguchi method has been applied in this current study. Table 2 shows the list of process parameters and their levels. Table 3 shows the combination of levels of process parameters with their corresponding electrical characteristics. The information in Table 3 is used to study the effects of process parameters on ION, IOFF and SS characteristics.
e-ISSN: 2289-8131 Vol. 9 No. 2-13
Application of Taguchi-based Grey Fuzzy Logic for Simultaneous Optimization in TiO2/WSix-based Vertical Double-gate MOSFET
Identify process parameters and electrical characteristics to be evaluated
Fuzzification (using membership function)
Determine the number of process parameters
Application of Fuzzy rule
Assign the factors to columns of the L9 OA of Taguchi method
Defuzzification (generating GFRG)
higher-the-better performance characteristics, while IOFF and SS are classified into lower-the-better performance characteristics. The following equations are used to normalize the electrical characteristics, respectively [17]: xi ( k ) *
xi (k ) min xi (k ) , higher-the-better max xi (k ) min xi (k )
xi ( k ) *
(2)
max xi (k ) xi (k ) , lower-the-better max xi (k ) min xi (k )
(3) Conduct the experiments based on the L9 OA of Taguchi method
Defuzzification (generating GFRG)
Normalize the data
Select the optimal levels of process parameters
where xi*(k) and xi(k) are the sequence after data preprocessing and comparability sequence. Table 4 shows the normalized sequence of all the responses based on their corresponding performance characteristics. Table 4 Normalized Response Values for Conducted Experiments
Calculate the deviation sequences
Conduct verification test
Calculate the Grey relational coefficients
Figure 4: Optimization using L9 OA of Taguchi-based Grey Fuzzy Logic Table 2 Process Parameters of TiO2/WSix-based Vertical double gate n-channel MOSFET Sym. A B C D
Process Parameter VTH Implant Energy Halo Implant Dose S/D Implant Dose S/D Implant Tilt Angle
Units kev
Level 1
Level 2
Level 3
20
22
24
-3
2.87E13
2.89E13
2.91E13
-3
atom/cm
2.21E18
2.23E18
2.25E18
degree
76
77
78
atom/cm
Exp no. 1 2 3 4 5 6 7 8 9
Parameter Level A B C D 1 1 1 1 1 2 2 2 1 3 3 3 2 1 2 3 2 2 3 1 2 3 1 2 3 1 3 2 3 2 1 3 3 3 2 1
ION (V) 1588.3 1577.4 1567.5 1581.6 1589.3 1576.9 1592.8 1581.3 1589
IOFF (10 ) (A/µm) 8.477 8.354 8.203 8.446 8.483 8.351 8.610 8.447 8.484
ION 1 0.8221 0.3913 0 0.5573 0.8617 0.3715 1 0.5455 0.8498
IOFF 1 0.3268 0.6290 1 0.4029 0.3120 0.6364 0 0.4005 0.3096
SS 1 0.8113 0.4151 0 0.5660 0.8679 0.3962 1 0.5660 0.8302
∆oi (k) is the deviation sequence of the reference sequence xo* (k) and the comparability sequence xi*(k) as shown in (4) [17]: oi (k ) | xo* (k ) xi* (k ) |
The deviation sequences were calculated and summarized in Table 5. Table 5 Deviation Sequences
Table 3 L9 Orthogonal Array Table for Responses -10
Exp. no Reference Sequence 1 2 3 4 5 6 7 8 9
SS (mV/dec) 68.24 68.45 68.67 68.37 68.21 68.46 68.14 68.37 68.23
B. Grey Relational Analysis (GRA) Multiple electrical characteristics of the device have been investigated using GRA. Using GRA approach, the multiple electrical characteristics of the device like ION, IOFF and SS are converted into grey relational coefficient (GRC). Initially, all the electrical characteristics obtained from L 9 OA of Taguchi method are normalized in the range of 0 to 1. These electrical characteristics are categorized into different performance characteristics where ION is classified into
Deviation sequences Exp no. 1 Exp no. 2 Exp no. 3 Exp no. 4 Exp no. 5 Exp no. 6 Exp no. 7 Exp no. 8 Exp no. 9
∆0i (1) 0.1779 0.6087 1 0.4427 0.1383 0.6285 0 0.4545 0.1502
∆0i (2) 0.6732 0.3710 0 0.5971 0.6880 0.3636 1 0.5995 0.6904
∆0i (3) 0.1887 0.5849 1 0.4340 0.1321 0.6038 0 0.4340 0.1698
After data normalization is done, a grey relational coefficient (GRC) is measured with the pre-processed sequence. The GRC is defined as follows [17]:
i (k )
min max oi (k ) max
(5)
where ξ is a n identification coefficient. Since all the process parameters are given and equal preference, ξ is taken as 0.5, while ∆max and ∆min are the maximum and minimum absolute difference. Table 6 shows the GRCs of ION, IOFF and SS for each of the experiments.
e-ISSN: 2289-8131 Vol. 9 No. 2-13
25
Journal of Telecommunication, Electronic and Computer Engineering Table 6 Grey Relational Coeffecients (GRCs) Exp. no. 1 2 3 4 5 6 7 8 9
ION ξi (1) 0.7376 0.4510 0.3333 0.5304 0.7833 0.4431 1 0.5238 0.7690
GRC IOFF ξi (2) 0.4262 0.5741 1 0.4557 0.4209 0.5790 0.3333 0.4548 0.4200
SS ξi (3) 0.7260 0.4609 0.3333 0.5353 0.7910 0.4530 1 0.5353 0.7465
C. Grey Fuzzy Logic Analysis Grey fuzzy logic is introduced to deal with the uncertainty using membership values that varies from 0 to 1. This approach involves fuzzification of input and output parameters, application of fuzzy rule and defuzzification of the output responses. The grey fuzzy logic analysis is performed by using the Matlab toolbox. The GRC of each electrical characteristic was utilized as an input variable to the defuzzification process. The input variables were then processed in the fuzzy inference system (mamdani type) based on a set of fuzzy rules to generate an output. Mamdani type system is able to give the fuzzy output that can be converted into a non-fuzzy value called a grey fuzzy reasoning grade (GFRG) via defuzzification method. The GRCs for ION, IOFF and SS are fuzzified into three sets which are small (S), medium (M) and large (L) as depicted in Figure 5. The output of GFRGs were fuzzified into nine sets which were ultra-small (US), very-small (VS), small (S), low-medium (LM), medium (M), high-medium (HM), large (L), very-large (VL) and ultra-large (UL) as shown in Figure 6. Figure 7 shows a set of fuzzy rule that have been applied in this study. The GFRG are capable of handling the complicated optimization of multiple electrical properties. Utilizing the value of GFRG, the relational degree between main factor and the others was computed for each electrical property.
Figure 6: Membership Function for GFRG (output)
Figure 7: Nine sets of Fuzzy Rule
IV. ANALYSIS OF THE RESULTS AND VERIFICATION TEST The GFRG value for each set of experiments were predicted based on the grey fuzzy rule. For instance, the GRCs of the experiment no. 1 were selected (refer to Table 6) which resulted in 0.555 of GFRG as shown in Figure 8. The same procedure was repeated for all the remaining experiments. Table 7 shows the obtained GFRGs from the predicted values of fuzzy inference system (FIS) and its rank.
Figure 5: Membership Function for GRC of ION, IOFF and SS (input)
Figure 8: Rule Box in Matlab (input1=0.738, input2=0.426, input3=0.726)
26
e-ISSN: 2289-8131 Vol. 9 No. 2-13
Application of Taguchi-based Grey Fuzzy Logic for Simultaneous Optimization in TiO2/WSix-based Vertical Double-gate MOSFET Table 7 Grey Fuzzy Reasoning Grade (GFRG) and their Ranks Exp. no.
Grey relational coefficient ION IOFF SS ξi (1) ξi (2) ξi (3) 0.7376 0.4262 0.7260 0.4510 0.5741 0.4609 0.3333 1 0.3333 0.5304 0.4557 0.5353 0.7833 0.4209 0.7910 0.4431 0.5790 0.4530 1 0.3333 1 0.5238 0.4548 0.5353 0.7690 0.4200 0.7465
1 2 3 4 5 6 7 8 9
GFRG
Rank
0.555 0.5 0.5 0.5 0.564 0.5 0.5 0.5 0.562
3 4 4 4 1 4 4 4 2
According to Table 7, experiment row no. 5 has the highest GFRG compared to the others. The higher value of GFRG implies that the results are close to ideal normalized value. A. Factor Effect on GFRG Analysis The optimal level of process parameters can be obtained by conducting factor effect on GFRG analysis. Since the DoE is orthogonal, the GFRG at different levels can be separate out. For instance, the mean of the GFRG for factor A (VTH implant energy) at level 1 can be computed by averaging the GFRG at the experiment row 1 to 3 as the level 1 has been specifically allocated for column factor A as listed in Table 3. All the calculated GFRG for all the process parameters are listed in Table 8. Table 8 Grey Fuzzy Reasoning Grade (GFRG) for Process Parameters Sym. A B C D
Process Parameters VTH Implant Energy Halo Implant Dose S/D Implant Dose S/D Implant Tilt Angle
Grey Fuzzy Reasoning Grade Level 1 Level 2 Level 3 0.5183 0.5213 0.5207 0.5183 0.5213 0.5207 0.5183 0.5207 0.5213 0.5603 0.5 0.5
The GFRGs for each process parameters were then translated into factor effect graph to identify the optimal value for each of the process parameters as depicted in Figure 9. It is clearly shown that the most optimal value of process parameters based on the highest GFRG are A2B2C3D1.
B. Analysis of Variance (ANOVA) for GFRG To investigate the significance of the process parameters towards GFRG, the ANOVA is carried out. The ANOVA table consists of parameters such as the sum of squares (SSQ), degree of freedom (DF), variance or mean square (MS), F-value and percentage of the effect of each process parameter upon GFRG. The results of ANOVA show that factor D (S/D implant tilt angle) is the most dominant process parameter with 96.76% factor effect on GFRG. The completed ANOVA table for GFRG is shown in Table 9. Table 9 Results of ANOVA for GFRG Process Parameter (A) VTH Implant Energy (B) Halo Implant Dose (C) S/D Implant Dose (D) S/D Implant Tilt Error Total
DF
SSQ
MS
Fratio
2
0.0015m
0.00075m
6.52m
Percentage contribution (ρ) 0.02
2
0.0015m
0.00075m
6.52m
0.02
2
0.0015m
0.00075m
6.52m
0.02
2
0.007
0.00035
30.43
96.76
2 10
0.00023 0.00723
0.115m
-
3.18 100
C. Verification Test The verification test was conducted to verify the optimal combination level of process parameters predicted by L9 OA of Taguchi-based grey fuzzy logic with the actual results. The optimal combination of process parameter levels resulted in the highest GFRG was found to be A2B2C3D1. Table 10 shows the best combinational levels of the process parameters of the device. The device was then re-simulated using the optimized level of process parameters (A2B2C3D1). The predicted GFRG, using the optimal level of process parameters can be measured using (7) [17]:
m i m q
(7)
i 1
where are the total means of GFRG, is the mean of GFRG at optimal level and q is the number of process parameters. The predicted GFRG of the optimal level of process parameters for the device can be calculated as follows:
4
m i m i 1
0.5201 (0.5213 0.5201) (0.5213 0.5201) (0.5213 0.5201) (0.5603 0.5201)
0.564
The improvements in GFRG with optimized process parameters for multiple electrical characteristics are summarized in Table 11. The GFRG of process parameters after optimization was slightly improved by 1.6%. The highest GFRG indicates the closeness of the ION, IOFF and SS to their desired value. Figure 9: Factor effect plot of GFRGs for ION, IOFF and SS
e-ISSN: 2289-8131 Vol. 9 No. 2-13
27
Journal of Telecommunication, Electronic and Computer Engineering Table 10 Optimal Level of Process Parameters Symbol A B C D
Process Parameter
Units
VTH Implant Energy Halo Implant Dose S/D Implant Dose S/D Implant Tilt Angle
kev atom/cm-3 atom/cm-3 degree
(FKEKK), Universiti Teknikal Malaysia Melaka (UTeM) for sponsoring this research study. Optimal Value 22 2.89E13 2.25E18 76
Based on Table 11, ION is slightly improved by 0.06% after the optimization. Besides that, the ION is increased by 6.87% compared to ITRS 2013 prediction. The IOFF is observed to be slightly increased by 0.07% from the value before optimization. However, the IOFF is still under 100 A/µm as predicted by ITRS 2013 [1]. The SS value after the optimization is slightly decreased by 0.04% from the value before the optimization. Hence, it is concluded that the ION, IOFF and SS of the device can be simultaneously optimized using a L9 OA of Taguchi-based grey fuzzy logic method. Table 11 Improvements in GRG and Responses with Optimized Process Parameters Condition Description
Level ION (µA/µm) IOFF (A/µm) SS (mV/dec) GFRG
Before Optimization (First set of experiment row)
After Optimization using L9 OA of Taguchi-based grey fuzzy logic A1B1C1D1 A2B2C3D1 1588.3 1589.3 8.477E-10 8.483E-10 68.24 68.21 0.555 0.564 Improvement in GRG = 1.6 %
ITRS 2013 Prediction [1] N/A ≥ 1480 ≤ 100n N/A N/A
REFERENCES [1] [2]
[3] [4]
[5]
[6]
[7]
[8]
[9]
[10]
V. CONCLUSION
[11]
Based on the ANOVA for GFRG, the S/D implant tilt angle gives the highest contribution for reducing the total variation of multiple electrical characteristics. The combination of process parameter for a high I ON, a low IOFF and a low SS in TiO2/WSix-based vertical double-gate nchannel MOSFET are VTH implant energy of 22 kev, halo implant dose of 2.89E13 atom/cm-3, S/D implant dose of 2.25E18 atom/cm-3 and S/D implant tilt angle of 76o. The highest ION obtained from the analysis is 1589.3 µA/µm with a slight improvement of 0.06% compared to the ION before the optimization. The IOFF, and SS characteristic are within the acceptable range. The final results have shown that the L9 OA of Taguchi method is capable of optimizing multiple electrical characteristics simultaneously in the TiO2/WSixbased vertical double-gate MOSFET.
[12]
[14]
[15]
[16]
ACKNOWLEDGMENT The authors would like to thank to the Ministry of Higher Education (MOHE) of Malaysia, Mybrain15 and Centre for Telecommunication Research and Innovation (CeTRI), Faculty of Electronics and Computer Engineering
28
[13]
[17]
ITRS, “International Technology Roadmap Semiconductor,” 2013. C. Y. Chen, J. T. Lin, and M. H. Chiang, “Comparative study of process variations in junctionless and conventional double-gate MOSFETs,” in IEEE Nanotechnology Materials and Devices Conference, IEEE NMDC 2013, 2013, pp. 1–2. H. Ramakrishnan, “Variability: Analysis and Impact on Circuit Response,” 2009. K. E. Kaharudin, A. H. Hamidon, and F. Salehuddin, “Design and Optimization Approaches in Double Gate Device Architecture,” Int. J. Eng. Technol., vol. 6, no. 5, pp. 2070–2079, 2014. N. A. F. Othman, F. N. N. Azhari, S. F. W. M. Hatta, and N. Soin, “The Application of Taguchi Method on the Robust Optimization of p-FinFET Device Parameters,” in IEEE International Conference on Semiconductor Electronics (ICSE), 2016, pp. 141–144. F. Salehuddin, A. S. M. Zain, N. M. Idris, A. K. M. Yamin, A. M. A. Hamid, I. Ahmad, and P. S. Menon, “Analysis of Threshold Voltage Variance in 45nm N-Channel Device Using L27 Orthogonal Array Method,” Adv. Mater. Res., vol. 903, pp. 297–302, Feb. 2014. F. Salehuddin, K. E. Kaharudin, A. S. M. Zain, A. K. M. Yamin, and I. Ahmad, “Analysis of process parameter effect on DIBL in nchannel MOSFET device using L27 orthogonal array,” in International Conferences on Fundamental and Applied Sciences, AIP Conf. Proc., 2014, vol. 1621, no. 1, pp. 322–328. A. H. Afifah Maheran, P. S. Menon, I. Ahmad, and S. Shaari, “Optimisation of Process Parameters for Lower Leakage Current in 22 nm n-type MOSFET Device using Taguchi Method,” J. Teknol., vol. 68, no. 4, pp. 1–5, 2014. A. H. Afifah Maheran, P. S. Menon, I. Ahmad, S. Shaari, H. A. Elgomati, and F. Salehuddin, “Design and Optimization of 22 nm Gate Length High-k/Metal gate NMOS Transistor,” J. Phys. Conf. Ser., vol. 431, pp. 1–9, 2013. M. A. Wahid, B. O. P. Soepangkat, and B. Pramujati, “Multi Response Optimization in Face Milling Process of ASSAB XW-42 Tool Steel with Liquid Nitrogen Cooling using Taguchi-Grey-Fuzzy Method,” ARPN J. Eng. Appl. Sci., vol. 11, no. 4, pp. 2711–2717, 2016. V. Kumar and R. Ramanujam, “Experimental Investigation and Optimization of Wear Characteristics of Metal Matrix Composites,” Int. J. Innov. Sci. Eng. Technol., vol. 2, no. 5, pp. 288–293, 2015. N. Lusi, K. Muzaka, B. Oedy, and P. Soepangkat, “Parametric Optimization of Wire Electrical Discharge Machining Process on AISI H13 Tool Steel using Weigthed Principal Component Analysis (WPCA) and Taguchi Method,” ARPN J. Eng. Appl. Sci., vol. 11, no. 2, pp. 945–951, 2016. S. Tamang and M. Chandrasekaran, “Application of grey fuzzy logic for simultaneous optimization of surface roughness and metal removal rate in turning Al-SiCp metal matrix composites,” in 5th International & 26th All India Manufacturing Technology, Design and Research Conference (AIMTDR 2014), 2014, pp. 832–1–832–7. K. E. Kaharudin, F. Salehuddin, A. S. M. Zain, and M. N. I. A. Aziz, “Taguchi Modeling with the interaction test for higher drive current in WSix/TIO2 channel vertical double gate NMOS device,” J. Theor. Appl. Inf. Technol., vol. 90, no. 1, pp. 185–193, 2016. K. E. Kaharudin, F. Salehuddin, A. S. M. Zain, M. N. I. A. Aziz, Z. Manap, N. A. A. Salam, and W. H. M. Saad, “Multi-response optimization in vertical double gate PMOS device using Taguchi method and grey relational analysis,” in IEEE International Conference on Semiconductor Electronics (ICSE), 2016, pp. 64–68. V. K. Yadav and A. K. Rana, “Impact of Channel Doping on DGMOSFET Parameters in Nano Regime-TCAD Simulation,” Int. J. Comput. Appl., vol. 37, no. 11, pp. 36–41, 2012. V. C. Sekhar, S. A. Hussain, V. Pandurangadu, and T. S. Rao, “Grey Relational Analysis to Determine Optimum Process Parameters of „ Emu ‟ Feather Fiber Reinforced Epoxy Composites,” Int. J. Emerg. Technol. Adv. Eng., vol. 5, no. 8, pp. 86–90, 2015.
e-ISSN: 2289-8131 Vol. 9 No. 2-13