Applying High-Performance Bioinformatics Tools for Outlier Detection in Log Data Markus Wurzenberger, Florian Skopik, Roman Fiedler
Wolfgang Kastner
Austrian Institute of Technology, Center for Digital Safety and Security Donau-City-Strasse 1, 1220 Vienna, Austria
[email protected]
Vienna University of Technology Treitlstrasse 3, 1040 Vienna, Austria
[email protected]
Abstract—Most of today’s security solutions, such as security information and event management (SIEM) and signature based IDS, require the operator to evaluate potential attack vectors and update detection signatures and rules in a timely manner. However, today’s sophisticated and tailored advanced persistent threats (APT), malware, ransomware and rootkits, can be so complex and diverse, and often use zero day exploits, that a pure signature-based blacklisting approach would not be sufficient to detect them. Therefore, we could observe a major paradigm shift towards anomaly-based detection mechanisms, which try to establish a system behavior baseline – either based on netflow data or system logging data – and report any deviations from this baseline. While these approaches look promising, they usually suffer from scalability issues. As the amount of log data generated during IT operations is exponentially growing, high-performance analysis methods are required that can handle this huge amount of data in realtime. In this paper, we demonstrate how high-performance bioinformatics tools can be applied to tackle this issue. We investigate their application to log data for outlier detection to timely reveal anomalous system behavior that points to cyber attacks. Finally, we assess the detection capability and run-time performance of the proposed approach.
1. Introduction Many of today’s ICT security solutions promise an automatic detection (and even mitigation) of malicious behavior. They apply complex detection schemes and heuristics – and massive data exchange across systems, organizations and even countries: Threat Intelligence is the new hype. But still, effective monitoring of a technical infrastructure is the most essential phase of security incident handling within organizations today. To establish situational awareness, it is indispensable for organizations to have a thorough understanding about what is going on in their network infrastructures. Therefore, clustering techniques are very effective tools for periodically reviewing rare events (outliers) and checking frequent events by comparing cluster sizes over time (e.g., trends in the number of requests to certain resources). Furthermore, a methodology and supporting tools to review log data and to find anomalous events in log data are needed. Existing
tools are basically suitable to cover all these requirements, but they still suffer from some essential shortcomings. Most of them, such as SLCT [1], implement word-based matching of log entries, but for example do not identify synonyms which only differ in one character, such as ‘php-admin’ and ‘phpadmin’; or consider similar URLs as completely different words, although they have the same meaning. Hence, the implementation of character-based matching with comparable speed such as word-based matching is necessary. Furthermore, existing tools are often notcapable of processing large log files to extract cluster candidates over months and to perform gradual logging, which can be applied to generate a base corpora to identify how and where log clusters are changing over the time. In the domain of bioinformatics, various methods have been developed to analyze and study the similarity of biologic sequences (DNA, RNA, amino acids), group similar sequences and extract common properties [2]. The algorithms that implement these features need to fulfill some fierce requirements – similarly important to process log data: •
•
•
•
Adequate digital representation: Biologic sequences must be represented as data streams in an appropriate format, i.e., no information must be lost, but the format should be as simple as possible. Dealing with natural variations: The dependency between a segment of a sequence and a certain biologic function (implemented by this segment) is sometimes not strict (or obvious). This means natural variations need to be accounted for and a certain degree of fuzziness in the input data accepted. Dealing with artificial inaccuracies: The process of recording long and complex biologic sequences causes inevitable inaccuracies and small errors. The negative influence of those (artificially introduced) variations in the following analysis phase should, however, be kept to an absolute minimum. Dealing with massive data volumes: Since biologic data sequences are (even to represent simple functions) very complex, algorithms need to deal with these large amounts of data usually by (i) being scheduled in parallel and (ii) accepting certain inaccuracies caused by this non-sequential processing. In general, all these requirements also apply to mod-
ern log data processing as (i) data needs to be processed extremely fast (this means depending on the application approximately in real time); (ii) data analysis needs to be scheduled in parallel in order to scale; and (iii) the process needs to accept certain inaccuracies and errors that occur due to conversion errors from varying character encodings, and slight differences in configurations and output across software versions. Furthermore, these tools aim at processing character sequences without taking into account their semantic meanings. As a consequence, if mentioned tools are not applied to biologic sequences but to re-coded (converted) digital sequences, such as log data (or even malware code), all of the unique properties of these algorithms can be exploited directly, without the need to design and implement complex tools again. In this paper, we define a method for re-coding log data into the alphabet used for representing canonical amino acid sequences. This allows us to apply high-performance bioinformatics tools to cluster log data. Based on the clustering we perform outlier detection analysis to discover anomalous and erratic behavior. Furthermore, we investigate the applicability and feasibility of our approach in a real setting by simulating a scenario of an attack and evaluate the proposed approach. Finally, we provide an outlook for further applications of the novel model beyond straightforward outlier detection, such as time series analysis to discover anomalous trends. The remainder of the paper is structured as follows. Sect. 2 outlines important background and related work. Then, Sect. 3 describes the overall model for discovering outliers in log data. Section 4 elaborates on the re-coding model, which transforms log line content into a representation which can be understood by bioinformatics tools. After that, we describe how log lines are compared and clustered in Sect. 5 and the detection of outliers in Sect. 6. Section 7 demonstrates the application of our approach and evaluates the feasibility in a realistic setting. Finally, Sect. 8 concludes the paper.
2. Background and Related Work In the domain of cyber security, logging and log data management are of high importance and improve visibility and security intelligence for computer networks. Thus, log data is a source for security- and computer network analysis tools such as anomaly detection [3] and intrusion detection systems [4] that identify anomalous system behavior. In this paper, we focus on the application of the proposed model in the domain of cyber security and concentrate on outlier detection for anomaly and intrusion detection. Various outlier detection methods are discussed in [5]. The main technique we apply in our model for detecting outliers and for creating a computer network’s situation picture is clustering. Many different clustering approaches and algorithms are surveyed in [6]. For clustering log lines density and distance based approaches can be applied. Simple Logfile Clustering Tool (SLCT) [1] is an example for
a density based clustering algorithm especially developed for clustering log data. But the proposed model focuses on distance based algorithms. One well-known metric to compare two sequences of any kind of symbols, hence also log lines, is the Levenshtein distance [7], which bases on the number of edits to get from one sequence to the other. Most bioinformatics tools for clustering amino acid or DNA sequences apply a modified version of the previously mentioned Levenshtein distance. In the case of amino aecid sequences, the number of occurring unique symbols reduces from 256 (in UTF-8 code) to 20 (canonical amino acids). Furthermore, these algorithms make use of the knowledge that there exist empirical statistics that one amino acid naturally can evolve to another one over time. The most popular scoring matrices representing these relations are the PAM (point accepted mutation) matrix and the BLOSUM (blocks substitution matrix) matrix [8]. There exist a couple of sequence alignment algorithms that compare two amino acid sequences. Therefore, a distinction is made between global alignment, where all symbols of two sequences are compared, such as the Needleman-Wunsch algorithm [9] and local alignment, where just a subsequence is compared, such as the SmithWaterman algorithm [10]. An algorithm for clustering amino acids is for example CD-HIT [11].
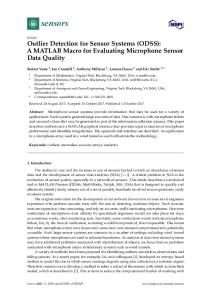
3. Model for Applying Bioinformatics Clustering Tools on Log Data The following section defines the theoretical model for applying high-performance bioinformatics tools for clustering computer log data, which we already motivated in [12]. The proposed modular model comprises several steps from re-coding log data to the alphabet used for describing amino acid sequences to interpretation and analysis of the output for cyber security application: (i) collect log data, (ii) homogenize log data, (iii) re-code and format log data, (iv) compare pairs of log lines according to their similarity, (v) cluster log lines, (vi) retranslate data, (vii) detect outliers and analyse time series. Figure 1 visualizes the proposed model. As the figure shows, the model can be roughly divided into three blocks which are sequentially repeated. Block I covers the process of re-coding log data into a format, which can be exploited by bioinformatics tools. First, in step (i) log data from different sources of the monitored network is collected. When analyzing log data from different sources usually the data shows some differences in the format. For example, main properties such as time stamps are represented in different formats. Therefore, step (ii) is required to homogenize the data. A common time stamp format is important to order log lines chronologically when combining data from different sources. In step (iii), the homogenized data is re-coded from UTF-8 (256 symbols) to the alphabet describing the canonical amino acids (20 symbols). In block II, bioinformatics tools are applied to the recoded data. During step (iv) the re-coded log lines are
A
A
B
B C
C
a1 b1 a2 c1
Homogenize (ii)
Collect log data (i)
>bio1 >bio2 >bio3 >bio4
a1 b1 a2 c1
Re-co de (iii)
I
alphabet used for representing amino acids and converting it into a format, which can be exploited by the applied tools. A basic unit of logging information, e.g., one line for line-based logging, or one XML-element, is called a textual log atom Ltext which consists of a series of symbols s – typically letters and numbers (Eq. 1).The used alphabet to represent log data consists (in most cases) of UTF-8 encoded characters (256 different symbols) of 8 bit size. In the following AU T F −8 refers to this alphabet. Ltext = hs1 s2 s3 . . . sn i where si ∈ AU T F −8
>bio1 >bio2 >bio3 >bio4
(1)
But data represented in this format is unsuitable as input to bioinformatics tools. Those tools require input (biologic sequences) encoded with symbols of the alphabet Abio (Eq. 2) defined for amino acid or DNA sequences. This alphabet consists of 20 symbols only, which represent the 20 canonical amino acids.
d(bio1,bio2) d(bio1,bio3) d(bio2,bio3) Cluster (v) Compare(iv)
II
Abio = {A,C,D,E,F,G,H,I,K,L,M,N,P,Q,R,S,T,V,W,Y} (2)
>bio1 >bio2
text 1 text 2
Re-translate (vi)
A re-coding function takes an input stream encoded as UTF-8 data and transforms it into a representation Lbio (Eq. 3) that is processable by bioinformatics tools.
outlier1 outlier2
Lbio = hs1 s2 s3 . . . sm i where sj ∈ Abio
Outlier detection and time series analysis (vii)
III
Figure 1. Visualization of the model for applying high-performance bioinformatics tools for the application in the domain of cyber security.
compared and a distance d between all pairs of lines is calculated. Therefore, a sequence alignment algorithm for amino acid sequences is applied to the data. Based on the calculated distance in step (v), the log lines then are clustered. Block III implements the security analysis component of the proposed model. First in step (vi), a reverse look up function is used to re-translate the log lines from the alphabet describing canonical amino acids into UTF-8 encoded log data, which is readable for human users. Finally in step (vii), an outlier detection and time series/trend analysis is performed to detect on the one hand rare events and on the other hand changes in the common system behavior. Both can be caused by cyber attacks or invaders, as well as misconfiguration and erratic system behavior. In the remaining paper we focus on outlier detection.
4. Re-coding Model Log data from ICT systems is usually modeled in human-readable textual form. Therefore, before tools from the domain of bioinformatics can be applied to it, step (iii) has to be carried out, i.e., re-coding the log data using the
(3)
In the simplest case, this transformation is a straight forward bijective mapping, where one AU T F −8 symbol is represented by two symbols from Abio . However, for data where certain larger blocks frequently appear, those whole blocks (e.g., server names or IP addresses) could be replaced with a single symbol. This would effectively allow compression of data. Even further information loss could be – depending on the application use case – acceptable. For instance, frequently appearing symbol blocks could be replaced through applying a more intelligent, but just one way mapping, e.g., not a whole IP address but just the last byte or the address’ cross sum could be translated to Abio . Another example are paths (from Web server logs), where each component of a path could be translated through hashing into single symbols of Abio . Furthermore, symbols can be grouped by type, so that for example all separators such as ’/’, ’;’ or spaces can be replaced by one specific element of Abio . Even more complex re-coding schemes are possible, e.g., after identifying dynamic and static parts of log lines with simple log line clustering tools (such as SLCT [1]), more symbols could be spent on the variable parts of log lines (those with higher information entropy) and less symbols (or no symbols at all) on the rather static parts. One simple - but effective - method for re-coding log data into Abio is described in details in the following. In order to re-code Ltext into Lbio , a simple and straight forward solution is to convert each si ∈ Ltext into two1 1 Since the size of the alphabet of Ltext is larger (256 elements) than that of Lbio (20 elements), one si ∈ Ltext has a much higher entropy than one sj ∈ Lbio .
corresponding sj ∈ Lbio symbol by symbol (without any loss of information). For this purpose, each symbol in Ltext (i.e., the single letters of the words in a log line) is converted to its numerical representation in UTF-8. The result of this operation is Lutf (Eq. 4). Lutf = ha1 , a2 , a3 . . . an i where ai ∈ {0, . . . , 255}
(4)
In a second step, each numerical value ai ∈ Lutf is converted into two symbols of the alphabet Abio . Since the size of this alphabet is always 20, a straight forward solution (and in order to use the whole possible input range) is to divide each ai ∈ Lutf by 20, and additionally keep the rest of this division. Eventually, both results s1 (the result of the integer division) and s2 (the rest of the division) are mapped via a simple conversion table (see Tab. 1) to Abio . Concatenating all these symbols in a single stream effectively produces Lbio – the input to alignment and clustering tools from the domain of bioinformatics.
occurs in the description of 20 symbols, one s2 maximally represents 5 symbols of AU T F −8 . Finally, when omitting s1 still the combination of sj ∈ Abio in Lbio raises the entropy of every s2 obtained from Alg. 1. Hence, the result is that the length of Lbio can effectively be cut to a half by accepting a ”small” ambiguity (cf. Lbio in Tab 2). In the remaining paper, we always apply this method for recording Ltext into Lbio . Table 2. S TEP - BY-S TEP RECODING EXAMPLE . Ltext : Lutf : ull Lfbio : Lbio :
1 49 CL L
9 57 CV V
2 50 CM M
. 46 CH H
1 49 CL L
6 54 CR R
8 56 CT T
. 46 CH H
... ... ... ...
To complete step (iii), the data has to be transformed into the correct format. Most of the bioinformatic tools require data in the FASTA format, which has been introduced by Lipman and Pearson [13]. The header required by the FASTA format can be used to store information for the retranslation implemented by step (vi).
Table 1. B IO A LPHABET S YMBOL M APPING . Number: Symbol:
0 A
1 C
2 D
3 E
4 F
5 G
6 H
7 I
8 K
9 L
Number: Symbol:
10 M
11 N
12 P
13 Q
14 R
15 S
16 T
17 V
18 W
19 Y
The re-coding process is further described in Alg. 1. There, the symbol ⊕ extends the collection on the left side with the symbol on the right side. The function utf2num looks up the decimal symbol number in a standard UTF-8 table (e.g., the letter ‘A’ corresponds to the number 65). The function num2bio looks up the letter representation of the numbers 0 to 19 (according to Tab. 1). Algorithm 1 Re-Coding Ltext into Lbio 1: Lbio ← ∅ 2: Lutf ← ∅ 3: for all si ∈ Ltext do 4: Lutf ← Lutf ⊕ utf2num(si ) 5: end for 6: for all ai ∈ Lutf do 7: s1 ← ai /20 8: s2 ← ai %20 9: Lbio ← Lbio ⊕ num2bio(s1 ) ⊕ num2bio(s2 ) 10: end for
A simple option to reduce/compress the mount of data needed to represent one log line by 50% is, instead of ull representing each si ∈ Ltext by two sj ∈ Lbio (cf. Lfbio in Tab 2), to omit the leading character s1 (cf. Alg. 1). This one has less entropy compared to the trailing s2 (cf. Alg. 1), because if all 256 letters of AU T F −8 are occurring in the considered data only the first 12 letters of Abio are used to represent s1 . Since usually less than 100 symbols of AU T F −8 occur in a realistic dataset and these symbols are in general numerically represented in the same region, for example ai ∈ {51, . . . , 150}, which reduces the possible options for s1 to at most 5. Hence, only a quarter of all possible options is used to describe s1 . As a consequence, s1 stores less information than s2 . Furthermore, while one s1
5. Comparing and Clustering of Log Data with Bioinformatics Tools A promising extension of bioinforamtics tools, such as CD-HIT [11], CLUSTAL [14] and UCLUST [15] for log analysis in order to increase the accuracy of results (identifying regions of similarity etc.) is the application of bioclustering on re-coded log data. Since bio-clustering applies methods to group similar sequences which are fundamentally different from the commonly applied text mining approaches, using bio-clustering can considerably improve the quality of results. The reason for this improvement is manifold. First, many common correlation algorithms require decent knowledge about the syntax and semantics of the input data. But, however this is not realistic for logging data from different systems. Second, many text mining and clustering algorithms lack the required degree of uncertainty when processing log data. For instance, if two words differ by just one letter, they are usually considered as completely different in the clustering process, because for text mining, synonym tables are more appropriate. This is however not true for log data, where text junks, such as ‘php-admin’ and ‘phpadmin’ should be considered similar, if not almost equal. Alignment algorithms from the domain of bioinformatics assist by using a different metric to measure word similarity which eventually improves the effectiveness. Third, most text mining algorithms do not handle special characters adequately, as they have different meanings in regular text and log messages. For instance ‘../../etc/passwd’ is hard to process, as ‘.’ and ‘/’ are considered natural delimiters in written texts, but not in logs. Additionally, certain log sequences, e.g., paths ‘../../etc/passwd’ and ‘../../../etc/passwd’, have considerably different meaning, however look similar for text mining algorithms. Through applying deletions and insertions in the bio-representations, these properties are adequately handled by bioinformatics tools, and thus, distances
calculated accordingly. In the following, we describe how alignment algorithms from the domain of bioinformatics work for comparing two into Abio re-coded log lines and how bio-clustering tools can be used for grouping log data.
option (i) (ii) (iii)
5.1. Pairwise Log Line Comparison Sequence alignment algorithms, which are applied in step (iv), cf. Sect. 3 to compare two log lines form the base for most bio-clustering tools. Some examples for such algorithms are given in Sect. 2. Alignment algorithms use a scoring function d to calculate the distance between two B sequences. When comparing two sequences LA bio and Lbio element by element, there can occur three possible cases: B (1) mismatch: symbol sA j was replaced by symbol sj , (2) A B deletion: symbol sj was removed in Lbio , (3) insertion: B symbol sB j was inserted in Lbio . The alignment between two amino acid sequences is B always built under the assumption that LA bio and Lbio have common ancestors, i.e., they are homologous. This means in the end the alignment which refers to the highest similarity is chosen [16]. How similar two amino acid sequences are is specified by a similarity score. The predefined score for a match is usually constant. In most cases, the score for a mismatch depends on the probability that sA j can evolve to sB over time. These probabilities are based on empirical j statistics and represented in a 20 × 20 lower triangular matrix, which is called scoring matrix. The score for a gap caused by deletions or insertions is also predefined and can depend on the size of the gap, or if a gap is opened or just extended. The simplest definition for a scoring function d relies on unit costs. In the following, we apply this simple scoring system, which does not take into account that sA j could evolve to sB j by a specific probability: ( B 1 if sA A B j = sj , d(sj , sj ) = B −1, is sA j 6= sj , (5) d(sA j , −) = −1 deletion, d(−, sB j ) = −1
insertion.
When comparing two amino acid sequences, there are usually various options to build the alignment. In our model, since the sequences are considered as homologous, the alignment with the highest score is chosen, because a higher score suggests a higher similarity. Example 5.1 shows how the optimal alignment is chosen. Example 5.1. Given two amino acid sequences LA bio = GAC A B and LB = GC. We assume that L and L are homolobio bio bio gous. As scoring function serves d defined in Eq. (5). Table 3 summarizes the possible alignments. Here option (iii) would be the optimal alignment since it has the highest score. In the proposed model, the similarity, between the two amino acid sequences can be calculated as the ratio between the number of identical symbols in the alignment and the length of the alignment as shown in Eq. (6). Equation (6) is a normalized version of the inverted Lvenshtein distance
alignment
score
GAC GCGAC----GC GAC G-C
1 − 1 − 1 = −1 −1 − 1 − 1 − 1 − 1 = −5 1−1+1=1
Table 3. S CORES FOR E XAMPLE 5.1
[7], i.e., the identical symbols are calculated instead of the number of changes. In the case of Example 5.1, the similarity for option (iii) would be approximately 66, 66%. similarity =
B identicalSymbolsAlign(LA bio , Lbio ) B lengthOf Align(LA bio , Lbio )
(6)
5.2. Log Line Clustering Step (v), cf. Sect. 3, clustering log data is based on the previously defined alignment of two bio-encoded log lines. By re-coding a whole log data set and subsequent pairwise comparison of bio-encoded log lines through sequence alignment as shown before, distances can be determined by calculating the similarity of two sequences (cf. Eq. (6)). Clustering tools then try to cluster the bio-encoded sequences in a way so that the distances between any two cluster members ci ∈ C , cj ∈ C is lower than the distance to the next cluster center. This analysis can be performed with various existing bio-clustering tools, such as the prominent CD-HIT [11]. CD-HIT first applies an efficient and fast short word filter. If a sequence is considered as similar to the representative sequence of a cluster, the alignment and the exact similarity is calculated. Based on this, the algorithm decides if the sequence corresponds to the cluster or not. For further analysis of the clustering output, the sequences have to be re-translated into understandable text – step (vi). Therefore, the FASTA format provides the possibility to store the position of a log line in the original log file in the header of every sequence. Using this information, it is possible to look up the corresponding log line for each bio-encoded sequence in the input log file.
6. Outlier Detection The following section briefly deals with step (vii) – outlier detection for detecting anomalies. Outlier detection aims at identifying so-called point anomalies [3]. These outliers are clusters with just a few elements and/or usually a large distance to other clusters, which define the normal state of an network environment. In case of log data, outlier clusters include rare or atypically structured events (log entries). Those outliers are log entries, that require further investigations. Eventually, the previously defined model allows to apply high-performance bioinformatics tools on log data to cluster log lines. During the re-translation from Abio to AU T F −8 the clusters can be sorted by size to detect clusters of small size, which represent the outliers. Since it is also possible to generate a representative alignment for every cluster, i.e., to generate a multiple sequence alignment accounting for all
log lines assigned to one cluster, the function defined in Eq. (6) can be used to calculate the distance between all obtained clusters. Hence, it is possible to discover the clusters, with the largest distance to the group of clusters describing the typical system behavior of a network environment.
7. Evaluation The following section deals with the evaluation of the proposed approach for outlier detection in computer networks. The evaluation shows on the one hand the detection capability of our model and on the other hand evaluates the scalability of the approach.
7.1. Evaluation environment set-up and model configuration As test environment, we used a workstation with an Intel Xeon CPU E5-1620 v2 at 3.70GHz 8 cores and 16 GB memory, running Ubuntu 16.04 LTS operating system. During the evaluation, we compare two different methods for re-coding log data. Once we translate the log lines to ull Lfbio (translation without loss of information) and once we comprise the data by re-coding to Lbio (translation, which compresses the amount of data by just storing the second character with higher entropy, and therefore leads to a loss of information), as shown in Tab. 2. For clustering the re-coded log data CD-HIT [11] is used. We defined the scoring function as shown in Eq. (7). In this formulation, the gap symbolizes an insertion or deletion. ( B 6 if sA A B j = sj , d(sj , sj ) = A −5, is sj 6= sB j (7) dopen gap = −11 dextend gap = −1 Furthermore, we configured the algorithm, so that every log line is added to the cluster, where the representing element is the most similar one to the processed log line and not to the first cluster it matches. Moreover, the length of the shorter log line must have at least x% length of the longer compared log line, where x is the chosen similarity threshold, which specifies how similar two lines have to be to match the same cluster. Also the length of the calculated alignment must have at least the length of the shorter log line and at least x% of the longer log line. This ensures a sequence alignment as long as possible.
7.2. Testdata generation Our test environment consisted of virtual servers running on Apache Web server and the MANTIS Bug Tracker System2 on top, a MySQL database, a firewall and a reverse proxy. The log messages of these systems are aggregated using syslog. To evaluate the presented approach, we used 2
https://www.mantisbt.org/
log data from this system. For generating the data, we applied a slightly modified version of the approach presented in [17]. With this method it is possible to generate log files of any size/time interval for a given system by simulating user input in virtual machines. In our case, we created four user machines that exhibit a typical behavior on a bug tracker system, for example, logging in and out, submitting and editing bug reports. This allowed us to control the complexity of the scenarios, inject attacks at known points of time. With this method, highly realistic conditions can be achieved. Since the deployed environment is also used in similar settings by real companies for managing bugs in their software, the produced log data is representative. For evaluating the proposed approach, we generated 4 different log files. In order to simulate different levels of complexity, we implemented two configurations - configuration I (low complexity: the virtual users only click on the same three pages, in the same order) and configuration II (high complexity, see [17]). For generating the log files, the user activity was logged for 10 hours. The number of collected log lines mostly depends on the number of users and has been around 480k for one user and 1800k for 4 users.
7.3. Outlier detection 7.3.1. Detection Capability. Since the proposed approach has to be considered as work in progress and not all parts are fully implemented yet, we evaluated the detection capability in the context of a simple but catchy scenario. Therefore, we implemented an insider attacker who is an employee of an organization using the MANTIS bug tracker platform. The employee has valid credentials to log into the platform. Usually he accesses the database through an application hosted on the Web server, but because of a misconfiguration he found out, which port allows direct access to the database. Additionally, he uses a private device to get access to the database to steal data for unauthorized use. In our scenario, the employee wants to access one specific database entry, which he would not be authorized to access, when connecting to the database through the Web server. Therefore, when he connects to the database, a different IP address and a different MAC address, which only occurs once when accessing the database, are logged and can be detected as outlier. For simulating the scenario, we modified the log lines which are part of one logged data base access from the original log files and added it at a random location. For our proposed approach, the order of the log lines makes no difference, because they are sorted by their length, starting with the longest log line, before clustering. The log line, which includes the important information about the MAC address and the IP address is shown in List. 1. The modified MAC and IP address are chosen randomly. It also would be possible to detect this kind of attack with a common whitelist approach (i.e., explicitly specify the known good IP addresses and MAC addresses). However this simple, but catchy scenario allows us to show the sensitivity of our proposed approach and prove its detection
Jul 16 08:47:32 v3ls1316.d03.arc.local kernel: [757325.314310] iptables:ACCEPT-INFO IN=eth0 OUT= MAC=00:50:56:9c:25:67:**:**:**:**:**:** :08:00 SRC=***.***.***.*** DST=169.254.0.2 LEN=60 TOS=0x00 PREC=0x20 TTL =59 ID=36376 DF PROTO=TCP SPT=38947 DPT=80 SEQ=901703914 ACK=0 WINDOW =29200 RES=0x00 SYN URGP=0 OPT (020405B40402080A1D6066F20000000001030307)
Listing 1. Log line in which the MAC and IP address are logged during a data base access; the ‘*’ symbols mark the parts of the log line which are modified.
capability. Furthermore, the information gathered from this elementary test scenario serves as basis for more complex cases and more complex application possibilities such as time series analysis. To evaluate the detection capability of the model, we added the modified log lines to all the four log files mentioned before. In this evaluation, we defined clusters consisting of only one log line as outliers. To show the detection capability of the proposed model, we calculated two statistics. First, we calculated the absolute number of false positives F P . We defined every cluster consisting of only one log line and not including the modified version of the log line shown in List. 1 as F P . Second, we calculated the F P R, the ratio between the number of F P and the log file length. For the evaluation, we ran the proposed algorithm on the test data varying the similarity threshold, applied for comparing the log lines, between 85% and 99%, raising it by 1% every run. Table 6 shows the similarity threshold for both methods at which the outlier we searched for was detected first. The outlier was also detected for all higher similarity thresholds. Table 4 summarizes some of the results ull , which is a translation for re-coding the log data into Lfbio without loss of information, and Tab. 5 presents the results for re-coding the log data into Lbio , which is a translation that compresses the amount of data, but leads to a loss of information (cf. Tab. 2). Table 6 demonstrates that a lower threshold for outlier detection can be chosen, when re-coding the log data to Lbio . Furthermore, the lowest threshold at which the outlier is detected is independent from the number of users and the chosen complexity of the logged network environment. It only depends on the applied re-coding model. Moreover, Tab. 6 reveals that re-coding to Lbio is more sensitive for detecting outliers since the outlier is detected at a lower threshold. This can be explained by the fact that when reull coding to Lfbio every symbol is re-coded into two symbols of the canonical amino acids alphabet. For the first symbol, only at most 13 out of 20 letters are used (cf. Sect. 4). Hence, one of the first symbols occurs more often, than one of the second symbols. In contrast to the lowest threshold at which the outlier is detected, Tab. 4 and Tab. 5 show that the number of F P and also the F P R depend on the complexity of the logged network environment. The F P and F P R is higher for the more complex configuration. According to the results, the number of logged users only has a very low influence on the number of F P and the F P R. That was to be expected, because every user can carry out the same actions.
Furthermore, the tables show that the number of F P and ull the F P R for re-coding to Lfbio (cf. Tab 4) are a bit lower than for re-coding to Lbio (cf. 5). This can be explained in the same way, as in the previous paragraph due to the fact that the lowest threshold at which the outlier is detected is lower when recoding to Lbio . Furthermore in both cases, the F P and F P R start increasing much faster at a specific threshold, when re-coding to Lbio at 93% similarity and ull when re-coding to Lfbio at 96%. Using realistic similarity thresholds, especially the thresholds summarized in Tab. 6, the number of F P and the F P R are very low and the detected outliers can be easily investigated manually by a system administrator. 7.3.2. Model Scalability. To evaluate the scalability of our approach for detecting outliers, we generated log files of different lengths, i.e., line numbers, for the simplest configuration U 1C1 and the most complex configuration U 4C2. The length of the log files ranges from 100, 000 lines to 3, 000, 000 lines. We compared the run-time for ull (V1) and re-coding to Lbio (V2). As re-coding to Lfbio similarity threshold, we used the values obtained from the analysis of the lowest value at which the outlier was detected (cf. Tab. 6). Besides the total run time we calculated the time for re-coding, clustering and re-translating. The results demonstrated that the runtime of the model is increasing linearly. The total runtime is higher for the more complex ull configuration and also for the translation to Lfbio . Depending on the complexity of the data, in our test environment the algorithm is able to process between 1800 and 5000 log lines per second. The re-coding time only depends on the ull , since re-coding method and is longer for recoding to Lfbio more symbols are generated. The clustering time depends on the complexity of the analyzed system and on the re-coding method, i.e., on the length of the analyzed sequences. The re-translation time only depends on the length of the log file. The most time consuming part is the clustering.
8. Conclusion and Future Work This paper describes a novel model, which allows to apply high-performance bioinformatics tools in the context of anomaly detection on log data produced in computer networks. Since most of the bioinformatics tools operate on canonical amino acid sequences, we introduced two different methods to re-code log data coded in UTF-8 code, consisting of 255 symbols, to the alphabet of canonical amino acids, consisting of only 20 symbols. The first method describes a translation without loss of information, while the second method describes a translation, which compresses the data and therefore some information gets lost, but it allows faster anomaly detection. We further demonstrated how the recoded log data can be clustered applying bioinformatics algorithms and tools for generating sequence alignments. We furthermore explained how the output can be re-translated into a human-readable format using an ID number. Finally, we described and evaluated the outlier detection.
ull Table 4. F P AND F P R RESULTS , WHEN RECODING TO Lfbio
Threshold 0.91 0.95 0.96
F PU 1C1 24 45 2223
F P RU 1C1 4,96E-05 9,29E-05 4,59E-03
F PU 1C2 696 1659 5397
F P RU 1C2 1,68E-03 4,02E-03 1,31E-02
F PU 4C1 13 40 2973
F P RU 4C1 6,89E-06 2,12E-05 1,57E-03
F PU 4C2 1718 4955 11978
F P RU 4C2 1,07E-03 3,10E-03 7,49E-03
F PU 4C2 483 1878 3363 6030
F P RU 4C2 3,02E-04 1,17E-03 2,10E-03 3,77E-03
Table 5. F P AND F P R RESULTS , WHEN RECODING TO Lbio Threshold 0.86 0.88 0.92 0.93
F PU 1C1 15 22 48 523
F P RU 1C1 3,10E-05 4,54E-05 9,91E-05 1,08E-03
F PU 1C2 362 701 1160 2388
F P RU 1C2 8,76E-04 1,70E-03 2,81E-03 5,78E-03
Table 6. T HRESHOLDS AT WHICH THE OUTLIER IS DETECTED . Conf. U1C1 U1C2 U4C1 U4C2
ull Lfbio 0,91 0,91 0,92 0,92
Lbio 0,88 0,87 0,86 0,88
F PU 4C1 15 19 41 521
F P RU 4C1 7,95E-06 1,01E-05 2,17E-05 2,76E-04
at the Vienna University of Technology funded by the FFG project BAESE (852301).
References [1]
R. Vaarandi, “A data clustering algorithm for mining patterns from event logs,” in IPOM, Oct 2003, pp. 119–126.
[2]
J. T. L. Wang, M. J. Zaki, H. Toivonen, and D. Shasha, Data Mining in Bioinformatics. Springer Science & Business Media, Mar. 2006.
[3]
V. Chandola, A. Banerjee, and V. Kumar, “Anomaly detection: A survey,” ACM computing surveys (CSUR), vol. 41, no. 3, p. 15, 2009.
[4]
S. Axelsson, “Intrusion detection systems: A survey and taxonomy,” Technical report Chalmers University of Technology, Goteborg, Sweden, Tech. Rep., 2000.
[5]
V. J. Hodge and J. Austin, “A survey of outlier detection methodologies,” Artificial Intelligence Review, vol. 22, no. 2, 2004.
[6]
P. Berkhin, “A survey of clustering data mining techniques,” in Grouping multidimensional data. Springer, 2006, pp. 25–71.
[7]
V. I. Levenshtein, “Binary codes capable of correcting deletions, insertions, and reversals,” in Soviet physics doklady, vol. 10, 1966.
[8]
S. Henikoff and J. G. Henikoff, “Amino acid substitution matrices from protein blocks,” Proceedings of the National Academy of Sciences, vol. 89, no. 22, 1992.
[9]
S. B. Needleman and C. D. Wunsch, “A general method applicable to the search for similarities in the amino acid sequence of two proteins,” Journal of molecular biology, vol. 48, no. 3, pp. 443–453, 1970.
In opposite to most other approaches, which work with word matching algorithms, our model implements a character-based sequence comparison. This allows a much more sensitive anomaly detection (e.g., similar URLs with slight deviations are recognized as related). Since the bioinformatics tools are developed for many years they are optimized for high-performance and high data throughput to allow processing huge amounts of data in very short times. Furthermore, our approach does not have to know about syntax and semantics of the log data (i.e., no specific parsers are required to detect anomalous system behavior). Hence, it can be applied in any computer network, which logs events in text formats. This especially enables the application in legacy systems (e.g., in the Industrial Control Systems (ICS) domain, which are often not well documented, as well as in less mature systems with a small market share). In the future we plan to enable on-line anomaly detection. Therefore, after a training period the generated clustering should be freezed and log lines should be compared against the collected cluster representatives. We also plan to apply the approach for time series analysis to detect attacks and invaders. For this purpose, clustering models are created for different time periods. Then, the properties of the obtained clustering models can be compared (e.g., between two consecutive hours or days). Furthermore, we plan to focus on further development of the re-coding model described in Sect. 4 and the scoring system defined in Sect. 5.1. Therefore, we intend to modify the re-coding function, so that often re-occurring parts of log files (e.g., static texts) are translated into less symbols and therefore accept a higher loss of information for these parts; and less frequent parts, which include the more interesting variable parts (e.g., IP addresses, user names, port numbers) of log lines should be translated without loss of information.
[15] R. C. Edgar, “Search and clustering orders of magnitude faster than blast,” Bioinformatics, vol. 26, no. 19, pp. 2460–2461, 2010.
Acknowledgments
[16] D. W. Mount, Bioinformatics: Sequence and Genome Analysis. CSHL Press, 2004.
This work was partly funded by the FFG project synERGY (855457) and carried out in course of a PhD thesis
[17] F. Skopik, G. Settanni, R. Fiedler, and I. Friedberg, “Semi-synthetic data set generation for security software evaluation,” in Privacy, Security and Trust (PST). IEEE, 2014, pp. 156–163.
[10] T. F. Smith and M. S. Waterman, “Identification of common molecular subsequences,” Journal of molecular biology, vol. 147, no. 1, 1981. [11] W. Li, L. Jaroszewski, and A. Godzik, “Tolerating some redundancy significantly speeds up clustering of large protein databases,” Bioinformatics, vol. 18, no. 1, pp. 77–82, 2002. [12] M. Wurzenberger, F. Skopik, R. Fiedler, and W. Kastner, “Discovering insider threats from log data with high-performance bioinformatics tools,” in Proceedings of the 2016 International Workshop on Managing Insider Security Threats. ACM, 2016, pp. 109–112. [13] W. R. Pearson and D. J. Lipman, “Improved tools for biological sequence comparison,” National Academy of Sciences, vol. 85, 1988. [14] D. G. Higgins and P. M. Sharp, “Clustal: a package for performing multiple sequence alignment on a microcomputer,” Gene, vol. 73, no. 1, pp. 237–244, 1988.