Hounton and Newlands Cost Effectiveness and Resource Allocation 2012, 10:8 http://www.resource-allocation.com/content/10/1/8
METHODOLOGY
Open Access
Applying the net-benefit framework for assessing cost-effectiveness of interventions towards universal health coverage Sennen Hounton1* and David Newlands2
Abstract In assessing the cost-effectiveness of an intervention, the interpretation and handling of uncertainties of the traditional summary measure, the Incremental Cost Effectiveness Ratio (ICER), can be problematic. This is particularly the case with strategies towards universal health coverage in which the decision makers are typically concerned with coverage and equity issues. We explored the feasibility and relative advantages of the net-benefit framework (NBF) (compared to the more traditional Incremental Cost-Effectiveness Ratio, ICER) in presenting results of cost-effectiveness analysis of a community based health insurance (CBHI) scheme in Nouna, a rural district of Burkina Faso. Data were collected from April to December 2007 from Nouna’s longitudinal Demographic Surveillance System on utilization of health services, membership of the CBHI, covariates, and CBHI costs. The incremental cost of a 1 increase in utilization of health services by household members of the CBHI was 433,000 XOF ($1000 approximately). The incremental cost varies significantly by covariates. The probability of the CBHI achieving a 1% increase in utilization of health services, when the ceiling ratio is $1,000, is barely 30% for households in Nouna villages compared to 90% for households in Nouna town. Compared to the ICER, the NBF provides more useful information for policy making. Keywords: Cost-effectiveness analysis, Net-benefit framework, Universal health coverage
Background Economic evaluation in general, and cost-effectiveness analysis in particular is deemed by scholars, health administration and policy experts a centerpiece of the decision making process by balancing health gains against costs of interventions [1]. The results of cost effectiveness analysis provide a rationale to enhance the efficiency of resource allocation. Traditionally, the use of cost effectiveness analysis as a tool to inform and guide resources allocation has revolved around the Incremental Cost Effectiveness Ratio (ICER), which indicates the additional amount of money needed to obtain an extra unit of health gain or to prevent an adverse event compared to alternatives. However, apart from few situations with a clearly dominant intervention (less effective and more costly or more effective and less costly) compared * Correspondence:
[email protected] 1 Department of Epidemiology, Centre MURAZ, 2054 Avenue Mamadou KONATE, Bobo-Dioulasso 01 BP 390, Burkina Faso Full list of author information is available at the end of the article
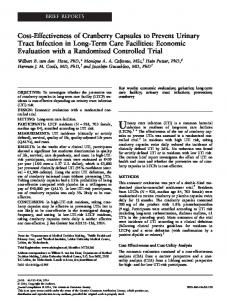
to alternatives, most interventions will present a situation in which there is a need of a threshold value, a ceiling that the decision maker is willing to pay as a good value for money (Figure 1). New interventions in clinical medicine are likely to be more effective and more costly because breakthroughs in medical procedures and new technologies are typically more expensive than existing practices. In these cases, not only is there a need to estimate the maximum a provider (society, or the health system for example) is willing to pay for an additional unit of health gain, but it is also difficult to reliably build confidence intervals around the ICER estimates for inferential analysis. The value of the maximum a provider is willing to pay for an additional unit of health gain is often estimated through extensive willingness to pay surveys and is not always available to the analysts. The use of the net-benefit framework, a recently developed approach and mostly applied in pharmacoeconomics and clinical interventions [2,3], presents the potential to overcome the current limitations
© 2012 Hounton and Newlands; licensee BioMed Central Ltd. This is an Open Access article distributed under the terms of the Creative Commons Attribution License (http://creativecommons.org/licenses/by/2.0), which permits unrestricted use, distribution, and reproduction in any medium, provided the original work is properly cited.
Hounton and Newlands Cost Effectiveness and Resource Allocation 2012, 10:8 http://www.resource-allocation.com/content/10/1/8
Page 2 of 11
Figure 1 Cost-effectiveness plane.
of handling of uncertainties and reliance on the maximum value a provider is willing to pay to achieve an extra unit in health gain for the decision rule in public health [4-8]. The aim of this study was to assess the feasibility and relative advantages of the net-benefit framework in assessing the cost-effectiveness of an intervention towards universal health coverage compared to the traditional ICER approach.
Methods Context and participants
The Nouna health district, also referred to as Kossi province, is a rural health district situated in the North West of Burkina Faso. The area is characterized by dry weather with a mean annual rainfall of about 800 mm resulting in dry savannah vegetation. In the early 1990s, a Demographic Surveillance System (DSS) was established by the Nouna Health Research Centre. The original DSS area covered 39 villages (~population about 26 000 inhabitants) and has been progressively extended to cover 58 villages and Nouna town, with a population of about 72 000 people. The density of population was about 35 individuals per square km. The population is distributed in roughly 9,500 households and composed of 65% rural dwellers and 35% Nouna semi-urban dwellers. The population is essentially young with children less than 15 years of age representing about 48% of the total population, and only 6.2% above 60 years of age. The inhabitants are mostly subsistence farmers and/or cattle keepers, and illiteracy is extremely high, over 80% (Figure 2).
The interventions
The Nouna community based health insurance scheme (CBHI) was launched in 2004 and was developed by the Nouna Health Research Centre as an operational research project to study how to improve community access and uptake of health services and how to meet the need of the poor within Nouna health district. The intervention has been extensively described in the literature [9-13]. It is a voluntary community health insurance scheme which aims to reduce financial barriers (out-ofpocket payments) and improve quality of care, thus improving access and uptake of health care. The alternative
80% confidence intervals
Figure 2 Cost-effectiveness acceptability curves, Nouna CBHI, Burkina Faso. * Please note on X-axis actual values correspond to displayed values * 1000.
Hounton and Newlands Cost Effectiveness and Resource Allocation 2012, 10:8 http://www.resource-allocation.com/content/10/1/8
intervention will be the status quo (no enrolment in the CBHI). Data collection and analysis
Data were extracted from the longitudinal Nouna demographic and surveillance site on membership of the Nouna CBHI, utilization of health services, the average distance from village to health centre, assets ownership, age and education level of the head of household. In order to generate household-level costs of the CBHI scheme from a societal perspective we added, for every household member of the scheme, the household costs (enrolment fees and premium) to the average cost of enrolling in the Nouna CBHI scheme from the health system perspective. The latter was obtained by dividing the 2007 annual costs of running the Nouna CBHI scheme by the number of households, members (370) in 2007. For households which are not members of the scheme, there is obviously no cost incurred for membership fees. However, these households have to meet the cost of the utilization of health services out of pocket. We use the estimated cost of the benefit package of the Nouna CBHI which was 9630 West Africa francs (XOF), equivalent to approximately $20) in 2004 [12]. We computed ICER for extra additional utilization of health services, and cost effectiveness acceptability curves (CEAC) to illustrate the decision rule of cost effectiveness of the intervention. The ICER decision rule is that if the estimated ICER lies below the ceiling ratio, which represents the maximum decision makers are willing to pay for an incremental unit of the measure of effectiveness, then the intervention concerned is deemed cost-effective. By varying the ceiling ratio, the varying probability that the intervention is cost-effective can be identified. The CEAC shows the probability of the intervention being cost-effective for all potential values of the ceiling ratio. Unlike the ICER approach, the CEAC can also be employed to obtain a confidence interval of cost-effectiveness. It also avoids the problems of interpretation of a negative ICER [14,15]. There isa straightforward graphical representation and interpretation that a new treatment is not cost effective [7]. In this paper, the likelihood values that the Nouna CBHI is cost-effective compared to the status quo were obtained using the p-values on the Nouna CBHI dummy when running an Ordinary Least Square (OLS) regression. The p-values are 2-sided p-values; however only one-sided probability is needed to test whether the incremental net-benefit is positive (Nouna CBHI is preferred) or negative (the status quo is preferred). The one–sided p-values were thus obtained by dividing the 2-sided p-values by 2. For negative incremental net-benefits the probabilities that Nouna CBHI is preferred equals the one sided p-values, and
Page 3 of 11
for positive incremental net-benefits, the probabilities that the Nouna CBHI is preferred equals 1 minus the one sided p-values (Hoch JS et al, 2006). A major strength of this technique when it comes to resource allocation is that for a given budget, one can model the different probabilities that the Nouna CBHI is preferred to the status quo. However, whilst this technique could be sufficient in clinical care decisions about the choice of preferred medication, technology, or screening exam, in the public health field, a decision maker is often concerned about issues beyond the optimality of one intervention over another, especially with issues of equity. This is where the net-benefit framework could potentially be very useful in assessing the effect of significant determinants on the marginal cost-effectiveness of a universal health coverage intervention such as the Nouna community based health insurance. Given access to health care is influenced by major determinants (such as the distance to health facilities, education, or assets ownership), a net-benefit framework, applied to the cost effectiveness of the Nouna CBHI, could be effective through the joint probability distribution in identifying the most important determinants that affect the cost-effectiveness results. The netbenefit framework employs linear regression techniques, and to date, has been most often used alongside clinical trials of health care regimens or technology devices [25]. Thus, it has the potential even for observational studies with patient-level effect and cost data, for the better presentation and interpretation of cost-effectiveness results and better evidence based decision making. The traditional equation ΔC/ΔE (ICER) can be rearranged by multiplying each arm of the equation by ΔE. The result is ΔC = ΔE * ICER and for any ceiling ratio Ro, ΔC = ΔE * Ro. Thus, a net-benefit statistic can be computed as follows: ΔE * Ro − ΔC = ΔNB. We computed for each observation (household) in the household survey an individual net-benefit statistic. The expression of an individual net-benefit NBi = ΔEi * Ro − ΔCi is similar to a traditional linear regression equation Y = α + δXi + εi where Y is the dependent variable, α is the intercept, δ the coefficient on an explanatory variable (continuous variable or dummy variable taking the value 1 for a positive outcome and 0 for a negative outcome for example) and εi is the standard error. Thus, for the Nouna community based health insurance scheme, the household net-benefit could be modeled as NBi = α + δCBHIi + εi where NBi is the net-benefit for each subject (or household), α is the intercept, CBHIi, is the intervention (taking the value zero if a household is not a member of the scheme and 1 for a member), δti, is the incremental net benefit and εi is the standard error. The interpretation is straightforward and when this difference is greater than
Hounton and Newlands Cost Effectiveness and Resource Allocation 2012, 10:8 http://www.resource-allocation.com/content/10/1/8
zero, it means that the incremental cost for one additional unit of effectiveness (in this case utilization of health services) is below the Ro (the maximum the provider is willing to pay). The CBHI will be deemed costeffective in relation to the status quo. Similarly, if the coefficient is negative, then the incremental cost for one additional unit of effectiveness is above the Ro and the status quo will be deemed cost-effective. The basic model above (NBi = α + δCBHIi + εi) could then be expanded to include important covariates and thereby allow the examination of the marginal impact of these covariates on incremental cost effectiveness. The PP final model may look like: NB = α + β x + δt i j=1 j ij i+ PP j=1 ýj xij + Ei where NBi is the summation of the interaction between the treatment dummy (Community Based Health Insurance for example, coded yes or no) and the covariates. ý’s magnitude and significance indicates how the cost effectiveness of CBHI is expected to vary at the margin. Thus the use of the net-benefit model for presenting and interpreting cost-effectiveness analysis results has the potential to overcome the double dilemma of not being able to access progress using outcomes measures (for example, computing maternal or perinatal mortality) and not being able to reliably assess cost-effectiveness using incremental cost-effectiveness ratios. As indicated in the background section, cost effectiveness analysis traditionally relies on use of an incremental cost effectiveness ratio (ICER) to indicate, among a set of alternative strategies, which is the most cost effective. Not only does the ICER as a ratio not indicate what to do, how to do it or where to do it, the decision rule is not straightforward when there is no clear dominance of one alternative over another [2,6,14]. Moreover, there are very few situations in which decision makers decide to solely go with one strategy over another. Rather, they are more likely to allocate resources across a range of complementary strategies for maximum health gains and thus the net-benefit framework offers an advantage over the traditional ICER approach in presenting and interpreting results for public health interventions (Table 1). Ethical consideration
The study was approved by the ethical review board of Nouna Health Research Centre.
Results Descriptive analysis of the study populations
Table 2 describes the characteristics of the households included in the Nouna panel household survey by enrolment status in the Nouna CBHI scheme and by the selected covariates (education, place, perceived quality of care, asset ownership). The two groups are comparable with respect to mean age of head of household (49.6 for
Page 4 of 11
non-members versus 50.8 for households members, ttest p = 0.148). There were significant differentials in enrolment in the Nouna CBHI scheme by utilization of health services and by covariates. There was a 14 percentage point difference (85.4 - 71.4) in the utilization of health services between members and non-members. Similarly there were 20.6 (59.3 – 38.7), 23.1 (63.2 – 40.1), and 18.7 (34.3 – 15.6) percentage point differences between members and non-members for people with at least primary level of education, people living in Nouna town, and assets ownership, respectively. Standard cost-effectiveness analysis
In Table 3, the Incremental Cost Effectiveness Ratio (ICER) was obtained by dividing the difference in average cost between the intervention and comparison groups (70.253 – 9630) by the difference in average effect (utilization of health services) between the intervention and comparison groups (0.85 – 0.71). The result is equal to 433,000 XOF (approximately $1000) and is interpreted as the overall incremental in cost for achieving one additional increase in household’s utilization of health services (unit of effectiveness) for households members in the community based insurance scheme compared to household non-members. At this point the Nouna CBHI scheme appears to be more costly and more effective. The ICER estimates vary significantly by covariates. For example, the incremental cost for one extra institutional delivery within Nouna villages was 530,600 XOF (approximately $1250) compared to 301,700 XOF (approximately $700) in Nouna town. The stratified ICER results (only place of residence reported in this paper) confirm the existence of important subgroups and prompt interest in assessing how these covariates affect the overall cost-effectiveness of the intervention. Applying the net-benefit regression approach
Table 3 presents the results of the overall economic evaluation with a range of arbitrary ceiling ratios (arbitrary but selected around the sample ICER). We use place of residence (Nouna town versus Nouna villages) as examples of covariates and present net-benefits estimates for different values of the ceiling ratio (Ro) including zero. The coefficients were obtained from an Ordinary Least Squares (OLS) regression as explained above and correspond to the increment net-benefit. The aim of this analysis and the results displayed in this table is to demonstrate that the standard descriptive analysis for computing an Incremental Cost-Effectiveness Ratio (ICER) is equivalent to the net-benefit framework, as the linearization of the equation ICER = λ. One can verify that when λ is = 0, the increment net-benefit (nb2 nb1) = λ*(Average effect1 – Average effect1) – (Average
Hounton and Newlands Cost Effectiveness and Resource Allocation 2012, 10:8 http://www.resource-allocation.com/content/10/1/8
Page 5 of 11
Table 1 Relative advantages of net-benefit framework and incremental cost-effectiveness ratio for presenting and interpreting results of cost-effectiveness analysis Relative advantage criteria
Standard Incremental Cost Effectiveness Ratio (ICER)
Net Benefit Framework
Type of analysis
Descriptive analysis, and stratified analysis (by important covariates)
Regression analysis, and joint probability distribution with important covariates
Confidence interval
No
Yes
Requirement of contextually relevant threshold (ceiling ratio)
Yes, to assess if intervention is good value for money
No, hypothetical ceiling ratios can be plotted and probabilities of cost effectiveness calculated
Adjustment to covariates (important sub groups)
No
Yes
Variability explained by covariates
No
Yes
Relative advantages for interpretation
Simple point estimate, greater or lower than a ceiling ratio
Graphical presentation; illustration of alternative scenarios with different ceiling ratios
cost2 - Average cost1) = 0*(85 – 71) – (70253 – 9630) = − 60623. For example, when the ceiling value is 700,000 XOF (equivalent to $1600) for example, the coefficients obtained from the OLS regression for the overall sample, populations in Nouna town, and populations in Nouna villages are 37664 XOF, 77075 XOF, and 20354 XOF respectively. It can be verified manually that these numbers correspond (apart from rounding errors) to what would have been obtained by the equation (nb) = λ* (effect) – (cost), where (nb) is the average net-benefit, 700,000 the ceiling ratio (λ), (effect) is the mean effect and (cost) is the mean cost. Table 2 Descriptive characteristics of populations by enrolment status (from household survey, 1504 household, 2007) Characteristics
Members
Not members
N (%)
N (%)
Use of health services
0.000
- Did not use
53 (14.6)
281 (28.6)
- Have used
310 (85.4)
700 (71.4)
- None
148 (40.7)
602 (61.3)
- At least primary school level
216 (59.3)
380 (38.7)
Education
0.000
Place
0.000
- Nouna town
230 (63.2)
394 (40.1)
- Nouna villages
134 (36.8)
588 (59.9)
3 (0.8)
235 (23.9)
Asset ownership - Most poor
P-value
0.000
- Second quartile
35 (9.6)
235 (23.9)
- Third quintile
85 (23.4)
198 (20.2)
- Fourth quintile
116 (31.9)
161 (16.4)
- Least poor
125 (34.3)
153 (15.6)
P-values are the level of significance on the Pearson chi-square test between enrolment and covariates. There is no difference by age or sex between members and not members.
Table 4 presents the variations of the incremental net benefit of the intervention with different ceiling ratios and the probability of cost-effectiveness of Nouna CBHI with different ceiling ratios. The probabilities that the CBHI is cost-effective were computed and used to construct the cost-effectiveness acceptability curve (Figure 2). Cost effectiveness acceptability curves
The cost-effectiveness acceptability curve graphically represents the levels of certainty around the costeffectiveness analysis ratio of two interventions by plotting hypothetical estimates of ceiling ratios against the probability that a new intervention (the Nouna CBHI scheme in our case) is preferred over an existing intervention (the status quo). As can be seen on Figure 2 if the decision makers in Nouna are only prepared to pay a ceiling ratio less than 400,000 XOF ($920) the probability that the Nouna CBHI scheme is preferred or deemed cost effective is small less than 30%. However, if decision makers in Nouna are willing to pay a ceiling ratio more than 700,000 XOF ($1600) the probability that the Nouna CBHI scheme is preferred or deemed cost effective increases to above 99% (asymptotic and close to but never reaching 100%). The same calculations and graphical representations performed for the Nouna CBHI (Tables 4–5, Figure 2) could be computed for subgroups of the sample by important covariates such as place of residence (dummy variable coded 0 for Nouna villages and 1 for Nouna town) or education (dummy variable coded 0 for no education and 1 for some education). The results are presented in Table 6 and Figures 3. Overall, lower ceiling ratios are needed to achieve a given probabilities that the Nouna CBHI is cost-effective in Nouna town versus Nouna villages. In the communities of Nouna villages, the probability that the Nouna CBHI scheme is costeffective is close to zero when the decision makers in Nouna are only prepared to pay less than 300,000 XOF
Hounton and Newlands Cost Effectiveness and Resource Allocation 2012, 10:8 http://www.resource-allocation.com/content/10/1/8
Page 6 of 11
Table 3 Sample statistics from the economic evaluation of the Nouna CBHI, data with net-benefit, household survey, 2007, Nouna districts Burkina Faso Group variables
Mean
SD
SE
Cost
9630
0.000
0.000
Effect (%)
71
0.452
0.014
Cost
70253
11658
611
Effect (%)
85
0.125
0.019
Cost difference*
60623
-
372
Effect difference (%)
14
Sample ICER
4330
Overall analysis Comparison group (Not members N = 982 )
Intervention group (Members N = 364)
Increments
Place of residence Nouna villages group Cost difference
64207
-
545
(%) Effect difference
12.1
-
0.039
Sample ICER
5306
Nouna town group Cost difference
58535.5
-
507
(%) Effect difference
19.4
-
0.036
Sample ICER
3017
Incremental net-benefit
Coefficient (SE)
Values of ceiling ratio (R)
Overall
Nouna town
Nouna villages
R=0
- 60623 (193)
- 58535.5 (507)
- 64207 (545)
R = 500 000
9577 (13143)
38324 (18335)
- 3806 (19683)
R = 700 000 R = 1 000 000
28034 (18400)
77075 (25667)
20354 (27543)
70165 (26286)
135203 (36692)
56594 (39335)
ICER = Cost of having one additional% of utilization of health service among members. * Equal variance not assumed. The costs are in CFA, West Africa French currency.
($690) for one extra use of health services and only approaches 100% above a ceiling ratio of 1,500,000 XOF ($3460. However, in Nouna town the probability that the Nouna CBHI scheme is cost-effective is nearly 50% at the ceiling ratio of 300,000 ($690) for one extra use of health services and approaches 100% at a ceiling ratio about 500,000 XOF ($1150). We could then assess, as for any regression analysis, the effect of covariates on the cost-effectiveness, the interaction between covariates, any collinearity or residuals. The full results are not presented here as the goal is primarily to demonstrate the applicability of the netbenefit framework to observational public health studies rather than the robustness of the results or any model. We present in Table 7 and on Figure 4 covariates
adjusted net-benefit regression estimates with different ceiling ratios, adjusted (to place of residence) and unadjusted cost-effectiveness acceptability curves of the Nouna CBHI respectively. It can be observed in Figure 4 that when adjusted to place (Nouna town versus Nouna villages), the ceiling ratio that corresponds to a 50% probability that the intervention is cost-effective (ICER) is significantly lower than the ICER computed. This is critically important and indicates the importance of adjusting the cost-effectiveness results to known significant covariates. Also, the probability that the Nouna CBHI scheme is cost-effective is higher at any ceiling ratio lower than or equals to 800,000 XOF ($1850) when the net-benefits are adjusted to place of residence (Nouna town versus Nouna villages). This result
Hounton and Newlands Cost Effectiveness and Resource Allocation 2012, 10:8 http://www.resource-allocation.com/content/10/1/8
Page 7 of 11
Table 4 Simple net-benefit regression estimates with different ceiling ratios, Nouna community based health insurance, household survey, 2007, Burkina Faso N = 1344 Explanatory
NMB With
NMB With
NMB With
NMB With
NMB With
NMB With
λ =0a
λ =500000
λ =700000
λ =1000000
λ =1500000
λ =2000000
[SE] (p-value)
[SE] (p-value)
[SE] (p-value)
[SE] (p-value)
[SE] (p-value)
[SE] (p-value)
9630
347148
489860
703927
1060706
1417485
[193] (1.000)
[6830] (0.000)
[9562] (0.000)
[13660] (0.000)
[193] (0.000)
Variables Constant term
[193] (0.000) 220232
Intervention strategy (CBHI)
- 60623
9577
37664
79795
150013
[372] (0.000)
[13143] (0.466)
[18400] (0.041)
[26286] (0.002)
[372] (0.000)
[372] (0.000)
R2 (adjusted)
0.952
0.000
0.003
0.007
0.011
0.013
F (1, 1344)
26587
0.531
4.2
9.2
14.4
17.5
Prob > F
< 0.000
< 0.000
< 0.000
< 0.000
< 0.000
< 0.000
a
When λ =0, NMB = − Cost. The values of λ = are in CFA, West Africa French currency.
context specific threshold (ceiling ratio) to indicate if the $1,000 was a good value for money for achieving one households’ extra utilization of health services. This estimate provides no clue for what to do, how to do it or where to do it if one is concerned with equity issues in universal health coverage. What could be more helpful is to have some insights in how the costeffectiveness vary by some equity determinants (for example covering Nouna villages or Nouna town, or design the intervention by groups of households’ assets ownership) which will be the basis for policy making. By applying the net-benefit framework, we were able to conclude that the probability (adjusting for place) of the Nouna community based health insurance to achieve one extra utilization of health services when the ceiling ratio is approximately $1,000 is barely 30% for Nouna villages whilst the corresponding probability
demonstrates that the probability that the intervention is cost-effective is very high in Nouna town compared to Nouna villages if decision makers in Nouna are willing to pay a ceiling ratio lower than 800,000 XOF ($1850). This important result is more informative than the stratified analysis of the ICER and would not have been possible without a joint probability distribution of the intervention effects and covariates, hence the importance of the net-benefit approach in identifying the effects of important covariates on the cost-effectiveness results.
Discussion With the traditional ICER, we concluded that approximately $1000 was the incremental in cost for achieving one additional increase in utilization of health services in the intervention area. However, there was no
Table 5 Cost-effectiveness acceptability curves from the net-benefit regression, Nouna CBHI, household survey, 2007, Burkina Faso Values of ceiling ratio
Treatment (intervention) coefficients
One sided p-value
Probability of cost-effectiveness (OLS regression)
0
0
0
- 4466
0.671
0.335
33.5
9577
0.466
0.233
76.7
600 000
23620
0.134
0.067
93.3
700 000
37664
0.041
0.020
98
800 000
51708
0.014
0.007
99.3
900 000
65751
0.006
0.003
99.7
1 000 000
79795
0.002
0.001
99.9
1 500 000
150013
< 0.000
< 0.000
< 100
2 000 000
220232
< 0.000
< 0.000
< 100
2 500 000
290450
< 0.000
< 0.000
< 100
Estimates
P-values
0
- 60623
400 000 500 000
The values of ceiling ratio are in CFA, West Africa French currency.
%
Hounton and Newlands Cost Effectiveness and Resource Allocation 2012, 10:8 http://www.resource-allocation.com/content/10/1/8
Page 8 of 11
Table 6 Cost-effectiveness acceptability curves, net-benefit OLS regression, Nouna CBHI (Place covariate) Nouna Town Values of ceiling ratio
Nouna villages Treatment (intervention) coefficients
One sided p-value
Probability of cost-effectiveness
Treatment (intervention) coefficients
One sided p-value
Probability of cost-effectiveness
Estimates
P-values
%
Estimates
P-values
- 58535
0
0
0
- 64207
0
0
0
200 000
−19803
0.007
0.003
0.3
- 40046
0
0
0
300 000
- 427
0.969
0.484
48.4
- 27966
0.018
0.009
0.9
400 000
18948
0.197
0.098
90.2
- 15886
0.314
0.157
15.7
500 000
38324
0.037
0.018
98.2
−3806
0.847
0.423
42.3
600 000
57700
0.009
0.004
99.6
8274
0.726
0.363
63.7
700 000
77075
0.003
0.001
99.9
20353
0.460
0.230
77
800 000
96451
0.001
0.000
99.99
32434
0.303
0.151
84.9
900 000
115827
0.000
0.000
99.99
44514
0.209
0.104
89.6
1 000 000
135203
0.000
0.000
99.99
56594
0.151
0.075
92.5
1 500 000
232081
0.000
0.000
99.99
116995
0.048
0.024
97.6
2 000 000
328960
0.000
0.000
99.99
177395
0.024
0.012
98.8
2 500 000
425840
0.000
0.000
99.99
237796
0.016
0.008
99.2
0
%
The values of ceiling ratio are in CFA, West Africa French currency.
for households living in Nouna town is over 90%. This piece of information has important implication for policy making if decision makers are concerned with achieving high probability of cost-effectiveness of the intervention in the poorest population (Nouna villages) and would not have been possible just by using stratified analysis on the traditional ICER approach. As pointed by Hosh JS [3] the existence of important sub-groups affects how the cost-effectiveness varies at the margin and need to be accounted for when analyzing and interpreting cost-effectiveness results. This is the case with universal health coverage.
Identifying what intervention is cost-effective compared to an alternative is an important piece of information, and we have now seen that even if one does not know the true value of the ceiling ratio, using a costeffectiveness acceptability curve (Figure 2) it is possible to show the level of uncertainty surrounding the estimated ICER. Computing the ICER point estimate (assuming we know the context specific ceiling ratio to rule if a good value for money) does not provide clues about what policy makers could do, how to do it or where to do it when there are important subgroups. Although it is possible to use modeling such as bootstrap method with
Probability that Nouna CBHI is cost-effective
120
100
80
60
40 No una CBHI o verall
20
No una town No una villages
0 0
200
300
400
500
600
700
800
900 1000 1500 2000 2500
Ceiling ratio values*
Figure 3 Unadjusted cost-effectiveness acceptability curves, Nouna CBHI overall and with covariate place, Burkina Faso. * Please note on X-axis actual values correspond to displayed values * 1000.
Hounton and Newlands Cost Effectiveness and Resource Allocation 2012, 10:8 http://www.resource-allocation.com/content/10/1/8
Page 9 of 11
Table 7 Simple net-benefit regression estimates with different ceiling ratios, and covariates adjusted net-benefit regression estimates, Nouna community based health insurance, household survey, 2007, Burkina Faso N = 1344 Explanatory
NMB With
NMB With
NMB With
NMB With
NMB With
NMB With
λ =0a
λ =500000
λ =700000
λ =1000000
λ =1500000
λ =2000000
[SE] (p-value)
[SE] (p-value)
[SE] (p-value)
[SE] (p-value)
[SE] (p-value)
[SE] (p-value)
−8595
317202
447519
642993
968784
1294575
[394] (0.000)
[14159] (0.000)
[19820] (0.000)
[28311] (0.00)
[42466] (0.000)
[56620] (0.000)
Variables Constant term
Covariates Education
Place of residence
Asset ownership
Intervention (CBHI)
1700
44652
61835
87609
130565
173522
[335] (0.000)
[12017] (0.000)
[16821] (0.000)
[24028] (0.000)
[36040] (0.000)
[48053] (0.000)
2255
- 67742
- 95741
- 137739
- 207735
−277731
[358] (0.000)
[12864] (0.000)
[18007] (0.000)
[25772] (0.000)
[38582] (0.000)
[51443] (0.000)
- 942
14455
20614
29853
45252
60651
[136] (0.000)
[4879] (0.003)
[6830] (0.003)
[9756] (0.002)
[14633] (0.002)
[19511] (0.002)
- 60425
- 10044
23594
59608
119630
179652
[390] (0.000)
[13995] (0.473)
[19990] (0.229)
[27983] (0.033)
[41973] (0.004)
[55963] (0.001)
0.955
0.031
0.034
0.037
0.041
0.043
R2 (adjusted) F (4 1343) Prob > F a
7077
10.6
11.6
12.9
14.4
15.2
0.000
0.000
0.000
0.000
0.000
0.000
When λ =0, NMB = − Cost. The values of ceiling ratio are in CFA, West Africa French currency.
appropriate weighting [16] to assess how the covariates affect the cost-effectiveness at the margin, modeling will rely on data from secondary sources, instead of actual household level effect and cost data. If the decision makers are concerned with meeting the needs of the poorest and equity [9,17,18] we argue we need a joint probability distribution of context specific data on cost and effect and the intervention with
important determinants of poverty so that policy making be based on the most important determinants (adjusting to known covariates). For example, when examining the net-benefit regression results (Table 7) it can be noted that only a small fraction (3.4%) of the variability in cost-effectiveness can be explained by covariates used in the analysis. This is very small and points to the existence of unknown important variables not captured in
Figure 4 Adjusted (to place of residence) and unadjusted cost-effectiveness acceptability curves, Nouna CBHI, 2007, Burkina Faso. * Please note on X-axis actual values correspond to displayed values * 1000.
Hounton and Newlands Cost Effectiveness and Resource Allocation 2012, 10:8 http://www.resource-allocation.com/content/10/1/8
our analysis or the low content validity of our constructed metrics. In any case, this type of information is very useful for appraising the likelihood of covariates to affect the cost-effectiveness of the intervention. Although decision making does not revolve around costeffectiveness analysis results, this type of information may be very useful for policy making and is not possible to have with the more traditional ICER approach. This is the main potential of the net-benefit framework when applying to public health interventions such as universal health coverage. Lastly, while the main concern of this paper is with methodological challenges, the high values of the ceiling ratios that we found for the CHBI scheme to be costeffective are of interest. Together with other evidence, such as the lack of any significant reduction in mortality rates, the low enrolment rates [9,10], and the high costs of the scheme [12] cast great doubt upon its costeffectiveness. Our findings thus challenge the currently fashionable assumption that community based health insurance schemes are a very promising way to extend access to health care in low and middle income countries. From a methodological point of view, the net –benefit approach opens up the possibility of a marriage of epidemiological, demographic and econometric analytical frameworks in appraising the monetary values of public health interventions. Its application requires the availability of person-level or household-level effect and cost data collection, which in turn will require change to current well established tools and methods of national or sub national household surveys. Although this work was focused on using some of the properties of regression techniques for utilization of health services, there is a possibility, with increasing emphasis on valuing health outcomes in the developing world, to actually use the full potential of regression frameworks and predict for example the net-gains of interventions in saving the lives of women and newborns.. Given this paper is mainly to demonstrate feasibility and applicability of the netbenefit approach and data implications we did not extend on other model diagnosis tests such as normality of residuals.
Conclusions There are some challenges in interpreting the traditional ICER results. Regardless of the accuracy of the costing methodology, there remain issues about the level of certainty of the computed estimate. The decision rule of the ICER estimate requires knowledge as to whether the estimate is below or above an externally set value which is the maximum decision makers will be willing to pay for an extra unit of health gain. This value is unknown in most cases but in these circumstances, the net-benefit
Page 10 of 11
approach has proven feasible and more insightful in assessing cost-effectiveness of a public health intervention aiming at universal health coverage. The net-benefit approach has the relative advantages of better presentation and interpretation of cost-effectiveness analysis results. The most important advantage in our view is the possible information on the marginal cost-effectiveness of important covariates particularly when decision makers are concerned with important determinants or equity as is often the case in public health interventions. However, its applicability requires appropriate data sets (household-level effect and cost data) which will require that we revise the traditional methods and tools of household surveys to ensure concurrent collection of household-level effect and cost data. Competing interests The authors declare that they have no competing interests Authors’ contribution SH conceived the study (as part of his doctoral thesis), led the data collection, constructed the database, performed the statistical analysis and drafted the manuscript. David Newlands participated in the design of the study, data collection and data analysis. All authors read and approved the final manuscript. Authors’ information Sennen Hounton is a medical epidemiologist with expertise in maternal and newborn health, health systems and economic evaluation. Sennen Hounton has an MD (Benin), MPH in Epidemiology (University of Oklahoma, USA) and a PhD in Public Health from University of Aberdeen, (Scotland, UK). He was a Senior Research Fellow with Immpact (Initiative for Maternal Mortality Program Assessment). He is currently Maternal Health Technical Adviser at the United Nations Population Fund (New–York), and served as Scientific and Technical Advisor on the WHO Alliance for Health Policy and System Research Scientific and Technical Advisory Committee. David Newlands is a Senior Lecturer in Economics, previously Team Leader of the Economic Outcomes of an international research programme – Immpact. He is currently a Senior Lecturer at the Business School of University of Aberdeen, Scotland, UK. Acknowledgements This work was undertaken as part of Dr Sennen Hounton’s doctoral programme, funded by the international research programme – Immpact, University of Aberdeen. A special thanks to Wendy J Graham, Nicolas Meda, Peter Byass, and Bocar Kouyate. The funders have no responsibility for the information provided or views expressed in this paper. The views expressed herein are solely those of the authors. Author details 1 Department of Epidemiology, Centre MURAZ, 2054 Avenue Mamadou KONATE, Bobo-Dioulasso 01 BP 390, Burkina Faso. 2Business School, University of Aberdeen, Edward Wright Building, Dunbar Street, Old Aberdeen AB24 3QY, Scotland, United Kingdom. Received: 22 December 2011 Accepted: 28 June 2012 Published: 16 July 2012 References 1. Drummond MF, Sclpher MJ, Torrance GW, O’Brien BJ, Stoddart GL: Methods for the economic evaluation of health care programmes. New-York: Oxford University Press; 2005. 2. Hoch JS, Briggs AH, William AR: Something old, something new, something borrowed, something blue: a framework for the marriage of health econometrics and cost-effectiveness analysis. Health Econ 2002, 11:415–430.
Hounton and Newlands Cost Effectiveness and Resource Allocation 2012, 10:8 http://www.resource-allocation.com/content/10/1/8
3.
4.
5. 6.
7. 8.
9.
10.
11.
12.
13. 14. 15. 16.
17.
18.
Page 11 of 11
Hoch JS, Rockx MA, Krahn AD: Using net-benefit regression framework to construct cost-effectiveness acceptability curves: an example using data from a trial of external loop recorders versus Holter monitoring for ambulatory monitoring of “community acquired” syncope. BMC Health Serv Res 2006, 6:68. Hoch JS, Dewa CS: Lessons from trial-based cost-effectiveness analysis of mental health interventions. Why uncertainty about outcomes, estimates and willingness-to-pay matters. Pharmacoecnomics 2007, 25(10):807–816. Hoch JS, Blume JD: Measuring and illustrating statistical evidence in a cost-effectiveness analysis. J Health Econ 2008, 27:476–495. Claxton K: The irrelevance of inference: a decision making framework to the stochastic evaluation of health care technologies. J Health Econom 1999, 18:341–364. Briggs A, Fenn P: Confidence intervals or surfaces? Uncertainty of the cost-effectiveness plane. Health Econ 1998, 7:723–740. Briggs AH, Gray AM: Handling uncertainty when performing economic evaluation of healthcare interventions. Health Technol Assess 1999, 3(2):1–134. Dong H, De Allegri M, Gnawali D, Souares A, Sauerborn R: Drop-out analysis of community-based health insurance membership at Nouna, Burkina Faso. Health Policy 2009, 92(2–3):174–179. Dong H, Gbangou A, De Allegri M, Pokhrel S, Sauerborn R: The differences in characteristics between health-care users and non-users: implication for introducing community-based health insurance in Burkina Faso. Eur J Health Econ 2008, 9(1):41–50. Dong H, Kouyate B, Cairns J, Mugisha F, Sauerborn R: Willingness-to-pay for community-based insurance in Burkina Faso. Health Econ 2003, 12(10):849–862. Dong H, Kouyate B, Cairns J, Sauerborn R: Differential willingness of household heads to pay community-based health insurance premia for themselves and other household members. Health Policy Plan 2004, 19(2):120–126. De Allegri M, Sauerborn R: Community based health insurance in developing countries. BMJ 2007, 334(7607):1282–1283. Lothgren M, Zethraeus N: Definitions, interpretation and calculation of cost effectiveness acceptability curves. Health Econ 2000, 9:623–630. Van Hout VA, Al MJ, Gordon GS, Rutten FF: Costs, effects and C/E ratios alongside a clinical trial. Health Econ 1994, 3:309–319. Schroeder E, Petrou S, Patel N, Hollowell J, Puddicombe D, Redshaw M, Brocklehurst P, Birthplace in England Collaborative Group: Cost effectiveness of alternative planned places of birth in woman at low risk of complications: evidence from the Birthplace in England national prospective cohort study. BMJ 2012, 344:e2292. Ranson MK, Sinha T, Chatterjee M, Gandhi F, Jayswal R, Patel F, Morris SS, Mills AJ: Equitable utilisation of Indian community based health insurance schemes among its rural membership: cluster randomised controlled trial. BMJ 2007, 334(7607):1309. Chowdhury ME, Ronsmans C, Killewo J, Anwar I, Gausia K, Das-Gupta S, Blum LS, Dieltiens G, Marshall T, Saha S, Borghi J: Equity in use of homebased or facility-based skilled obstetric care in rural Bangladesh: an observational study. Lancet 2006, 367(9507):327–332.
doi:10.1186/1478-7547-10-8 Cite this article as: Hounton and Newlands: Applying the net-benefit framework for assessing cost-effectiveness of interventions towards universal health coverage. Cost Effectiveness and Resource Allocation 2012 10:8.
Submit your next manuscript to BioMed Central and take full advantage of: • Convenient online submission • Thorough peer review • No space constraints or color figure charges • Immediate publication on acceptance • Inclusion in PubMed, CAS, Scopus and Google Scholar • Research which is freely available for redistribution Submit your manuscript at www.biomedcentral.com/submit