Array-based goniospectroradiometer for measurement of spectral radiant intensity and spectral total flux of light sources Michael Shaw* and Teresa Goodman Optical Technologies and Scientific Computing Team, National Physical Laboratory, Hampton Road, Teddington, Middlesex TW11 0LW, United Kingdom *Corresponding author:
[email protected] Received 23 January 2008; accepted 25 February 2008; posted 10 March 2008 (Doc. ID 91956); published 6 May 2008
We present a description of a new goniospectroradiometric measurement system developed at the National Physical Laboratory (NPL). The instrument incorporates a modified array spectrometer and a series of rotary stages to allow measurement of the spectral radiant intensity distribution of a variety of different types of light source from 350 to 830 nm. Associated source properties such as chromaticity and correlated color temperature distributions and total spectral flux are then calculated from the radiant intensity data. A preliminary comparison with NPL’s integrating sphere-based luminous flux scale shows agreement to within 0.4%, well within the combined measurement uncertainty. Measurements of the luminous intensity and color temperature distributions and the spectral total flux of a tungsten filament flux standard, a white LED cluster and a compact fluorescent source made using the goniospectroradiometer, are also presented. © 2008 Optical Society of America OCIS codes: 120.5240, 120.5630, 120.3940, 230.6080, 040.1240.
1. Introduction
The spectral radiant intensity distribution and total spectral flux are important parameters for the characterization of light sources. The spectral radiant intensity distribution describes how properties such as the perceived color of a light source change in different directions, which is of critical importance in many signalling and illumination applications. Such information about a light source can also be used to model the influence of the source when used within any defined environment or as part of another optical system. When combined with a measurement of the power consumption, the spectral radiant intensity, spectral total flux, and associated luminous quantities enable the efficacy and energy efficiency of a source to be determined. The spectral total flux of a light source can be measured using either an integrating sphere-based or a goniometric approach [1]. In the case of the former, 0003-6935/08/142637-11$15.00/0 © 2008 Optical Society of America
the output of the source in different directions is averaged over 4π sr by multiple reflections from the coating on the inside surface of the integrating sphere. Goniometric techniques, on the other hand, rely on measuring the irradiance or radiant intensity of the light source at a large number of different points in space and then integrating these measured values over a surface enclosing the source. One significant advantage of goniometric methods is that they provide information about the spectral radiant intensity distribution of the source as well as the spatially averaged properties. In the past the National Physical Laboratory (NPL) has realized scales of total luminous and spectral flux using a goniometric approach [2,3], and disseminated these scales using large diameter integrating spheres in the case of spectral total flux, and using both integrating spheres and a goniophotometer in the case of total luminous flux. With the development of a new goniospectroradiometer, NPL is now able to disseminate both spectral and luminous flux scales directly using a goniometric technique. 10 May 2008 / Vol. 47, No. 14 / APPLIED OPTICS
2637
2. Instrument Design
The NPL goniospectroradiometer is based on a GO-DS 2000 mirror goniophotometer system manufactured by LMT [4], which has been specially designed to allow the detector head to be positioned in a fixed location in a tunnel at a distance ≤ 17 m from the center of the light source as with a typical mirror goniophotometer configuration [5], or at the center of the mirror with the mirror itself being covered with a low-reflectance black material, effectively converting it to a type 2 goniophotometer with a moving head [5] and a source– receiver distance of ∼1:7 m. The latter configuration allows measurement of compact, relatively low-power sources, which can be difficult to measure with a long path length due to low signal levels. Additionally, and more importantly, removing the mirror from the light path eliminates measurement uncertainties arising from the mirror, such as effects due to polarization and surface nonuniformities. Furthermore, since the mirror is back-silvered, measurements can be carried out further into the UV without the mirror in the light path between the source and the receiver. The light source being measured is mounted on an arm, the orientation of which is controlled by a pair of rotation stages allowing the zenith angle (γ) of the measurement to be set without changing the orientation of the lamp with respect to the laboratory. A third rotation stage allows rotation of the source about a vertical axis passing through its photometric center and sets the azimuthal angle (C) of the measurement (Fig. 1). In both configurations (i.e., with and without the mirror in the light path), the spectral radiant intensity of the source is measured by replacing the photometer
detector head, which is used for luminous intensity distribution and luminous flux measurements, by a CCD array spectrometer. For measurements using the mirror this substitution is straightforward since the photometer is in a fixed position and can be easily replaced by the spectrometer. For direct measurements of compact sources without the mirror in the light path, a more complex arrangement is necessary. In this case the receiver is a 50:8 mm diameter BaSO4 -coated integrating sphere mounted at the center of the (covered) mirror such that the distance from the center of its 12:7 mm diameter entrance port to the center of the light source is the same at all measurement positions (see Fig. 2). The integrating sphere is coupled to the spectrometer using an optical fiber bundle, which has a round-to-line format to maximize light collection into the spectrometer. The tips of the individual fibers are distributed uniformly across a circular field at the receiver end to match the configuration of the sphere exit port and form a vertical line at the spectrometer end to match the configuration of the entrance slit. The sphere exhibits good cosineresponse characteristics for radiation incident at < 35° to the normal to the entrance port, and effectively depolarizes the light before it enters the fiber bundle. The slit at the output end of the fiber bundle is imaged onto the entrance slit of the spectrograph by a lens that matches the F=# of the radiation exiting the fiber (NA ¼ 0:22, F=2:3) to that of the spectrograph (NA ¼ 0:125, F=4). The spectrometer is mounted as close to the integrating sphere as practically possible given the available space and load bearing constraints of the goniometer, while also ensuring that during the operation of the goniometer there is no relative move-
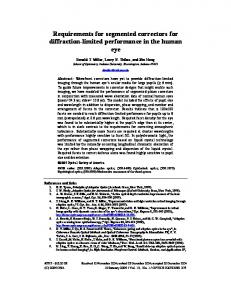
Fig. 1. Schematic diagram of the NPL goniospectroradiometer showing the configuration when measuring the spectral radiant intensity of a light source at different zenith angles for compact light sources (i.e., without the mirror in the light path). A section of the mirror has been removed to show the mounting of the array spectrometer behind the mirror. 2638
APPLIED OPTICS / Vol. 47, No. 14 / 10 May 2008
Fig. 2. Schematic diagram of the NPL goniospectroradiometer configured for measurements on compact light sources (i.e., without the mirror in the light path). A section of the mirror has been removed to show the mounting of the array spectrometer behind the mirror.
ment between the two ends of the fiber that could potentially lead to changes in its transmittance. In practice this means the spectrometer is fixed behind the mirror on the rotating arm that supports the integrating sphere and the mirror. Changing the position of the two rotation stages (γ between 0° and 180°, and C between 0° and 360°) allows the integrating sphere to collect radiation emitted by the source in any direction. Equivalently the receiver can be considered to be sampling the spectral irradiance of the light source at different points on the surface of a notional sphere centered on the source. By measuring at a sufficiently large number of positions on this notional sphere, the total flux of the source can be determined by spatial integration of the measured intensity values. For a small angular subtense around the lamp cap, radiation emitted by the source is shielded from the receiver by the lamp mount and the goniometer arm. To correct for this obscuration a small additional contribution to the total flux is calculated from consideration of the geometry and the measured radiant intensity distribution of the light source, as well as the degree of obscuration by the goniometer arm, and added to the measured flux. For a tungsten filament flux standard lamp, this obscuration or “cap correction” is typically ∼0:2%. The spectrograph is an Andor Shamrock SR303i with a Czerny–Turner configuration and a focal length of 303 mm. After passing through the entrance slit, light entering the spectrograph is collimated by a toroidal mirror onto a diffraction grating. A second toroidal mirror forms an image of the entrance slit on the detector array of a Peltier-cooled Andor DV401-UV CCD camera mounted at the focal plane of the spectrograph. The two-dimensional (2D) detector array is composed of 256 × 1024 pixels, each 26 μm wide. Counts from the 256 pixels in each column of the detector array are summed to give spectral values at 1024 wavelengths. A six position filter wheel fitted behind the spectrograph entrance slit contains a number
of different blocking filters that are used for order sorting and to improve the stray light rejection of the spectrometer (see Section 3). The spectrometer includes a facility for adjusting the position of the diffraction grating by means of a rotatable grating turret, allowing different spectral regions to be sampled if required. In practice, however, the spectrometer is operated with the grating turret in a fixed position to minimize potential wavelength errors in the acquired spectra arising from the movement of the grating and also to speed up data acquisition. The diffraction grating used has a line density of 150 l=mm (500 nm blaze), giving a linear dispersion of ∼21 nm=mm at the focal plane of the spectrograph, meaning each detector pixel spans 0:56 nm and the bandpass across the entire detector array is ∼570 nm. The grating orientation is set such that the 546:1 nm emission line from a mercury discharge lamp falls in the center of the detector array, and wavelengths between 260 and 830 nm are simultaneously incident on the detector array. The entrance slit of the spectrograph is set to a width of 50 μm, which (for a monochromatic input) is imaged with 1∶1 magnification onto the CCD detector array. The spectral resolution of the combined detection system is determined by both the width of the entrance slit and the effective slit width defined by each pixel in the detector array. With the settings described above, the instrumental slit function is trapezoidal in shape with a measured full width at half-maximum of ∼1:7 nm across the detector array. 3.
Stray Light Errors in the Array Spectrometer
Using array-based spectrometers for radiometric applications presents a number of difficulties, one of the most significant of which is the relatively poor stray light rejection of these devices when compared with scanning double monochromators. However, in situations where measurement speed is of critical importance, array spectrometers offer a significant advantage over scanning systems due to their capability of simultaneously acquiring spectral data at a large number of wavelengths over a broad wavelength range. This is the primary reason for incorporating an array detector into the goniospectroradiometer since acquiring spectral information in the many spatial positions required to characterize a light source becomes extremely time consuming using a scanning monochromator system (a typical array system is capable of measuring over the entire visible region several orders of magnitude faster than a typical scanning system). To determine which of the commercially available array spectrometers was most suitable for use on the goniospectroradiometer, a number of devices were evaluated at NPL. To assess their stray light rejection, the different spectrometers were used with a quartz halogen tungsten projector lamp to measure the transmittance of a series of colored glass “cut-on” (long pass) glass filters [6]. For an ideal system, the ratio of the measured signals for the lamp-plus-filter 10 May 2008 / Vol. 47, No. 14 / APPLIED OPTICS
2639
to those for the unfiltered lamp (with corresponding dark signals subtracted) will give a result equal to the transmittance of the cut-on filter; any deviation from this ideal behavior provides information about the performance of the spectrometer and, in particular, its stray light rejection. Cut-on filters of sufficient thickness have extremely low transmittance at wavelengths shorter than the cut-on wavelength, and any significant measured signal at these wavelengths therefore indicates the presence of stray light. The stray light errors for a given array spectrometer depend on the spectral power distribution of the source being measured and for this reason these measurements only provide information about the magnitude of the errors associated with measuring this particular type of source. However, the use of a tungsten lamp for stray light tests is useful for two reasons. First, tungsten lamps are widely used as reference sources for the calibration of spectroradiometric measurement systems due to their excellent stability and reproducibility. It is therefore important to know the stray light performance with such a source. Second, use of a tungsten lamp represents a reasonably stringent test of stray light performance, so if good results are obtained with this source, results with other types of source are also likely to be reasonably good. This is because the spectral irradiance of a tungsten lamp is several orders of magnitude higher at longer visible to near-infrared wavelengths than at shorter visible or ultraviolet wavelengths (for a 2856 K Planckian radiator, < 1% of the total radiant power emitted between 250 and 1100 nm is emitted at wavelengths shorter than 435 nm). The problem is compounded for silicon-based detector arrays, which have a significantly higher spectral responsivity at longer visible and near-infrared wavelengths than at shorter wavelengths. Thus if even a small fraction of the longer wavelength radiation is scattered onto the short wavelength sensing part of the detector array, it can dominate the signal measured at these shorter wavelengths. Six different commercially available array spectrometers were tested at NPL using a series of cut-on filters as described above. It is important to use several filters since stray light performance can vary
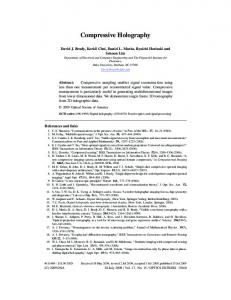
Fig. 3. (Color online) Transmittance of a 3 mm thick GG435 colored glass filter measured using six different array spectrometers. 2640
APPLIED OPTICS / Vol. 47, No. 14 / 10 May 2008
significantly with wavelength. Figure 3 shows an example of the results of these tests; in this case using a 3 mm thick piece of GG435. All six spectrometers show significant levels of stray light at short wavelengths with even the best device producing errors > 2% in measured transmittance at all wavelengths shorter than the cut-on wavelength, rising to 100% at the shortest wavelengths. In other words, even for the best spectrometer tested here, between 2% and 100% of the measured signal at short wavelengths is due to stray light. This being the case, none of the spectrometers shown in Fig. 3 can be considered suitable for measuring the irradiance of a tungsten source at wavelengths shorter than 400 nm without correction. The Andor spectrograph and CCD camera used on the goniospectroradiometer were selected partly on the basis of reasonable stray light performance, in comparison to other array spectrometers tested, and partly because the combined system offered the flexibility to meet the other requirements (spectral resolution, wavelength interval, sensitivity, etc.). Nevertheless, significant stray light was observed during the tests that would severely compromise the calibration and use of the device. One solution to the stray light problem is to determine a stray light correction matrix based on the results of investigations in which the spectrometer is irradiated with tunable narrowband radiation [7]. An alternative is to reduce the stray light level using appropriate blocking filters, and it is this latter approach that has been implemented for the NPL goniospectroradiometer system. Stray light in an array spectrometer is caused by interreflections and scattering of radiation within the body of the device, resulting in radiation at other wavelengths reaching parts of the detector array to which they do not correspond. The problem is exacerbated in compact array devices by the relatively small distances between the various optical surfaces, which often makes baffling and effective rejection of other diffracted orders particularly difficult. The principle behind using blocking filters to reduce the stray light errors in such a device is to limit the bandwidth of radiation entering the spectrometer; this allows measurements to be made over a truncated spectral range without the influence of radiation at wavelengths outside this range. In the case of measuring the irradiance of a tungsten lamp, for example, removal of the longer visible and nearinfrared wavelengths when the UV and shorter visible range is measured can lead to a dramatic reduction in the level of stray light, since even a small amount of scattered radiation from longer wavelengths has a significant effect on the measured signal. The remaining stray light will be due only to the small fraction of light scattered at short wavelengths, which represents a correspondingly small fraction of the measured signal. The type and number of different stray light blocking filters represents a compromise between im-
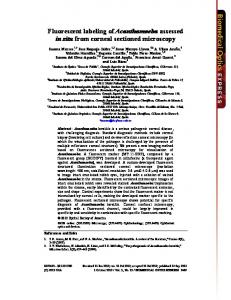
proved stray light performance (using more filters, each with a narrower bandpass, generally means better stray light rejection) and measurement time (measurements must be made using each filter in turn so increasing the number of filters increases the overall measurement time). As mentioned previously, it is desirable to keep the measurement time as short as possible to minimize effects due to lamp aging or temporal drift in output. By making some simplifying approximations about the stray light distribution in the array spectrometer, it is possible to estimate the fractional error due to stray light when the irradiance from a tungsten lamp operating at a given color temperature is measured through a blocking filter of defined transmittance. The assumptions are a. The stray light signal counts are the same at each pixel across the entire detector array. b. The total summed stray light counts are a fixed fraction of the total integrated signal counts. Both of these are crude approximations and ignore the fact that the stray light signal distribution across the array is both nonuniform and dependent upon the spectral irradiance at the spectrograph entrance slit. However, they enable an order of magnitude assessment of the effect of using a blocking filter with defined transmittance with the spectrometer. After experimenting with different transmittance curves, a set of four Gaussian profiles were identified which, according to the simple model, together gave stray light errors of < 1% across the range of 350 to 830 nm. The characteristics (the center wavelength and full width at half-maximum) of these hypothetical Gaussian filters were then used as a guide for the design of real sets of blocking filters. The four stray light blocking filters shown in Fig. 4 have been incorporated into a filter wheel housed inside the Andor spectrograph used on the NPL goniospectroradiometer. Each of these blocking filters is a combination of commercially available colored glass and interference filters chosen such that together they have high transmittance over a certain wavelength range and good out-of-band blocking. Since the filter wheel is positioned behind the spectro-
Fig. 4. (Color online) Measured regular transmittance of four stray light blocking filters used on the NPL goniospectroradiometer.
graph entrance slit, it is important that all four filters have approximately the same optical path length for all wavelengths from 350 to 830 nm, otherwise the entrance slit will not be focused onto the CCD array in the same way for each filter. This is achieved by using additional fused silica plates to increase the overall optical path length of each combination to ∼9 mm. To measure the spectral characteristics of a light source from 350 to 830 nm using the blocking filters, four different acquisitions are taken, one through each blocking filter. A combined spectrum is then formed by the addition of these four spectra over adjacent, nonoverlapping wavelength ranges. For example, measurements using blocking filter 1 provide data in the range of 350 nm < λ ≤ 467 nm, measurements using blocking filter 2 provide data in the range of 467 nm < λ ≤ 578 nm, and so on. Overall spectra determined in this way (see Figs. 8, 12, and 16) do not contain significant discontinuities at the boundaries between data obtained using different blocking filters. To assess the degree of improvement in stray light performance achieved by use of the blocking filters, the tests described previously were repeated. The results shown in Fig. 5 indicate a significant reduction in stray light errors when using the blocking filters (data points) compared with the unfiltered spectrometer (solid and dashed curves). For example, using the blocking filters shows stray light levels of 2.2% at 350 nm and 0.4% at 380 nm when measuring the transmittance of a 3 mm thick piece of GG435, compared with levels of 57% at 350 nm and 24% at 380 nm when the measurements are made without the blocking filters. In this case the stray light blocking filters reduce the stray light errors by more than an order of magnitude. Although using blocking filters in the way described above does substantially improve the stray light rejection of the spectrometer, the technique does have some limitations. The major problem is that, as mentioned previously, overall measurement time is increased significantly since four separate data acquisitions are required to span the range of 350 to 830 nm. Acquisition of a full spectrum over this range using the blocking filters typically takes 6–17 s, depending on the intensity of the light source.
Fig. 5. (Color online) Transmittance of colored glass filters measured using tungsten lamp and Andor array spectrometer with and without stray light blocking filters. 10 May 2008 / Vol. 47, No. 14 / APPLIED OPTICS
2641
One solution to this problem would be to fit the filters directly in front of the corresponding areas of the detector array. However, this does present practical difficulties; not least that introducing an additional optical element into the spectrometer is likely to change its stray light characteristics. Any significant temperature dependence in the transmittance of the filters will change the effective responsivity of the combined spectrometer detection system. However, the impact of this is small because a. The spectrometer is mounted several meters from the light source in a temperature-stabilized laboratory and is therefore not subject to significant changes in temperature. b. Temperature coefficients of spectral filters are generally only significant in spectral regions where the transmittance of the filter varies strongly with wavelength. The filters have been designed so that there is some overlap between them in regions where the transmittance is changing rapidly, thus ensuring that any change in the temperature of the filters has a negligible effect on the final measured values. 4. Data Acquisition and Analysis A. Data Acquisition
Two personal computers are used to operate the goniospectroradiometer; one to control the motion of the goniometer and the other to set up and acquire data from the array spectrometer. The angular coordinates (C and γ) of each required measurement position are set using the goniometer control software. The number and distribution of the spatial measurement positions depend on the type of source being measured. When measuring the flux of highly directional sources such as LEDs, it is more effective to concentrate measurements in the directions of high radiant intensity rather than distribute the measurement positions uniformly over the entire 4π sr. Each time the goniometer reaches one of the measurement positions defined by the control program, it pauses and sends a transistor–transistor logic pulse to trigger the spectrometer. It then waits to allow the spectrometer to acquire the spectral data before moving the rotary stages to the next defined coordinates, and so on. The spectrometer control software sets the CCD acquisition parameters (integration time, pixel binning, etc.), the spectrograph settings (slit width, grating position, etc.), and stores the measured spectra. Dark measurements are performed with a small black baffle mounted between the entrance port of the integrating sphere and the light source with the baffle positioned such that it blocks only direct light from the source from entering the sphere. The dark signal measured in this way includes the ambient stray light, that is any light reaching the detector due to scattering off the floor, walls, and ceiling of the laboratory or off the body of the goniospectroradiometer, and light from any sources other than the 2642
APPLIED OPTICS / Vol. 47, No. 14 / 10 May 2008
test source, as well as the dark current of the CCD camera. Individual dark measurements are required with the goniometer in each spatial measurement position to determine the relevant background signal spectrum, which can be subtracted point-by-point from the corresponding raw lamp signals at that position. In practice it is often possible to determine the background signals by interpolation of a subset of measurements at a limited number of different elevation (γ) angles since the ambient stray light tends to be reasonably isotropic and represents only a small fraction of the overall measured signal. Determining the background signal from a smaller subset of measurements in this way has the advantage that the overall lamp burn time is reduced, thus reducing lamp aging effects. In a laboratory with low levels of ambient stray light, such as that used at NPL, this has a negligible effect on the measurement results and uncertainties. B.
Measurement Procedure
Traceability for the goniospectroradiometer comes via calibration using specially designed luminous intensity standard lamps (Polaron Special Lamps) calibrated against the NPL spectral irradiance scale that was established in 2003 using a 3050 K blackbody and a set of filter radiometers [8]. Two different reference lamps are used with the goniometer arm set such that the lamp is viewed by the spectrometer in the same orientation as that for which it was calibrated. Measurements are made using each of the four different stray light blocking filters and are corrected for the measured dark signals. The mean of the results from the two reference lamps is used to determine the spectral radiant intensity responsivity of the goniospectroradiometer (in units of counts · W−1 · sr· nm) for each blocking filter, and subsequent measurements on other sources are then corrected accordingly. Measurements of each test source are recorded at each measurement angle required as described above, and the raw data are processed offline using a program written in MATLAB. This program first subtracts the measured background counts from the test lamp signal counts and stores the result in a three-dimensional data array. Next, the four spectra measured at each spatial position (one for each different stray light blocking filter) are corrected for the calibrated spectral responsivity of the spectrometer. The data from each of these four different spectra, each covering a different restricted spectral range, are then combined as described in Section 3 to determine the full spectral radiant intensity distribution of the light source at each spatial measurement position from 350 to 830 nm. A number of useful quantities can be derived from the spectral radiant intensity distribution results. The luminous intensity distribution and x and y chromaticity coordinates of the source are calculated from the VðλÞ photopic response function and the 10° color matching functions [9], which have been linearly interpolated and evaluated at the center wave-
lengths of each pixel of the CCD array. The correlated color temperature (CCT) of the source is calculated from the chromaticity coordinates by determining the temperature of the Planckian radiator with the closest color coordinates to those of the test source in ðu; vÞ color space [9]. The total spectral flux, Φe ðλÞ, of the source is calculated by integration of the measured spectral radiant intensity values, I e ðλÞ, over 4π sr: Z Φe ðλÞ ¼
2π
0
Z 0
π
I e ðλ; C; γÞ sin γdγdC:
ð1Þ
In practice, this is carried out by defining N nonoverlapping polygons that cover the entire ðC; γÞ space, each containing a single measured radiant intensity value. Calculating the flux in this way allows for an arbitrary angular spacing of the measured intensity values in the γ and C directions. The integration can then be approximated by regarding the value of I e ðλÞ as being constant throughout each polygon (equal to the measured value at the appropriate measurement position) and calculating the integral of sin γ within each polygon (Pn ) using an analytical formula Φe ðλÞ ¼
N X n¼1
Z I e ðλ; γ n ; Cn Þ
Pn
sin γdA:
ð2Þ
The polygons are assigned by a 2D Voronoi tessellation of the radiant intensity data set carried out using the MATLAB routine “voronoin.” For a given point p, the Voronoi polygon is defined by the boundary enclosing all intermediate points lying closer to p than to any other point. The main drawback to the Voronoi tessellation is that it can generate infinite polygons. If a point is on the edge of the set of points being tessellated, the polygon surrounding it is infinite. To avoid this problem, the data set is expanded to include extra dummy points. The data are ordered such that the real measurement points always form the first N points to be meshed so that the MATLAB command will return the polygons surrounding these points first and it is clear which polygons are needed. The main source of uncertainty associated with calculating the flux in this way is that the values of I e ðλÞ will not, in reality, be constant over the solid angle defined by each polygon. Such sampling errors are minimized by an appropriate choice of both the number and the distribution of spatial measurement points. Where no prior information about the expected intensity distribution for a particular source is available, it may be necessary to carry out a preliminary measurement to determine a suitable set of spatial sampling points.
pixel is then calculated by interpolation [6]. The resulting wavelength error has been checked using a number of other spectral emission lines and found to be < 0:2 nm over the full spectral range used. Linearity errors evaluated using the double aperture technique have been found to be < 0:2% over the range of use. This has been restricted to less than the full dynamic range of the CCD. The goniospectroradiometer measurement technique requires that the distance from the photometric center of the source to the center of the receiver aperture be the same for measurement of the intensity reference standard and the test source. This being the case, knowledge of the absolute source to receiver distance is not necessary for calculation of the radiant intensity. A low power laser fitted inside the rotating arm of the goniometer is aligned with the axis of the rotation stage that controls the elevation of the lamp with respect to the laboratory and intersects the lamp rotation (C) axis. Using this laser and a series of manual kinematic stages on the lamp mount, it is possible to align the center of most types of tungsten filament lamp to within 2 mm of the intersection of the laser beam and the C axis, which is equal to 0.12% of the total source to receiver distance. For measurement of the spectral total flux of a tungsten source, the combined (k ¼ 2) measurement uncertainty is < 3:6% over the entire visible range and < 3% at wavelengths longer than 450 nm. The largest single contribution to this uncertainty comes from the spectral radiant intensity scale, however this is expected to decrease significantly with the planned realization of a new NPL spectral irradiance scale in 2008. 6.
Results
The NPL goniospectroradiometer system has been used to measure the spectral radiant intensity distributions of a 1 kW tungsten flux standard, a cluster of white LEDs, and a compact fluorescent source. For each of these sources the luminous intensity and CCT distributions and the total spectral flux have been calculated from the measured spectral radiant intensity distributions. In the luminous intensity and color temperature plots shown in Subsections 6.A–6.C, the measured value in a given direction is indicated both by the radial distance from the origin of the coordinate system and the shading of the surface. All three sources were measured with the lamp cap pointing upward and the luminous intensity and CCT distribution plots have been oriented in this same way. All the measurements presented here were made with the integrating sphere receiver mounted directly on the mirror cover with the goniospectroradiometer in the configuration as shown in Fig. 2.
5. Calibration and Uncertainties
A.
Measurement of a Tungsten Flux Standard
The wavelength scale of the spectrometer system is determined at a number of positions using several different low-pressure discharge lamps. The wavelength corresponding to the center of each detector
The measurements presented in this section were performed on a 1 kW tungsten flux standard (Polaron Special Lamps). The lamp comprises an open wreath type tungsten filament arranged in a planar hepta10 May 2008 / Vol. 47, No. 14 / APPLIED OPTICS
2643
gonal configuration with one side removed where the ends of the filament connect to the lamp electrodes, encased in a large glass envelope. The lamp was oriented cap up, such that the filament lay in a horizontal plane. As the lamp has been designed to have a reasonably isotropic intensity distribution, measurements were made in directions spaced uniformly in elevation (γ) and azimuthal (C) angles. Figure 6 shows that the luminous intensity of the tungsten flux standard is lower in the plane of the filament where the section of the filament nearest the receiver obscures light from the back part. The direction of greatest intensity is directly below the center of the bulb (γ ¼ 0°). In the opposite direction, γ ¼ 180°, obscuration of the emitted radiation by the lamp cap, and partly by the goniometer arm, results in a lower measured radiant intensity. Some anisotropy in the C direction is caused by the geometric structure of the filament. The CCT of the tungsten flux standard (see Fig. 7) is relatively isotropic in the azimuthal direction; however, a clear trend is observable in the zenith (γ) direction where the source has a lower CCT in directions near the lamp cap, γ ¼ 180°. This can be attributed to the presence of a mica disk fitted inside the lamp envelope between the cap and the filament. The mica disk has a lower transmittance at shorter wavelengths, hence when the filament is viewed though it the shorter, bluer wavelengths are preferentially absorbed causing a reduction in the measured CCT. Figure 8 shows the measured spectral total flux of the tungsten flux standard, which exhibits the typical Planckian distribution expected for a lamp of this type. The luminous flux calculated from the total spectral flux of this source measured on the goniospectroradiometer agrees with a measurement of the luminous flux made using the NPL 5 m inte-
Fig. 6. Measured luminous intensity distribution of a 1 kW tungsten filament flux standard. 2644
APPLIED OPTICS / Vol. 47, No. 14 / 10 May 2008
Fig. 7. Measured CCT distribution of a 1 kW tungsten filament flux standard.
grating sphere to within 0.4%, which is well within the combined uncertainties of the two instruments. B.
Measurement of a White LED Cluster
The white LED cluster was made up of 75 individual white LED elements encapsulated in a clear plastic envelope. The individual LEDs were mounted on two boards fixed back-to-back inside the envelope. The spectral radiant intensity of the LED cluster was measured in 302 directions around the source. Due to the extremely directional output of the cluster, these measurement directions were primarily in the hemisphere below the source (0° ≤ γ ≤ 90°), and were more closely spaced in the directions near the peak intensity. The luminous intensity distribution of the LED cluster (see Fig. 9) is extremely anisotropic and is highest in the γ ¼ 0° direction. A small amount of the total output is emitted in the direction of the cap. Figure 10 shows the CCT distribution of the white LED cluster measured between γ ¼ 0° and γ ¼ 90°. The CCT at larger elevation angles could not be re-
Fig. 8. Measured spectral total flux of a 1 kW tungsten filament flux standard.
Fig. 11. Scatterplot showing x and y chromaticity coordinates for a white LED cluster measured in different directions around the source.
C.
Fig. 9. Measured luminous intensity distribution of a white LED cluster.
liably calculated due to the low radiant intensity of the source in these directions. The CCT of the source varies significantly with elevation and is highest close to the equatorial plane, γ ¼ 90°, decreasing with elevation angle before increasing again directly beneath the lamp, γ ¼ 0°. The scatterplot of measured chromaticity coordinates (see Fig. 11) further illustrates that the color of the source varies significantly depending on the direction from which it is viewed. The measured spectral total flux of the LED cluster (see Fig. 12) shows how its white appearance arises from a combination of the LED emission at shorter wavelengths centered at around 460 nm and the broadband emission of the phosphor coating at longer wavelengths.
Fig. 10. Measured CCT distribution of a white LED cluster.
Measurement of a Compact Fluorescent Lamp
The compact fluorescent lamp measured on the goniospectroradiometer had a 2D configuration such that with the lamp cap up, the light emitting tubes lay in a horizontal plane. Figure 13 shows the luminous intensity distribution of the source measured in 308 directions equally spaced in C and γ. Similarly as for the tungsten flux standard (see Fig. 6), masking of the far sections of the discharge tube by those nearer the receiver result in a lower luminous intensity in the plane of the tube (equatorial plane). The CCT distribution for the compact fluorescent source (see Fig. 14) is relatively isotropic, although slightly higher in directions close to the lamp cap. The scatterplot of the x and y chromaticity coordinates for this source (see Fig. 15) further illustrates that the perceived color does not change significantly with viewing angle. It is interesting to compare this latter figure with the corresponding figures for the white LED cluster (see Fig. 11), where the variation in color (in the x, y color space) is significantly larger. The measured total spectral flux of the compact fluorescent lamp is shown in Fig. 16.
Fig. 12. Measured spectral total flux of a white LED cluster. 10 May 2008 / Vol. 47, No. 14 / APPLIED OPTICS
2645
Fig. 15. Scatterplot showing x and y chromaticity coordinates for a compact fluorescent lamp measured in different directions around the source. Fig. 13. Measured luminous intensity distribution of a 2D compact fluorescent lamp.
7. Conclusions
A goniospectroradiometer has been developed at NPL for measurement of the spectral radiant intensity distribution of a variety of different source types from 350 to 830 nm. Additional source parameters such as luminous intensity distribution, spectral and luminous flux, and chromaticity and CCT distributions are calculated from the measured spectral radiant intensity distribution. The system incorporates a CCD array spectrometer with a series of blocking filters that have been shown to improve the stray light rejection of the device by greater than an order of magnitude. Work is ongoing to compare spectral and luminous flux measurements made on the goniospectroradiometer with similar measure-
Fig. 16. Measured spectral total flux of a 2D compact fluorescent lamp.
ments made using NPL’s integrating sphere based instrument on a variety of different source types. The authors acknowledge the help and advice of their colleagues within the Optical Technologies and Scientific Computing Team at the National Physical Laboratory, in particular, Louise Wright for developing the spatial flux integration method and goniometric data visualization tools. The identification of certain commercial equipment does not imply recommendation or endorsement by NPL, nor does it imply that the equipment identified is the best available for the purpose. This work was funded by the National Measurement System Directorate of the United Kingdom Department for Innovation, Universities, and Skills. References
Fig. 14. Measured CCT of a 2D compact fluorescent lamp. 2646
APPLIED OPTICS / Vol. 47, No. 14 / 10 May 2008
1. Y. Zong and Y. Ohno, “Realization of total spectral radiant flux scale and calibration service at NIST,” CIE Proceedings 26th Session Beijing (Commission Internationale de l’Elairage, 2007), Vol. D2, pp. 179–182. 2. T. M. Goodman, J. R. Moore, N. C. Pearce, and D. K. Murray, “The establishment of a new national scale of spectral
3. 4. 5. 6.
total flux,” CIE Proceedings 22nd Session Melbourne 1991 (Commission Internationale de l’Elairage, 1991), Vol. 1, pp. 50–53. O. C. Jones and R. G. Berry, “A new determination of the lumen,” Metrologia 6, 81–89 (1970). http://www.lmt.de/en/gods1620.html. CIE Publication number 70: The measurement of absolute luminous intensity distributions (1987). G. R. Hopkinson, T. M. Goodman, and S. R. Prince, A Guide to the Use and Calibration of Detector Array Equipment, Press Monograph Vol. PM142 (SPIE, 2004).
7. Y. Zong, S. W. Brown, C. J. Johnson, K. R. Lykke, and Y. Ohno, “Simple spectral stray light correction method for array spectroradiometers,” Appl. Opt. 45, 1111–1119 (2006). 8. E. R. Woolliams, N. P. Fox, M. G. Cox, P. M. Harris, and N. J. Harrison, “Final report on CCPR K1-a: Spectral irradiance from 250 nm to 2500 nm,” Metrologia 43, 02003 (2006). 9. ISO 10527:2007(E)/CIE S 014-1/E:2006, “Joint ISO/CIE Standard: CIE Standard Colorimetric Observers,” CIE Publication 15:2004, Colorimetry 3rd Ed., (CIE, 2004).
10 May 2008 / Vol. 47, No. 14 / APPLIED OPTICS
2647