Arrhythmia Classification Using Local H¨older Exponents and Support Vector Machine Aniruddha Joshi1 , Rajshekhar2? , Sharat Chandran1 , Sanjay Phadke3 , V.K.Jayaraman2 , and B.D.Kulkarni∗∗2 1 2
Computer Science and Engg. Dept., IIT Bombay, Powai, Mumbai, India 400076 Chemical Engineering Division, National Chemical Laboratory, Pune, India 411008 3 Consultant, Jahangir Hospital, Pune, India 411001 ** Corresponding author:
[email protected]
Abstract. We propose a novel hybrid H¨older-SVM detection algorithm for arrhythmia classification. The H¨older exponents are computed efficiently using the wavelet transform modulus maxima (WTMM) method. The hybrid system performance is evaluated using the benchmark MIT-BIH arrhythmia database. The implemented model classifies 160 of Normal sinus rhythm, 25 of Ventricular bigeminy, 155 of Atrial fibrillation and 146 of Nodal (A-V junctional) rhythm with 96.94% accuracy. The distinct scaling properties of different types of heart rhythms may be of clinical importance.
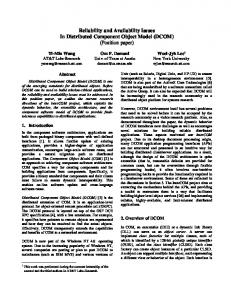
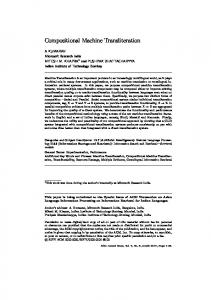
1 Introduction Arrhythmia is a common term for any cardiac rhythm which deviates from normal sinus rhythm. Characterization and classification of such arrhythmia signals is an important step in developing devices for monitoring the health of individuals. Typical and abnormal signals are shown in Fig. 1. Arrhythmias are of different kinds, and exhibit long-term non-stationary patterns. Concepts and techniques including Fourier [1], wavelets [1], chaos parameters [2] have been employed to extract information present in such physiologic time series. All these methods exhibit different degrees of advantages and disadvantages, the main concern being low specificity and accuracy. Our interest is in the recently developed analytic tools based on nonlinear dynamics theory and fractals. These are attractive because they have the ability to perform a reliable local singularity analysis. For example, gait analysis [3] and localization of outliers [4] have been performed using this approach. This approach offers a new and potentially promising avenue for quantifying features of a range of physiologic signals that differ [5] in health and disease. Features detected using such approaches exhibit local hidden information in time series and thus are suitable for classification. Support vector machine (SVM) rigorously based on statistical learning theory simultaneously minimizes the training and test errors. Apart from that, SVM produces a unique globally optimal solution and hence is extensively used in diverse applications including medical diagnosis. In this work, we have developed a novel hybrid H¨older-SVM detection algorithm for arrhythmia classification. We first pre-process a rhythm data series to remove obvious noise patterns. Next, we compute wavelet coefficients at selected scales and use them to compute local H¨older exponents and subsequently pass selected points of the probability density curve ?
Under Graduate Summer Trainee from Chemical Engg. Dept., IIT Kharagpur, India
1
Abnormal
Normal
2 1.5 1 0.5 0 −0.5
0.5 0 −0.5 −1 −1.5 −2
229.5
230
230.5
231
231.5
232
232.5
233
233.5
234
55
234.5
56
57
58
59
60
61
Beat Number
Beat Number
Fig. 1. A normal consistent P-QRS-T rhythm is exhibited on the left. Abnormal rhythm for a patient in every alternate beat appears on the right.
of these exponents as input features to a multi-class support vector machine for classification. Experiments show the validity of our straightforward scheme. The rest of the paper is organized as follows. In Section 2, we briefly describe the methodology for computation of the local singularities and provide a short introduction to SVM. Section 3 highlights our approach for classification along with results achieved. We conclude with some final remarks in Section 4.
2 Local H¨older Exponents For a time series f , if there exists a polynomial Pn of degree n < h and constant C, such that: | f (x) − Pn (x − x0 )| ≤ C|x − x0 |h
(1)
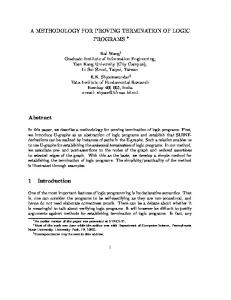
the supremum of all exponents h(x0 ) ∈ (n, n + 1) is termed the H¨older exponent, which characterizes the singularity strength. It is evident [3] that the H¨older exponent describes the local regularity of the function (or distribution) f . The higher the value of h, more regular is the local behavior the function f . Thus it characterizes the scaling of the function locally and the distinct scaling behavior of different signals can be exploited to characterize and classify time series. The wavelet transformation (WT) i.e. Ws,x0 ( f ) provides a way to analyze the local behavior of a signal f , which is a convolution product of the signal with the scaled(s) and translated(x0 ) kernel. One of the main aspects of the WT is the ability to reveal the hierarchy of (singular) features, including the scaling behavior. This is formalized by its relation [6] with the H¨older exponent: Ws,x0 ( f ) ∝ |s|h(x0 ) , s → 0 (2) Fig. 2 shows an example of the WT and the H¨older exponents. We used the second derivative of the Gaussian function, i.e. Mexican hat, as the analyzing wavelet. This wavelet is also extensively used by the other authors, since it possesses good localization capabilities in both position and frequency. Efficiency Considerations. As continuous WT in its original form is an extremely redundant representation, Mallat and Hwang [7] have come up with an alternative approach called wavelet transform modulus maxima (WTMM). Here, the computation of the hierarchical distribution of local behavior, as explained above, can be effectively computed by considering the spacescale partitions. The dependence of the scaling function on the moments q can be captured using WTMM tree as: Z(s, q) = ∑ |Ws,x0 ( f )|q ∝ sτ(q) (3) Ω(s)
Sample ECG
2 1 0
−1
0
500
1000
1500
2000
2500
3000
3500
4000
4500
5000
0
500
1000
1500
2000
2500
3000
3500
4000
4500
5000
0
500
1000
1500
2000
2500
3000
3500
4000
4500
5000
20
WT
15 10
Holder Exponents
5 1.01 1 0.5 0
−0.5
Beat Number
Fig. 2. Sample ECG waveform, its wavelet transform and the corresponding local H¨older exponents at first scale.
where Z(s, q) is the partition function and Ω(s) is the set of all maxima at the scale s. The computation of singularity strength and the transformation from τ(q) to spectrum of singularities D(h) is given by the Legendre transformation[8]: h(q) = dτ(q)/ dq;
D[h(q)] = qh(q) − τ(q)
(4)
Stable Computation. The WTMM based formalism developed by Muzy [6] as described above provides global estimates of scaling properties of time series. Recently, it has been found that even though such global estimates of scaling is often a required property, local analysis may provide more useful information. In the traditional form, the estimation of local singularity strengths and their spectra may not be possible due to the fact that in real life data, the singularities are not isolated but densely packed. This causes the logarithmic rate of increase or decrease of the corresponding wavelet transform maximum line to fluctuate. But very recently, Struzik [9, 10] has provided a stable methodology for estimating the local exponents, in which he has modeled the singularities as if they were created through a multiplicative cascading process. This method has been successfully applied for classification of human gait [3]. The method[10, 3] is as explained below. The mean H¨older exponent h is given by log[M(s)] = q h log(s) +C, where M(s) =
Z(s,2) Z(s,0) .
Employing the multiplicative cascade model, the approxˆ imate local H¨older exponent h(x0 , s) at the singularity x0 can now be evaluated as the slope: ˆ 0 , s) = log(|Ws,x0 ( f )|) − (h log(s) +C) h(x log(s) − log(sN )
(5)
where sN is the length of the entire wavelet maxima line tree, that is, the maximum available scale that coincides with the sample length sN = N, and x0 belongs to the set Ω(s) of all wavelet maxima at the scale s that assume the value Ws,x0 ( f ). (In our calculations we used s=1 in the WT.) 2.1 Support Vector Machines The local H¨older exponents are appropriate as the most informative features for classification using the support vector machines (SVM)[11]. SVM is being extensively used for several classification and regression applications. As the theory is well developed, we provide only the basic ideas [12, 13] involved in binary classification.
1. Transform the input data into a higher dimensional feature space to enable linear classification; specifically define an appropriate kernel in the input space in place of the dot product in the high dimensional feature space. 2. Maximize the margin of the linear hyperplane separating the instances belonging to the two classes by solving the dual formulation of the convex quadratic programming problem to obtain the unique global solution for the classifier. For multi-class classification, we used popular One-Against-One method [14].
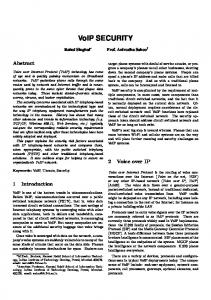
3 Results and Discussion Data Set. The data set used was extracted from ECG recordings of MIT-BIH Arrhythmia Database according to the beat and rhythm annotations. Each record of these rhythms is at least 10 seconds long. Here, the complete dataset includes 160 of Normal sinus rhythm(NSR), 25 of Ventricular bigeminy (VB), 155 of Atrial fibrillation (AF) and 146 of Nodal (A-V junctional) rhythm (NR) records. Out of the whole dataset, 2/3rd of randomly selected data was used as the training set and the remaining 1/3rd was used as the testing set. For each of the extracted rhythms, we computed the features to be used by SVM for classification in the following manner. First, we de-noised the data series using soft threshold wavelet method [15]. Then we computed the wavelet coefficients using WTMM approach, which were subsequently used for the computation of local H¨older exponents as explained in 2. We then computed the probability density of these local H¨older exponents and then fitted this density with Gaussian kernel. For all the rhythms belonging to different classes the local H¨older exponents were in the range [-0.5:1.5]. We divided this range into 12 equal sub-parts and chose 12 points (as shown in Fig. 3(a)) on the fitted probability density curve corresponding to the mid-points of the 12 sub-ranges. Binary Classification. We considered NSR as the ‘normal class’ and all other arrhythmias as ‘arrhythmia class’. We employed LIBSVM [16] toolbox for the classification purpose and used radial basis function (RBF) as the kernel. Selection of other SVM parameters was done using cross-validation on training data. Using multiple runs of 5-fold cross validation with chosen parameters, the overall accuracy of classifier model combinations ranged between 96% to 98%, and which show average (and best respectively) classification for 96.3% (and 98.48%) of normal class and 98.25%(and 98.89%) of arrhythmia class on the test set. Multi-class Classification. For classification of four types of rhythms (for which the probability densities vary as shown in Fig. 3(b)), again, the parameters were tuned in the same way as explained in binary classification. The results show overall 96.94% accuracy, and average (and best respectively) classification for 95.98% (and 98.89%) of NSR, 82.05% (and 100%) of VB, 98.51% (and 99.23%) of AF and 98.92% (and 99.20%) of NR rhythms. The results for multi-class classification can be summarized as the confusion matrix of four classes and sensitivity & specificity of each class as given in Table 1. We also used the features derived from Fourier analysis, as mentioned in introduction, with SVM classification for comparison with our method. Fourier analysis(by selecting best 300 features) gives average correct classifications respectively 86.48%, 89.33%, 95.7% and 96.74% for the above four classes. H¨older-SVM methodology was found to provide superior performance. An interesting point to note is that in both the binary and multi-class classification, we used data provided by both sensing leads. It was observed that even if we use just a single lead data, classification
3
3
Probability Densities
Probability Density
2.5
2
1.5
1
0.5
2.5
NSR VB AF NR
2
1.5
1
0.5
0 −0.5
0
0.5
1
Local Holder Exponents
(a) 12 highlighted points.
1.5
0 −0.4
−0.2
0
0.2
0.4
0.6
0.8
1
Local Holder Exponents
(b) Densities for four classes.
Table 1. confusion matrix (avg.case) NSR VB AF NSR 31.93 0.70 0.51 VB 0.62 3.69 0.18 AF 0.84 0 31.75 NR 0.48 0 0.15 Avg 96.04 82.11 97.42 Sensitivity Best 98.29 100 99.23 Avg 97.1 99.27 98.75 Specificity Best 98.89 100 99.63
NR 0.11 0 0 29.01 97.9 99.20 99.84 99.64
Fig. 3. probability density of local H¨older exponents.
gives results with comparable accuracy. Arrhythmia being a disorder in the normal rhythm, can thus be captured in any of the two leads.
4 Conclusion In this study, it is demonstrated that support vector machine in conjunction with wavelet transform modulus maxima based local singularity feature extraction provides an excellent combination in arrhythmia classification. The recognition of the normal and different types of rhythms representing the arrhythmias has been done with a good accuracy. These investigations show that the presented method may find practical application in the recognition of many more types of arrhythmias. Acknowledgment. We gratefully acknowledge the financial assistance provided by Department of Science and Technology, New Delhi, INDIA.
References [1] Morchen, F.: Time series feature extraction for data mining using DWT and DFT. Technical Report 33, Dept. of Mathematics and Computer Science, Philipps-University Marburg., Germany (2003) [2] Owis, M., Abou-Zied, A., Youssef, A.B., Kadah, Y.: Robust feature extraction from ECG signals based on nonlinear dynamical modeling. In: 23rd Annual Int. Conf. IEEE Eng. Med. Biol. Soc. (EMBC’01). Volume 2. (2001) 1585–1588 [3] Scafetta, N., Griffin, L., West, B.J.: H¨older exponent spectra for human gait. Physica A: Statistical Mechanics and its Applications 328 (2003) 561–583 [4] Struzik, Z.R., Siebes, A.P.J.M.: Outlier detection and localisation with wavelet based multifractal formalism. Technical Report INS-R0008, CWI (2000) [5] Struzik, Z.R.: Revealing local variability properties of human heartbeat intervals with the local effective H¨o lder exponent. Fractals 9 (2001) 77–93 [6] Muzy, J., Bacry, E., Arneodo, A.: The multifractal formalism revisited with wavelets. International Journal of Bifurcation and Chaos 4 (1994) 245–302 [7] Hwang, W.L., Mallat, S.: Characterization of self-similar multifractals with wavelet maxima. Applied and Computational Harmonic Analysis 1 (1994) 316–328 [8] Arneodo, A., Bacry, E., Muzy, J.: The thermodynamics of fractals revisited with wavelets. Physica A: Statistical and Theoretical Physics 213 (1995) 232–275
[9] Struzik, Z.R.: Removing divergences in the negative moments of the multi-fractal partition function with the wavelet transform. Technical Report INS-R9803, CWI (1998) [10] Struzik, Z.R.: Determining local singularity strengths and their spectra with the wavelet transform. Fractals 8 (2000) [11] Vapnik, V.: The nature of statistical learning theory. Springer-Verlag, New York (1995) [12] Kulkarni, A., Jayaraman, V.K., Kulkarni, B.D.: Support vector classification with parameter tuning assisted by agent based techniques. Computers and Chemical Engineering 28 (2004) 311–318 [13] Mitra, P., Uma Shankar, B., Sankar, K.P.: Segmentation of multispectral remote sensing images using active support vector machines. Pattern recognition letters 25 (2004) 1067–1074 [14] Hsu, C.W., Lin, C.J.: A comparison of methods for multiclass support vector machines. IEEE Transactions on Neural Networks 13 (2002) 415–425 [15] Novak, D., Cuesta-Frau, D., Eck, V., Perez-Cortes, J., Andreu-Garcia, G.: Denoising electrocardiographic signals using adaptive wavelets. BIOSIGNAL (2000) 18–20 [16] Chang, C.C., Lin, C.J.: LIBSVM: a library for support vector machines. (2001)