Oct 10, 2004 ... personality match affects performance; and if such a relationship exists it is likely
.... While the literature of the empirical effectiveness of styles of.
Assessing Effectiveness of Personality Style in Documentation Kenneth Sayles.
David G. Novick
Department of Computer Science The University of Texas at El Paso El Paso, TX 79968-0518 +1 915-747-5480
Department of Computer Science The University of Texas at El Paso El Paso, TX 79968-0518 +1 915-747-6952
[email protected]
[email protected]
ABSTRACT
broadly, including ways of understanding whether guidelines for style, such as use of the active voice, lead to actual improvements in effectiveness of documentation.
This paper extends previous work by other researchers that indicated that users of computers preferred a computer with a personality that was similar to theirs. We conducted a similar experiment, but looking beyond preference to see if the personality of documentation would make a difference in the user’s performance. Our data suggest did not indicate that personality match affects performance; and if such a relationship exists it is likely to be weak. We discuss the related research, describe our methodology, present our results, and describe their implications and limitations.
In this paper, we briefly review the characteristics of introverted and extroverted personality types, review prior research in preferences for personality match in user interfaces, describe our methodology for assessing the effect of personality match of documentation on task performance, present our results, and describe their implications and limitations.
2. PERSONALITY
Categories and Subject Descriptors
Before reviewing related work tying personality to computing, we first review some standard terms for classifying personalities and introduce the law of similarity-attraction, described simply as, “Birds of a feather flock together.”
H.5.2 [Information Interfaces and Presentation]: Use interfaces – Training, help and documentation, theory and methods.
General Terms
According to Morris [8], “One’s personality may be taken to be the combination of his or her more or less pervasive and stable behavior patterns that are reflective of his or her individuality as a person” [3]. Generally, extroverts, or extraverts, are described as outgoing, friendly, and confident. Introverts are shy and more inwardly focused.
Documentation Management, Human Factors
Keywords Documentation, personality, effectiveness
1. INTRODUCTION Prior research suggests that humans respond socially to computers and that they prefer computers similar to themselves. However, it is not clear if this phenomenon actually produces differences in performance. Our study addresses this question by looking at whether users interacting with a computer similar to them, in terms of extroversion and introversion, work better and more. We adapted an experiment conducted by Reeves and Nass (1998) to look at performance rather than preference. Specifically, we assessed improvement in a judgment task after interaction with tutorial-style documentation that was written to reflect either an introverted or extroverted personality type. The issues addressed in this paper have implications for producers of tutorials and of documentation more
Permission to make digital or hard copies of all or part of this work for personal or classroom use is granted without fee provided that copies are not made or distributed for profit or commercial advantage and that copies bear this notice and the full citation on the first page. To copy otherwise, or republish, to post on servers or to redistribute to lists, requires prior specific permission and/or a fee. SIGDOC’04, October 10–13, 2004, Memphis, Tennessee, USA. Copyright 2004 ACM 1-58113-809-1/04/0010...$5.00.
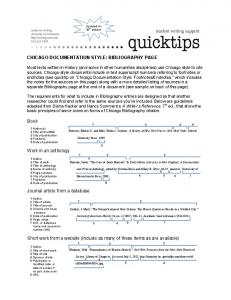
Figure 1. Personality Relations
75
submissive people will recognize the submissive computer as more like them than the dominant computer.
Figure 1, from Eysenck’s Eysenck On Extraversion, shows the classical four temperaments. It shows how certain descriptions are connected with the different personality types. The left side of the diagram focuses more on introverts, and the right side of the diagram focuses more on extroverts.
Rule 3: Dominant people will prefer the dominant computer, while submissive people will prefer the submissive computer. ([10] 91)
We first examine the extrovert personality. Morris [8] notes that “Eysenck’s extravert then is described as sociable, lively, impulsive, seeking novelty and change, carefree, and emotionally expressive” (8). Laverty [6] states “’Extraverted behaviour’ is characterized clinically by the outward expression of feelings and attitudes, in words, gestures, and acts, in a spontaneous and direct manner, little impeded by reflection, indecision or reserve” (35). The general consensus is that extroverts are outgoing, energetic, spontaneous, and impulsive. In terms of behaviors, extroverts find leisure important, prefer person-oriented vocations, like social worker or credit manager, and seek stimulations, such as high-risk activities [8]. This study focused on extroverts as more confident, assertive, and direct than introverts.
To confirm or disconfirm these rules, Reeves and Nass had subjects complete a task while aided by either a dominant computer or a submissive computer. First, they tested 200 people for dominant and submissive personalities. From this pool, they formed two groups of 24; one consisting of the strongest dominant personalities and the other consisting of the strongest submissive personalities. All subjects completed the “Desert Survival” problem individually [10]. The “Desert Survival” problem asks participants to imagine themselves in a desert survival situation and rank twelve items in terms of usefulness in the situation [10]. While there are no obvious right or wrong answers in this exercise [10], the answers can be evaluated when matched against the experts’ ranking.
Next, we look at the introvert personality. Morris [8] noted “In contrast, the introvert is quiet, introspective, intellectual, well ordered, emotionally unexpressive, and value oriented; prefers small groups of intimate friends; and plans well ahead” (8). Laverty [6] states, “The contrary, ‘introverted behaviour’, comprises a tendency to limit or moderate spontaneous outward expression, reflection, preoccupation and rumination rather predominating. A reserved or even withdrawn attitude may be maintained” (35). Generally, introverts are more inwardlyfocused, shy, less expressive, and more ordered [8]. This study focused on introverts as less confident and less assertive than extroverts.
After each individual completed the task, he or she worked with either a dominant computer program or a submissive computer program to go over the task and re-rank the items. For the experiment, Reeves and Nass created dominant and submissive computer programs by adjusting the language style of the interface, having differing confidence levels in how the computers made suggestions, changing whether or not the computer initiated interaction first, and how each computer was named [10]. One example of the language style was in the help statements made by the programs: While each computer offered identical advice, each computer program’s language style differed from the other. The dominant computer program’s style was more confident and assertive than the submissive computer program’s style. Each computer also offered numerical rankings that indicated how confident it was in the suggestion it made. For example, the dominant computer program “Max” typically offered higher confidence rankings than the submissive computer program “Linus,” which indicated that “Max” was more confident in its suggestions [10]. The higher confidence ranking was used to show more dominance in “Max” than “Linus.” “Max” would also always begin the interaction with the subjects first, showing more assertiveness than “Linus” as it would wait for the subjects to begin the interaction [10]. Half of the dominant subjects worked with “Max” and the other half worked with “Linus.” The submissive subjects were divided similarly. After working with the computer and re-ranking the items in the task, each subject answered questions about the computer and his or her interaction with it.
Finally, let us look at the law of similarity-attraction. According to Reeves [10], “People like to interact with personalities that resemble their own. In psychology, this is known as the ‘law of similarity-attraction’” (90). Others who articulated this principle include Johnson [5], who stated, “That interpersonal attraction is strongly determined by perceived similarity is a well substantiated finding …” (227). The law of similarity-attraction means that people are drawn to others by similarities. This study focuses on extroverts preferring extrovert computer personalities and introverts preferring introvert computer personalities.
3. RELATED WORK While the literature of the empirical effectiveness of styles of documentation is not large, there are related results from psychology that can inform documentation design. In particular, Reeves and Nass studied personality recognition and acceptance by conducting an experiment that examined whether people could recognize that a computer had a personality and whether or not it was similar to their own [10]. Another objective of the experiment was to see if people preferred working with a computer that exhibited the same personality as themselves. Reeves and Nass predicted their experiment would confirm three rules:
The results of the experiment showed that users saw the dominant computer “Max” as more aggressive, authoritative, and confident and the computer “Linus” as more submissive, shy, and timid [10]. These results mean that users could distinguish the personality traits of the computer, as intended by Reeves and Nass through the language used by the computer, lending support to Rule 1. Users also noticed when the computer programs were like them, which supported Rule 2. The subjects also preferred working with the program that matched them personality-wise, supporting Rule 3.
Rule 1: People will perceive a computer that uses dominant text as having a dominant personality, and a computer with submissive text as having a submissive personality. Rule 2: Dominant people will say that the dominant computer is more like them than the submissive computer, and
76
preference, then the cost and effort to correct the personality in an interface may be more than its worth.
3.1 Personality in Embodied Agents Nass, Isbister and Lee investigated how people react to personality consistency in embodied conversational agents. A large group of people were tested for their personality types. From these, forty people were chosen and divided into two groups: one group of 20 extroverts and the other group of 20 introverts [9]. The subjects were asked to complete the “Desert Survival” problem individually. After completing their initial ranking for the items in the “Desert Survival” problem, subjects worked with one of four embodied conversational agents that used both verbal and visual personality cues [9]. Nass, Isbister and Lee created the extroverted computer character as assertive, more confident, and outgoing and the introverted computer character as timid and less social [9]. An example of their verbal manipulations is
This study focused on determining whether a person works better with documentation of similar personality or documentation of opposite personality. For this reason, extrovert and introvert personalities were chosen because they are essentially opposites. A term that describes the extrovert personality can be reversed to describe the introvert personality. Since Nass and his colleagues showed that people prefer computers of similar personalities, we conjectured that this extra comfort would help a person work more effectively. Consequently, if a person worked with the tutorial with opposing personality, we conjectured that he or she would not work as well as a person who used the tutorial with similar personality.
For example, the introverted computer character would display the following text: “What about maybe rating the pistol a bit higher? It seems like by the end of the second day, speech may be seriously impaired. Perhaps the pistol could be used as a signaling device?” In contrast, the extroverted character would display the following text: “Friend, I’d say the pistol should definitely be rated higher. By the end of the second day, speech will be impaired and the pistol will be an important signaling device.” ([9] 390)
4. METHODOLOGY We formed four hypotheses. First, we hypothesized that introvert users would complete a task more correctly with the help of documentation that displays introvert characteristics. Second, we hypothesized that extrovert users would complete the task more correctly with the help of documentation that displays extrovert characteristics. Conversely, since prior research indicated that users do not prefer working with computers dissimilar to themselves, it was reasonable to conclude that they will not work as well with documentation that displays a dissimilar personality type. Thus third, we hypothesized that introvert users would complete a task less correctly if assisted by documentation that displays extrovert characteristics. And fourth, we hypothesized that extroverts would complete a task less correctly if assisted by documentation that displays introvert characteristics.
After working with the agent, each subject ranked the items a final time and completed a questionnaire about the character and the interaction [9]. The results of the experiment suggested that the subjects could identify the verbal and visual personality cues as extroverted or introverted [9], which correspond to the results found by Reeves and Nass in their previous study [10]. The experiment also showed that subjects preferred the agents that were personality consistent over those that were inconsistent [9]. Subjects also preferred the interaction when the consistent agent matched them in personality, and subjects were more likely to change their rankings to those of the agent when the consistent agent matched them [9].
The design for this study was to test subjects in two equal groups: the subjects who worked with the tutorial with the same personality as their own (Group 1) and the subjects who worked with the tutorial with the opposite personality as their own (Group 2). For the above hypotheses to be true, Group 1 had to show greater improvement in the task than Group 2. This result would indicate that subjects improved better when working with a tutorial of the same personality. Since both tutorials would give more information to the subjects and the subjects would repeat the task, it was reasonable to assume that there would most always be improvement. However, if the hypotheses were correct, a person who worked with the similar personality tutorial would understand and absorb the information better, thus improving at the task better than a person who worked with the tutorial with the different personality.
3.2 Open Issues In both previous studies, subjects felt more confident in their solutions when they worked with computer personalities that matched them. But, it is not clear if subjects actually were more successful when working with such personalities. That is, even users enjoy documentation of a certain style, does that documentation actually help them to any greater degree? As noted before, personality can show up in documentation and related or component elements such as error messages, tutorials, prompts and menus. For example, there are over 100 different error messages in Microsoft’s Windows XP Home Edition [12]. To completely modify a program for different personalities is an enormous task. It may not be worth the time and cost to modify a program in this way if the users only perceive that they work better with computers of their own personality. However, if users actually work better and more successfully with computers of their own personality, the effort to modify a computer and mainstream computer personalities may be justified. Reeves and Nass noted the major problem with most interfaces is that they contain many personalities and are not consistent [10]. However, if having consistent computer personalities is only a matter of
The first step in this experiment was to test the subjects for extrovert and introvert personalities. Thirty-five students in the University of Texas at El Paso (UTEP) Computer Science Department were tested with a modified Eysenck Personality Inventory [4]. This test produces a score of up to 20 points. The closer the score is to 20, the more extroverted the person who took the test. For this study, anyone who scored a ten or less was considered introverted and any score over ten was considered extroverted. The test was administered before subjects engaged in the “Adventure in the Amazon” problem. Figure 2 shows the distribution of personality among the valid subjects. There was a clear trend towards the upper portion of the personality scale.
77
For this experiment, a Web-based format was chosen so that users could control the interaction, so neither computer tutorial started the interaction first. Additionally, the subjects were not aware of the names of the computer tutorials. Eliminating the names was helpful because subjects were not scored on the personality test until after the tasks were completed. And, more to the point, our focus on a single aspect of the personality difference enabled a methodologically clearer assessment of whether the personality style of documentation alone could produce noticeable differences in its effectiveness. Unlike like both of the previous studies, which administered the personality tests before forming the groups ([9], [10]), the personality tests in this study were administered at the same time as the exercises because of the limited availability of subjects and the complexity of their schedules. After the subjects completed the second ranking, they answered a short survey about their experience,
Number of Subjects (Out of 32)
Subjects' Personality Distribution 8 7 6 5 4 3 2 1 0 1 2 3 4 5 6 7 8 9 1011121314151617181920 Personality Score
Figure 2. Subjects’ Personality Distribution The second step was for each subject to complete the “Adventure in the Amazon” problem [11] without help or other documentation. The “Adventure in the Amazon” problem was chosen for this study for several reasons. First, it is very similar to the “Desert Survival” problem from both of the previous studies in that subjects rank items in terms of usefulness in a survival problem. Second, a jungle survival problem would likely be more interesting than a desert survival problem to subjects who, being in El Paso, already live in a desert. Using the “Adventure in the Amazon” problem also provided the advantage that most subjects probably did not have prior knowledge of jungle survival. After each subject completed the “Adventure in the Amazon” problem, he or she worked with either “Ichabod,” the introverted tutorial, or “Elmo,” the extroverted computer tutorial, to re-rank the items in the problem. The subjects were assigned to a tutorial prior to beginning the personality test.
5. RESULTS Thirty-five subjects completed the experiment. Of these 35 experiments, three results were discarded because the “Adventure in the Amazon” rankings were done incorrectly. Of the remaining 32, there were 13 extroverts who used “Elmo,” 14 extroverts who used “Ichabod,” and five introverts who used “Elmo.” No introverts used the introvert tutorial. Due to limited availability the subjects were assigned to the tutorials prior to completing the experiment. It was simple luck of the draw that none of the introverts ended up using “Ichabod.” The data were analyzed in three different ways. Analysis I followed our original experimental design using ten as the median for the personality test. In this analysis, personality scores of ten or below were considered introvert, while anything above ten was considered extrovert. In Analysis II; however, the median for the personality test was set at 15. This new median was determined by finding the median of the subjects’ scores. More accurately, the two groups were classified as “more extroverted” and “more introverted.” This analysis is reasonable because all people exhibit traits of both introversion and extroversion, even though one aspect will dominate over the other [8].
Both “Ichabod” and “Elmo” were Web-based tutorial-style documentation. These tutorials were identical, except in their language style. For example, a statement from “Ichabod” about the “aluminum pan” item was “It seems that the aluminum pan could be used to catch rainwater. Maybe you could use it to reflect the sun to signal planes. You might want to consider these points in your ranking.” For the same item, “Elmo” stated “You will definitely want the aluminum pan to catch rainwater. You will also want it to reflect the sun to signal planes. You should definitely consider these points in your ranking. You don't want to forget this information.” Both gave the same content (adapted from [11]), but in different ways. “Ichabod” was more timid and less assertive than “Elmo” in the language, reflecting the lower confidence and more conservative nature of introverts as compared to extroverts.
Analysis III used linear regression to look for a relationship between a subject’s improvement and the difference between the subject’s personality and the tutorial he or she used. The difference between the personality and tutorial used was determined in the following manner: 1) the extrovert tutorial factor was set at 20 and the introvert tutorial factor was set at zero, as these numbers represented the extremes of the personality test used in the study; 2) a subject’s personality test score was subtracted from the tutorial factor if he or she used the extrovert tutorial; and 3) the tutorial factor was subtracted from a subject’s personality test score if he or she used the introvert tutorial. This relation, known as the eiscore in the analysis, was developed as a means to correlate how well a subject matched to the tutorial he or she used in the experiment. For example, if the eiscore was zero, then there was no difference between the subject’s personality and the tutorial he or she used. The larger the eiscore, the more difference there was between the subject’s personality and the tutorial he or she used. The following sections show the results of the analyses.
One important note is that the tutorials did not use all of the techniques used in the original experiments. Reeves and Nass and Nass, Isbister and Lee used language to create the computer personalities, just as in “Ichabod” and “Elmo.” But, in the Reeves and Nass study, the dominant computer would begin the interaction first, while the submissive computer would wait for the user. Also, the computers offered confidence ratings for the suggestions in the “Desert Survival” problem, and the users knew the names of the computers as “Max” and “Linus.” In the Nass, Isbister and Lee study, visual personality cues were used as well as verbal cues. Their agents also began the interaction first and offered their own solutions to the problem.
78
it is not enough to be significant. Analysis II below looked at the experiment results differently.
5.1 Analysis I: Median = 10 Under Analysis I, there were 13 extroverts who used the extrovert tutorial, 14 extroverts who used the introvert tutorial, and five introverts who used the extrovert tutorial. This grouping is the original grouping shown in Tables 1, 2, and 3. The summary statistics for these three groups under this analysis are shown in Table 1.
5.2 Analysis II: Median = 15 In our second analysis, we achieved a more balanced distribution of the subject population by considering relative rather than absolute personality. That is, instead of grouping subjects as extrovert/introvert, we grouped them as more-extrovert/lessextrovert by changing using a personality test score of 15 (rather than the theoretically neutral 10) as the dividing value between groups. Under Analysis II, there were four more-extroverts who used “Elmo,” six more-extroverts who used “Ichabod,” 14 lessextroverts who used “Elmo,” and eight less-extroverts who used “Ichabod.” The summary statistics for Analysis II are presented in Table 4.
Improvement
Personality-Tutorial Group
N
Average
Std Dev
Extrovert,Elmo
13
20.62
8.26
Extrovert,Ichabod
14
14.71
13.40
Introvert,Elmo
5
17.60
9.94
Table 1. Analysis I Summary Statistics The column “Average” shows the mean improvement for each group. The extroverts who used the extrovert tutorial have the largest average improvement, which indicates they improved the most overall, while the extroverts who used the introvert tutorial improved the least. The column “Std Dev,” shows the standard deviation, which indicates the variability in the improvements for each group. The larger this number is the more variable were the improvements. The extroverts who used “Elmo” had the least variability. Table 2 shows the Analysis of Variance Table for Analysis I. Source
DF
Sum of Squares
Mean Square
F Value
p-value
Model
2
234.7
117.4
0.96
0.3949
Error
29
3547.1
122.3
Corrected Total
31
3781.9
Extrovert-Ichabod
10.8
Introvert-Elmo
17.6
Std Dev
More-Extrovert, Elmo
4
17.00
6.22
More-Extrovert, Ichabod
6
8.33
15.41
Less-Etrovert, Elmo
14
20.57
9.16
Less-Extrovert, Ichabod
8
19.50
10.13
Source
DF
Sum of Squares
Mean Square
F Value
p-value
Model
3
669.1
223.0
2.01
0.1359
Error
28
3112.8
111.2
Corrected Total
31
3781.9
Table 5. Analysis II Analysis of Variance Table The differences were analyzed exactly as the differences in Analysis I. And, although at 0.1359 the p-value is closer to 0.05, this analysis still did not confirm the hypotheses were correct. To show this point further, consider the following table using the average improvements from the groups.
Average Improvement 18.4
Average
Table 4. Analysis II Summary Statistics
Because the p-value is 0.3949, the relationship between personality differences and performance cannot be considered significant. What this means is that under this analysis, the hypotheses cannot be considered correct. To illustrate this point further, consider the following table developed from comparing the top five subjects in each group.
Extrovert-Elmo
N
Here we see that subjects who were relative introverts (“LessExtrovert”) who used “Elmo” had the largest improvement, while the extroverts who used “Ichabod” had the least improvement. The extroverts who used “Elmo” had the least variability, and the extroverts who used “Ichabod” had the most variability. Table 5 shows the Analysis of Variance Table for Analysis II.
Table 2. Analysis I Analysis of Variance Table
Personality-Tutorial Group
Improvement
Personality-Tutorial Group
Tutorial
Table 3. Top Five Comparisons The table was formed using the strongest extroverts and the strongest introverts and their average improvements. The two groups that used the extrovert tutorial are not that different in performance, showing the lack of a significant relationship between a subject’s performance and the computer personality he or she used. The extroverts who used the extrovert tutorial showed more improvement than those who used the introvert tutorial, but
Personality
Elmo
Ichabod
More-Extrovert
17.0
8.3
Less-Exrovert
20.6
19.5
Table 6. Comparison of Average Improvements For the hypotheses to be correct, the sum of the averages on the diagonal going from the top left to the bottom right should be significantly greater than those on the opposite diagonal. The difference of 7.4 is not significant, considering two subjects had improvements of 32 during their second exercise trial. In fact, in
79
one case, the comparison is backwards as the introverts who used the extrovert tutorial improved better than those that used the introvert tutorial. This result was not consistent with Hypotheses 1 and 3.
Scatter Diagram of the Improvement versus Eiscore 40
5.3 Analysis III-Linear Regression Using the eiscore, Analysis III used a simple linear regression to find a possible relationship between the eiscore and the exercise score difference. To confirm the hypotheses, a line with a negative slope was needed, which would indicate that a person’s performance on the exercise would lessen as the difference between that person’s personality and the personality of the tutorial he or she used increased. Table 7 shows the results of Analysis III.
IMPROVEMENT
30
According to Table 7, a negative slope was found in the parameter estimate, but the relationship was weak, so there was no significance. This same property is shown in Table 8, which shows the analysis of variance, similar to Analyses I and II. The pvalue of 0.2094 is still not significant, which shows there is no significant relationship between a person’s performance and the personality of the computer he or she uses.
DF
Parameter Estimate
Standard Error
t Value
p-value
Intercept
1
22.57
4.36
5.18