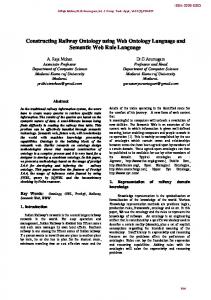
The Rail Technology Unit
Assessing Railway Vehicle Derailment Potential using Neural Networks Iwnicki S.D, Stow J, Parkinson H.
This article was download from the Rail Technology Unit Website at MMU Rail Technology Unit, Manchester Metropolitan University, Department of Engineering & Technology, John Dalton Building, Chester Street M1 5GD, Manchester, United Kingdom http://www.railtechnologyunit.com
Assessing railway vehicle derailment potential using Neural Networks 1.
Simon Iwnicki1, Howard Parkinson2 & Julian Stow1 Rail Technology Unit, Manchester Metropolitan University 2. Kennedy and Donkin Ltd.
ABSTRACT Current methods for ensuring the safe running of railway vehicles assess the track and vehicle condition against fixed limits. Any exceedence of these limits requires remedial action to be taken. The setting of these limits is based on past experience or on computer modelling of vehicle track interaction. This paper describes the initial results of a novel method aimed at predicting vehicle behaviour from track measurements using an artificial neural network. The speed of the neural network method would allow quick analysis of all the data measured by the track recording coach and would also allow maintenance decisions to be based on the effect of track condition on the vehicle behaviour rather than on simple limits. 1. INTRODUCTION Track recording vehicles regularly measure the vertical and lateral displacement of each rail, amongst other variables. Warnings are given when certain levels of irregularity are exceeded and simple algorithms are used to detect scenarios such as "cyclic top", which is known to contribute significantly to derailment risk. Thresholds are set on the basis of past experience but to ensure safety this can often result in a high number of false alarms. Additionally there is potentially a huge volume of data provided by the track recording vehicles which is difficult and labour intensive to analyse manually. Specialised computer modelling using packages such as VAMPIRE or MEDYNA can be used to predict the response of a vehicle to the particular track and to calculate the derailment ratio but this is time consuming and cannot realistically be carried out for all measured data and for all vehicle types. The main input to the model of a rail vehicle is the rail alignment in the vertical and lateral directions and the variation in cross level and possibly gauge. This input is made up of random, periodic or deterministic components. Periodic components depend on rail section lengths between fishplated joints (if present), sleeper spacing, ground undulations and other regular features of the track. Random and discrete variations also exist in these inputs, for example track roughness and damaged rails. The tangential forces between the wheel and rail are calculated according to the methods
developed by Kalker [1] and require a description of the wheel and rail cross sectional geometries. The likelihood of derailment is affected by the vehicle suspension as well as the track condition and assessment of derailment potential is not simple. Assessment is normally based on the derailment quotient (lateral/vertical force) at each wheel or on the level of wheel unloading. The speed of the Neural Network NN method would allow all measured track to be effectively filtered and track likely to cause derailment of a particular vehicle be immediately flagged at the time of measurement The intelligence of the system allows complex interactions to be included rather than the simple limits currently used. This will allow better direction of the available track and vehicle maintenance efforts and should lead to safer running. Indications can also be given for likely levels of passenger comfort when a vehicle runs over the section of track. To validate the method actual derailment cases need to be used to assess how accurately the NNs would have predicted the occurrence. 2. THE NEURAL NETWORK A neural network is an interconnected assembly of simple processing elements, units or nodes, whose functionality is loosely based upon the human neuron. The processing ability of the network is stored in the inter-element connection strengths or weights, obtained by a process of adaptation to, or learning from, a set of training data. NNs are trained by inputting variables that correspond to known outputs. The network is initialised for training by assigning random weightings to the interconnections. If the NN gives the expected FUNCTION SUM OUTPUT 1 output, the weights of the connections leading to BIAS INPUT 1 that output are strengthened. If an FUNCTION INPUT 2 SUM OUTPUT 2 unexpected output is INPUT 3 given, the weights are BIAS weakened. In this way the network can be taught to FUNCTION SUM OUTPUT 3 predict the output which will be the response to a BIAS new set of input data. A simple neural network FUNCTION SUM OUTPUT n consisting of 1 layer of 4 neurons each with 3 inputs BIAS is shown in figure 1. WEIGHTING
WEIGHTING
WEIGHTING
WEIGHTING
WEIGHTING
WEIGHTING
Figure 1. A layer of neurons
The basic neuron consists of a set of inputs each multiplied by a weighting factor before being summed and passed to the output via a simple transfer function. This function can be a go/no-go switch, a linear multiplier or any other suitable function. There is also an offset or bias available that can be applied to the sum of the weighted inputs. The neurons are assembled into layers and the sets of weighting and bias values govern the way that the output values relate to the input values for the whole layer. The proposed intelligent track monitoring system is shown in figure 2. Actual Derailment LINKS WEAKENED
NO LINKS STRENGTHENED
YES
Validation
vehicle specific neural network vehicle specific neural network
Labelled track data
signal processing
vehicle specific neural networks
Correctly predicted
?
simulation
track data
derailment quotient derailment quotient
TRV
derailment quotient etc.
Figure 2. The proposed intelligent track monitoring system
Neural networks have been used in a wide variety of applications where complex systems need to be analysed and where a mathematical modelling method or a rule based analysis is not possible or is difficult to set up. Examples are pattern recognition or identification of abnormalities in biological or engineering systems. In the railway field NNs have been used to identify faults or to assist in optimising design [3]-[5]. Horwitz and El-Sibaie [2] proved that a neural network could match the prediction by a simple mathematical model of the dynamic vertical wheel load of a railway vehicle. In this work the computer package MATLAB has been used to set up a suitable neural network. MATLAB offers a variety of basic neuron elements which can be built up into a network and then trained using data in files corresponding to the input and the required output.
3. TRAINING THE NEURAL NETWORK
Matlab offers an automatic training process where the input file is presented to the network and the weighting and bias values for the are optimised so that the required output is produced. In this work the input is real track recording coach data and the outputs are the wheel rail forces and the derailment quotient at each wheel calculated by a MEDYNA model of a Mk3 passenger coach with BT10 bogies. All data files are normalised before submission to the Network and rescaled after the prediction. Training takes place over a number of cycles or epochs and the number of epochs required to find the optimum values depends on the size of the NN and the acceptable level of the error.
O U T P U T
I N P U T
INPUT LAYER
RECURRENT LAYER
OUTPUT LAYER
The size of the Neural Network and the arrangement of the links between the neurons is important as it governs the way that the input and output relationships can be formed. In this work the input and output are time series and the output needs to be
Figure 3. Recurrence in a neural network
influenced by the previous values of the input and not just the current value. The Elman network provided by MATLAB was chosen for this work. It has a hidden layer with feedback (or recurrence) from the output. The hidden layer has transfer functions of the tansig type and an output layer with linear transfer functions was also used. Figure 3. shows the general layout of a neural network with recurrence. 4. THE MEDYNA MODEL The training data for the neural network was prepared by running a simulation of a typical passenger coach on measured track. The vehicle chosen was a Mk3 coach with BT10 bogies with primary coil springs and hydraulic dampers on swing arms at the primary suspension and air springs at the secondary suspension. The model included representation of the primary and secondary suspension and the simulation package calculated the non-linear wheel-rail forces at
A
BODY
BOLSTER
BOLSTER WHEELSET SWING ARM
BOGIE
SWING ARM
A
SCRAP SECTION A-A
Mk3 Coach model BT10 Bogies
B O L S T E R
NB. Rail model omitted for clarity. Not all interconnections are shown in all views
Figure 4 Medyna model of Mk3 Coach
each time step based on a description of the cross sectional geometry of the wheel and rail and using the contact program FASTSIM. The simulation took about 10 hours and data files including the vertical and lateral rail displacements at each wheel and the outputs such as the vertical and lateral wheel-rail forces and their ratio and the acceleration in the main body of the vehicle were prepared after the run. The vehicle model is shown in figure 4. 5. RESULTS Sum-Squared Network Error for 1500 Epochs
5
10
4
Sum-Squared Error
10
3
10
2
10
1
10
0
500
1000 Epoch
Figure 5. training the neural network
1500
In practice the amount of feedback provided by the Elman network was found not to be sufficient to give good results. In recognition of the fact that the vehicle behaviour is very much influenced by the section of track that has just been passed over, it was decided to use a number of the previous data points from the track input file as inputs to the NN. This dramatically improved the ability of the network to match the required output. The reduction in the error as a typical training session progresses is shown in figure 5.
The NN took about 500 epochs to train and this training took about 1 hour on a 200 MHz Pentium processor. Running the network once trained is very fast with each 125m section of track taking less than 1s of processor time. This would mean that the output could be predicted at any reasonable measuring speed of a track recording coach. Once the NN has been trained and gives satisfactory results with the training data unseen data is used as a test of the effectiveness of the network. The results presented below show that for a NN with 80 neurons in the recursive layer and with 120 preview points the prediction of the vehicle behaviour on track not previously seen by the NN is impressive. Vehicle speed is 20ms-1. The plots show the load and derailment quotient predicted by the NN and the equivalent values from the MEDYNA simulation against distance along the track. The predictions of vertical load are generally within 10% but the lateral forces seem less easy to predict with large errors in some peak values.
1.5 Training data NN output
1
0.5
0
-0.5
-1
-1.5 0
Figure 6. Vertical force at left wheel. (N) against distance (m).
100
200
300
400
500
600
700
800
900
1000
Figure 6. normalised vertical force at left wheel against distance (m). Training data and NN output (40 recurrent neurons and 80 preview points)
1.5 Training data NN output
1
0.5
0
-0.5
-1
-1.5 0
100
200
300
400
500
600
700
800
900
1000
Figure 7. Normalised vertical force at left wheel against distance (m) Training data and NN output (80neurons and 80 preview points)
0.6 Training data NN output
0.4
0.2
0
-0.2
-0.4
-0.6 10
20
30
40
50
60
70
80
90
Figure 8. Normalised vertical force at left wheel against distance (m) Training data and NN output (80neurons and 120 preview points)
0.06 NN prediction
0.04 0.02 0 -0.02 -0.04 -0.06
Medyna simulation
-0.08 45
50
55
60
65
70
Figure 9. Lateral/Vertical force ratio at left wheel against distance (m)
CONCLUSIONS This preliminary study has shown that is is possible to use an artificial neural network to predict the response of a railway vehicle to measured track input. The prediction of vertical force made by a neural network from track data comes very close to that of a computer simulation using a detailed model of the vehicle suspension and non-linear wheel rail contact model. The prediction of the lateral force and therefore the important lateral/vertical force ratio is less good and further work on the network for the lateral prediction is required. The speed of the Neural network method should make it possible to filter a large quantity of measured track data and to focus maintenance effort on sections of track likely to excite dangerous or uncomfortable behaviour in vehicles. ACKNOWLEDGEMENTS : The authors would like to thank Railtrack and Serco Railtest for providing the measured track data.
REFERENCES [1]
Kalker J.J. ‘The computation of three dimensional rolling contact with dry friction’ Int. J. for numerical methods in Engineering Vol 14, 1979.
[2]
Horwitz D. and El-Sibaie M., ‘Applying Neural Nets To Railway Engineering’, AI Expert January 1995
[3]
Chow T.W.S. and Shuai O. ‘Feedforward Neural Networks Based Input-Output Models for Railway Carriage System Identification’, Neural Processing Letters 5: 127-137, 1997
[4]
Choromanski W. ‘Application of Neural Network for Intelligent Wheelset and Railway Vehicle Suspension Designs’, Vehicle System Dynamics Supplement 25(1996), pp 87-98
[5]
Gajdar T., Rudas I. and Suda Y. ‘Neural Network based Estimation of Friction Coefficient of Wheel and Rail’ IEEE 1997
The Rail Technology Unit The Rail Technology Unit based at Manchester Metropolitan University carries out research and consultancy into the dynamic behaviour of railway vehicles and their interaction with the track. We use state of the art simulation tools to model the interaction of conventional and novel vehicles with the track and to predict track damage, passenger comfort and derailment. Our simulation models are backed up by validation tests on vehicles and supported by tests on individual components in our test laboratory. We are developing methods to investigate the detailed interaction between the wheel and rail. January, 2004 Simon Iwnicki (RTU Manager)
Core expertise:
Vehicle Dynamics
Wheel/Rail Interface Engineering
Safety & Standards
•Railway vehicle suspension dynamics –Computer simulation –Lab and field testing •Wheel-rail interface modelling –Profile design –Wear –Rolling contact fatigue
Expert Services/ Project Co-ordination Research &Training
Lab Test & Instrumentation
The Rail Technology Unit Contact: General enquiries:
[email protected] RTU Manager email:
[email protected] RTU Manager Tel: +44 (0)161 247 6247 RTU Fax: +44 (0)161 247 1633 RTU Address: Rail Technology Unit, Manchester Metropolitan University, Department of Engineering & Technology, John Dalton Building, Chester Street M1 5GD, Manchester, United Kingdom The Rail Technology Unit Website: http://www.sci-eng.mmu.ac.uk/rtu or http://www.railtechnologyunit.com