European Journal of Radiology Open 4 (2017) 19–26
Contents lists available at ScienceDirect
European Journal of Radiology Open journal homepage: www.elsevier.com/locate/ejro
Assessing the validity of Prostate Imaging Reporting and Data System version 2 (PI-RADS v2) scoring system in diagnosis of peripheral zone prostate cancer Eman F. Dola a,∗ , Osama L. Nakhla b , Eman A.SH Genidi a a b
Radiology Department, Faculty of Medicine, Ain Shams University, Egypt Radiology Department, Faculty of Medicine, Beni Sueif University, Egypt
a r t i c l e
i n f o
Article history: Received 22 November 2016 Received in revised form 13 February 2017 Accepted 16 February 2017 Keywords: Multi-parametric magnetic resonance images (mp-MRI) Prostate cancer Transrectal US guided biopsy (TRUS-guided biopsy) Prostate Imaging Reporting and Data System version 2 (PI-RADS V2)
a b s t r a c t The purpose: Assessing the accuracy of multi parametric magnetic resonance (mp-MRI) after application of PI-RADS V2 for diagnosis of prostate cancer as comparison to pathological results of trans rectal ultrasound (TRUS) guided biopsy. Patients and methods: 138 prostatic lesions in 23 patients were retrospectively assessed and analyzed with Trans rectal ultra-sound (TRUS) guided biopsy results. Those patients underwent multi parametric magnetic resonance (mp-MRI) with application of PI-RADS V2 reporting system. The sensitivity, specificity, validity, negative predictive value and positive predictive value were calculated for PI-RADS V2 reporting system compared to biopsy-proven pathological results. Results: 92 out of 138 lesions were positive for Peripheral zone cancer prostate. PI-RADS V2 reporting system proved 88.04% sensitive & 93.4% specific for diagnosis of prostate cancer with negative predictive value & positive predictive value of 100%. Conclusion: Our results proved that mp-MRI of prostate using PI-RADS v2 scoring system had high sensitivity and specificity in diagnosis of prostate cancer and PI-RADS V2 scoring system using mp-MRI is recommended as a non-invasive diagnostic tool compared to TRUS guided biopsy. © 2017 Published by Elsevier Ltd. This is an open access article under the CC BY-NC-ND license (http://creativecommons.org/licenses/by-nc-nd/4.0/).
1. Introduction Prostate cancer ranks as the second most common cancer in male population with expected incidence doubling by 2030 [1]. Prostate cancer incidence increase with age, representing an incidence of 34% at 5th decade and reaching up to 70% at the age of 80.The demographic changes as increase in life expectancy, have resulted in the increased incidence of the prostate cancer. Yet the 5-years survival rates have increased in the past 25 years from 69% reaching about 99%. This could be attributed to the advancements in the early diagnosis and treatment of prostate cancer [2]. The major problem faced in the management of prostate cancer was the inability of early diagnosis of the cases that can be life threatening later on [3]. The techniques by and large used for the early detection of prostate cancers were digital rectal examination
Abbreviations: PZ, peripheral zone; CG, central gland; CZ, central zone; FOV, field of view; PSA, prostate- specific antigen; TZ, transition zone. ∗ Corresponding author. E-mail address: dr ema
[email protected] (E.F. Dola).
and serum prostate- specific antigen (PSA) levels and both were found to be suboptimal and insufficient for an early detection [4]. PSA was proved to be better than the digital rectal examination in diagnosis of prostate cancer yet it had low specificity (36%) due to its high false positive results in benign conditions as benign prostatic hyperplasia (BPH) and prostatitis [5,6]. Histopathological examination played the main role in determining the patient prognosis, but, even with staging and grading of cancer using histological assessment after radical prostatectomy, the outcome was variable [3]. The Gleason score was the pathological grading system used in cancer prostate. It was used for 40 years uptill now. It was considered as one of best prognostic factors in cancer prostate [7]. Trans-rectal U/S guided (TRUS) biopsies were used to define Gleason score before management of prostate cancer patients [7]. TRUS biopsies were accurate in defining Gleason score and became part of the routine screening system for the patient with suspected prostate cancer [7]. However, biopsy-proven Gleason grade was subject to sampling error. It was reported that after radical prostatectomy the biopsy- proven Gleason grade is increased in 54% of patients [8].
http://dx.doi.org/10.1016/j.ejro.2017.02.001 2352-0477/© 2017 Published by Elsevier Ltd. This is an open access article under the CC BY-NC-ND license (http://creativecommons.org/licenses/by-nc-nd/4.0/).
20
E.F. Dola et al. / European Journal of Radiology Open 4 (2017) 19–26
The diagnostic tools previously used were inaccurate for risk stratification so lead to less optimal choice for therapy. There was a cardinal need of a new diagnostic tool for prostate cancer that would help in early detection, localization and even sampling of lesions [5]. Magnetic resonance imaging (MRI) of the prostate is an emerging method for the detection of prostate cancer [9]. Recent advancements in multi-parametric magnetic resonance imaging (mp-MRI) that combine both anatomical and functional data have showed higher advantages in the detection and characterization of prostate cancer. Several studies have proven that functional imaging techniques improve the accuracy of MRI in detection and localization of prostate cancer [10]. Multi-parametric MRI (mpMRI) was MR prostate including T1 and high-resolution T2-weighted (T2w)sequences for morphological assessment combined with functional imaging (i.e. diffusion-weighted imaging (DWI), MR spectroscopy (MRS) and dynamic contrast enhanced imaging (DCE)) [9]. The European Society of Urogenital Radiology (ESUR) published a scoring system depending on data from mpMRI prostate which named Prostate Imaging Reporting and Data System (PI-RADS) with an aim to set standardized reports and techniques for interpreting mp-MRI [9]. Later on the American college of radiology, ESUR and AdMeTech foundation committee recognized limitation in PI-RADS scoring system and announced an updated version, PI-RADS V2 [1]. Spectroscopy was omitted in version 2 and DCE was given a minor role [11]. PI-RADS V2 utilizes a 5-point scale to estimate the likelihood of clinically significant cancer in each lesion and it is as following: – PI-RADS 1 – Very low (clinically significant cancer is highly unlikely to be present) – PI-RADS 2 – Low (clinically significant cancer is unlikely to be present) – PI-RADS 3 – Intermediate (the presence of clinically significant cancer is equivocal) – PI-RADS 4 – High (clinically significant cancer is likely to be present) – PI-RADS 5 – Very high (clinically significant cancer is highly likely to be present) [11] DWI represented the main sequence in assessment of PZ lesions, With the DCE represented the secondary sequence. Secondary sequence was used in cases with PI-RADS 3 score in primary sequences, which were then upgraded in score to PI-RADS 4 or kept as PI-RADS 3 depending on the data achieved from secondary sequence. DCE-MRI was interpreted as positive or negative focal enhancement with no curves as before [1]. For PI-RADS 5 scoring lesion should be >1.5 cm in size, with extra prostatic extension or invasion [1]. Our purpose was to assess the accuracy of multi parametric magnetic resonance (mp-MRI) after application of PI-RADS V2 for diagnosis of prostate cancer in comparison to pathological results of trans rectal ultra-sound (TRUS) guided biopsy.
2. Patients & methods This study conducted on 23 patients, presented with prostatic carcinoma diagnosed by TRUS-guided biopsy, after approval of Ethical Committee of our university with Informed consent from patients or guardians of patients who we invited to participate in the research. Patients with positive TRUS-guided biopsy were included in our study, yet all Patients with acute renal failure were excluded.
2.1. The routine MRI procedure was MR imaging is performed on 1.5 T magnet (Philips Achieva 1.5T ® SE) by using an endo-rectal coil (Medrad Prostate eCoilTM MR Endorectal Coil) combined with cardiac coil(SENSE Cardiac coil 5 element). The acquired images transferred to offline workstations (extended workspace “EWS”). 2.1.1. Patient preparation Reassurance of the patient from the entrance to the scanning room must be a rule, including proper knowledge of the whole process. A stable venous line must be available, this requiring an 18–20 gauge needle placed into an antecubital vein. The multi-parametric MR examinations are supervised by a radiologist. Patients with no contraindication will receive 20 mg I.M injection of butylscopolamine (Buscopan) used to avoid motion artifacts caused by bowel peristalsis. After digital rectal examination, the endo-rectal coil is inserted while the patient is in the left lateral decubitus position. The balloon surrounding the coil is distended by air to a volume of 80–100 ml. 2.1.2. MRI imaging protocol First we start with Axial T2-weighted turbo spin-echo sequence (TR 3.2 s, TE 120 ms, Flip angle 90, FOV 160 × 160 mm, slice thickness 3.0/0.3 and ACQ voxel size 0.42/0.42/3.0 mm) Followed by coronal T2-weighted turbo spin-echo sequence (TR 6.5 s, TE 115 ms, FOV 140 × 140 mm, slice thickness 3.0/0.0 and ACQ voxel size 0.73/0.73/3.0 mm). Then sagittal T2-weighted turbo spin-echo sequence (TR 5 s, TE 120 ms, FOV 160 × 160 mm, slice thickness 4.0/1.0 and ACQ voxel size 0.50/0.50/4.0 mm). Followed by axial T1-weighted turbo spin-echo sequence (TR 496 msc, TE 10 ms, FOV 160 × 160 mm, slice thickness 3.0/0.3 and ACQ voxel size 0.76/0.76/3.0 mm) The prostate is then imaged with a multishot echoplanar DW sequence and three orthogonal diffusion gradients (TR 3.44 s, TE 74 ms, FOV 160 × 160 mm, slice thickness 6.0/0.6 ACQ voxel size 1.25/1.25/6.0 mm with b values, 0, 50, 500, 800, 1500 s/mm 2). Contrast-enhanced MR imaging performed by acquiring T1Fast Field Echo images (TR 5 ms, TE 2 ms, flip angle 15◦ , slice thickness 4.0/−2.0, FOV 313 × 313 mm and ACQ voxel size 1.22/1.22/4.0 mm) at 20 points in time with a temporal resolution of 4.8 s. after injection of a bolus of 0.1 mmol gadopentetate dimeglumine/Kg of body weight injected into an antecubital vein followed by 20 ml of isotonic saline solution (both at injection rates of 2.5 ml/s). The results of MRI assessed as regard: Assess the prostate on conventional T2 weighted images to detect any hypo-intense focal lesion describing its pattern and size to differentiate between PIRADS 4 & 5 where size >1.5 cm considered PI-RADS 5 and assess if there was any capsular abutment or invasion, neuro-vascular bundle invasion, seminal vesicles central, bilateral or unilateral invasion and if there was urethral or urinary bladder invasion which raise PI-RADS to score 5. On T1, weighted images assure that there were no hemorrhagic lesions. Followed by focal lesion characterization on DWI which represent the main sequence for PZ focal lesion interpretation in version 2, and finally contrast-enhanced MRI to further characterize focal lesion as focal enhancement pattern raise PI-RADS 3 TO PI-RADS 4. All results reported according to PI-RADS system version 2. 2.2. Post processing The acquired images transferred to offline workstations (extended workspace “EWS”); (Syngo MR and Philips Medical Systems). Two radiologist assess the data (one lecturer and the other was professor), The lecturer had 3 years of experience in mp-MRI prostate and the professor had more than 7 years of experience
E.F. Dola et al. / European Journal of Radiology Open 4 (2017) 19–26
in mp-MRI prostate. The lesions detected on conventional imaging first and confirm any extra-capsular extension, seminal vesicles, distal sphincter or bladder neck invasion (refer to Figs. 1 and 2), Then they were revised on generated ADC maps from diffusion weighted images with ADC values calculated (refer to Figs. 1 and 2). Finally, contrast enhanced MRI dynamic T1 perfusion post processing was performed on Philips Medical Systems, We considered them positive if they showed focal enhancement in previously seen focal lesions in DWI & T2 WI (Refer to Figs. 1 and 2).
21
from posterior lateral segments (right and left) of base, mid-gland and apex. These include segments 2p, 4p, 6p, 8p, 10p & 12 p. The biopsy analysis was performed according to the six regions in the peripheral zone. Perfect alignment of the imaging data and histopathologic evaluation was difficult. 22 patients with prostate cancer managed with androgen ablation. And one patient underwent radical prostatectomy.
2.4. Statistical analysis 2.3. Standard of reference The material for histo-pathologic analysis was the trans-rectal US-guided sextant core biopsy. All the sextant biopsy was taken
Data analyzed using MedCalc© version 14 (MedCalc© Software bvba, Ostend, Belgium) and the DAG Stat spreadsheet (Mackinnon, 2000). Normally distributed numerical variables presented as mean (SD).
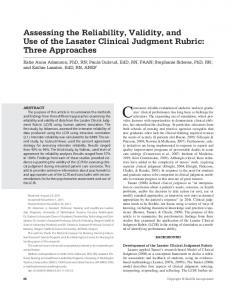
Fig. 1. 60 Years old male patient with acute retention of urine 2 months ago Relieved after urethral catheter application with Hard palpable prostate showing focal lesion on left lateral lobe with Lost median sulcus on digital rectal examination. His Total PSA = 150 ng/dl. Axial and coronal T2 WI showing left lateral mid-glandular and basal hypo intense focal lesion with capsular and neuro-vascular bundle invasion (a, b). It shows restricted diffusion hyper intense signal in DWI (c) and hypo-intense signals in ADC maps (d) with ADC values ranging from 0.66–0.72 × 10⁻³ cm2 /s (e). This case was diagnosed as PI-RADS 5.
22
E.F. Dola et al. / European Journal of Radiology Open 4 (2017) 19–26
Fig. 1. (Continued)
The diagnostic value of PI-RADS scoring system examined by construction of two-by-two contingency tables with the ultimate classification of lesions into benign or malignant by biopsy regarded as the gold-standard for lesion classification. The following diagnostic indices then calculated: sensitivity, specificity, positive predictive value and negative predictive value. 3. Results Table 1 showed data for all our patients included in this study. 3.1. Demographic data Sample age Characteristics Data was normally distributed with the mean Age of patients were 64.9 + 7.6 and Age Range (52.00–78.00). 3.2. Frequency distribution of the studied lesions according to Gleason score In our study we included 138 lesions. 46 samples proven to be negative after TRUS guided biopsy pathological results representing 33.3% of the total samples. The rest of 92 lesion which proven positive showed the following Gleason scores: 20 lesions representing 14.5% were Gleason score 3 + 3, 24 lesions representing 17.4% were Gleason score 3 + 4, 14 lesions representing 10.1%
Table 1 The studied patients collective data for biopsy results compared to MRI results, PIRDS-V2 and staging (TNM). Biopsy
MRI
Stage
PI-RADS V2
(+ve) (+ve) (+ve) (+ve) (+ve) (+ve) (+ve) (+ve) (+ve) (+ve) (+ve) (+ve) (+ve) (+ve) (+ve) (+ve) (+ve) (+ve) (+ve) (+ve) (+ve) (+ve) (+ve)
(+ve) (+ve) (+ve) (+ve) (+ve) (+ve) (+ve) (+ve) (+ve) (+ve) (+ve) (+ve) (+ve) (+ve) (+ve) (+ve) (+ve) (+ve) (+ve) (+ve) (+ve) (+ve) (+ve)
T2a T4 T4 T2c T4 T3b T3b T4 T2c T3b T4 T3b T3b T3b T2a T2b T2b T2b T3b T2b T2b T3b T3b
PIRADS 4 PIRADS 5 PIRADS 5 PIRADS 4 PIRADS 5 PIRADS 5 PIRADS 5 PIRADS 5 PIRADS 4 PIRADS 5 PIRADS 5 PIRADS 5 PIRADS 5 PIRADS 5 PIRADS 4 PIRADS 4 PIRADS 4 PIRADS 4 PIRADS 5 PIRADS 4 PIRADS 4 PIRADS 5 PIRADS 5
E.F. Dola et al. / European Journal of Radiology Open 4 (2017) 19–26 Table 2 Frequency distribution of the studied patients according to Gleason score.
23
3.3. Frequency distribution of the studied lesions according to ADC maps
Gleason score
No.
%
−ve 3+3 3+4 4+3 4+4 4+5
46 20 24 14 22 12
33.3% 14.5% 17.4% 10.1% 15.9% 8.7%
According to ADC which represents main sequence to assess PZ focal lesions, we could found that 33 lesions of the 46 proven negative lesions were PI-RADS 1, 10 lesions were PI-RADS 2& 3 lesions of the 46 were PI-RADS 3. The 92 malignant lesions showed the following distribution, 56 lesions were PI-RADS 5, 19 lesions were PI-RADS 4 & 17 lesions were PI-RADS 3 (Refer Tables 3a, 3b, and 4).
were Gleason score 4 + 3, 22 lesion representing 15.9% were Gleason score 4 + 4 & 12 lesion representing 8.7% were Gleason score 4 + 5 (Refer Table 2).
Fig. 2. 78 Years old male patient with urinary obstruction and retention followed by urinary catheterization, Total PSA value >100 ng/dl, TRUS guided biopsy pathology shows: prostate carcinoma Gleason grade 4 + 4 involving 100% of needles core tissue. (a, b) axial T2 WI shows : All the peripheral gland is invaded by hypo-intense soft tissue mass with left lateral and posterior capsular invasion showing macroscopic peri-prostatic fatty tissue infiltration and neuro-vascular bundle invasion. (c) Seminal vesicle central and left lateral invasion with hypo-intense soft tissue mass is also noted. (d) The peripheral gland focal lesions show restricted diffusion seen hyper-intense in diffusion weighted images and hypo-intense in ADC maps. (e) The peripheral gland focal lesions showed positive enhancement in contrast MRI study. This patient was diagnosed as PI-RADS 5.
24
E.F. Dola et al. / European Journal of Radiology Open 4 (2017) 19–26
Fig. 2. (Continued)
Table 3a Frequency distribution of the studied patients according to ADC.
Table 5 Frequency distribution of the studied patients according to Final PI-RADS scoring.
ADC
No.
%
Final PI-RADS scoring
No.
%
PI-RADS 1 PI-RADS 2 PI-RADS 3 PI-RADS 4 PI-RADS 5
33 10 20 19 56
23.9% 7.2% 14.5% 16% 40.6%
PI-RADS 1 PI-RADS 2 PI-RADS 3 PI-RADS 4 PI-RADS 5
33 10 14 25 56
23.9% 7.2% 10.1% 18.1% 40.6%
Table 3b Frequency distribution of the studied patients according to ADC (Benign or malignant). ADC
No.
%
Benign Malignant Undetermined
43 75 20
31.2% 54.3% 14.5%
Table 4 Frequency distribution of the studied patients according to ADC (Benign or malignant). ADC
No.
%
Benign Malignant Undetermined
43 75 20
31.2% 54.3% 14.5%
tive contrast enhancement and the PI-RADS score raised to PI-RADS 4. The rest of 14 lesions with PI-RADS 3 score showed negative enhancement pattern so still scored as PI-RADS 3. 3.5. Frequency distribution of the studied lesions according to Final PI-RADS The final PI-RADS depending on both ADC maps and Contrast enhanced MRI showed the following frequencies. 33 lesions were PI-RADS 1 representing 23.9%, 10 lesions were PI-RADS 2 representing 7.2%, 14 lesions were PI-RADS 3 representing 10.1%, 25 lesions were PI-RADS 4 representing 18.1% & 56 lesions were PI-RADS 5 representing 40.6% (Refer Table 5). 3.6. Validity of ADC in diagnosis of prostate cancer
3.4. Role of contrast enhanced MRI It was used as secondary sequence for lesions with PI-RADS 3, 6 lesions with PI-RADS 3 score according to ADC maps showed posi-
ADC when used alone proved to be 82.6% sensitive and 91.3% specific with positive & negative predictive value 100% (refer Table 6).
E.F. Dola et al. / European Journal of Radiology Open 4 (2017) 19–26 Table 6 Validity of ADC as a screening test. ADC scoring Sensitivity = TP/All Diseased = 76/92*100 = 82.6% Specificity = TN/All Free of the Disease = 42/46*100 = 91.3% PPV = TP/All Positive by screening = 76/76*100 = 100.0% NPV = TN/All Negative by screening = 43/43*100 = 100.0% TP = 76. TN = 43. All Diseased = 92. All free of the Disease = 46. All +ve by screening = 76. All −ve by screening = 43.
Table 7 Validity of Final PI RADS as a screening test. Final PI RADS scoring Sensitivity = TP/All Diseased = 81/92*100 = 88.04% Specificity = TN/All Free of the Disease = 43/46*100 = 93.4% PPV = TP/All Positive by screening = 81/81*100 = 100.0% NPV = TN/All Negative by screening = 43/43*100 = 100.0% TP = 81. TN = 43. All Diseased = 92. All free of the Disease = 46. All +ve by screening = 81. All −ve by screening = 43.
3.7. Validity of PI-RADS v2 scoring system in diagnosis of prostate cancer In PI-RADS v2 scoring using both DWI as primary sequence and contrast enhanced MRI as secondary sequence raised sensitivity for prostate cancer diagnosis to 88.04% and specificity to 93.4% compared to using DWI only (Refer Table 7).
4. Discussion Despite the constant evolution of techniques utilized in diagnosis and treatment of prostate cancer, it still remains the most common malignancy in men and the third leading cause of cancer related mortality [12]. Prostate cancer diagnosis is considered if PSA levels are found elevated (>4 ng/mL) or DRE detects a suspicious lesion. TRUS-guided biopsy is therefore done to detect a potential cancer and to assess its extent, volume, and aggression. Issue remains with the sensitivity and specificity of the available modalities, PSA has low specificity (36%), so elevated PSA does not necessarily correspond to the presence of a malignant lesion, and likewise normal PSA does not exclude cancer. Finally, TRUS biopsy underestimates the extent and grade of prostate cancer [13]. Recent introduction of Mp-MRI prostate in the management of prostate cancer and the use PI-RADS scoring system has added more to the clinical use of mp-MRI prostate [14]. Mp-MRI is also used in staging of prostate cancer as it is the favored method for assessment of loco-regional extension and metastasis either to LN or pelvic bone marrow [15] (refer to case 3 in Supplementary material). In PI-RADS v2 spectroscopy was omitted and replaced with the dynamic contrast enhancement which represents a secondary sequence. This version allowed standardization of prostate MRI imaging with better detection, characterization, localization and even risk stratification of cancer prostate [16]. Franiel et al. [17] proved that multi-parametric MRI using combined T2WI with functional imaging (DWI, spectroscopy, and DECI) techniques could detect all prostate cancers cases, but, the combination of DW imaging with MR spectroscopy or contrast-enhanced MR imaging failed to detect 6% of cancerous areas. Their detec-
25
tion rates and test negative results, respectively, were as following: T2-weighted imaging, 70% and 50%; T2-weighted imaging and 1H MR spectroscopy, 81% and 32%; T2-weighted imaging and contrastenhanced MR imaging, 83% and 29%; T2-weighted imaging and DW imaging, 85% and 30%; T2-weighted imaging, 1H MR spectroscopy, and contrast-enhanced MR imaging, 91% and 13%; T2-weighted imaging, 1H MR spectroscopy, and DW imaging, 94% and 15%; T2-weighted imaging, DW imaging, and contrast-enhanced MR imaging, 94% and 13%; T2-weighted imaging, 1H MR spectroscopy, DW imaging, and contrast-enhanced MR imaging, 100% and 0%. In our study we first assessed the validity of DWI imaging alone in diagnosis of prostate cancer which reached 82.6% sensitivity and 91.3% specificity with 100% positive & negative predictive value. After using contrast enhanced MRI these results were improved as it help in detection of 6 more lesions raising them from PI-RADS 3 score to PI-RADS 4 score, so results were modified to 88.04% sensitivity and 93.4% specificity with 100% positive and negative predictive values. Schimmoller et al. [10] proved that published ESUR guideline using PI-RADS scoring system, to evaluate prostatic lesions on highresolution T2-weighted images and at least two functional MR sequences show good to moderate inter-reader agreement and a detection rate of 42% in their patient population with elevated PSA and previously negative TRUS-guided biopsy. Roethke et al. [9] demonstrated that the ESUR PI-RADS score used as the prognostic tool for risk stratification of prostatic carcinoma can detect patients who need to undergo prostatic biopsy. In conclusion, their study proved that the ESUR scoring system can detect prostate cancer in a suspicious lesion on mp-MRI and can also be used as risk stratification for prostate cancer patient. The new published PI-RADS v2 is mainly dependent on mp-MRI results only, not taking in account the clinical factors considered before as it can be reflected on Likert scale of probability. Subtle changes have been made for T2WI & DWI finding, MRS has been omitted and DCE-MRI has changed from 5 points scale to be either negative or positive. Clinical factors were no longer included in PI-RADS v2 scoring system and it was completely dependent on mp-MRI. DWI represented the main sequence for interpretation of peripheral zone focal lesions and the contrast enhanced MRI was considered the secondary sequence for diagnosis of PZ focal lesions [1]. Significant prostate cancer definition using combined MRI & biopsy was suggested to be Gleason score ≥7 &/or lesion volume ≥ 0.5 cm3 &/or extra-prostatic extension [18]. In our study we had 20 focal lesions with Gleason 3 + 3, 11 of them representing 55% were PI-RADS 3 and the rest were PI-RADS 4. We found that the 14 lesions that were scored as PI-RADS 3 distributed as 11 lesion with Gleason 3 + 3 representing 78.6% & 3 lesions were negative. According to PI-RADS v2 The Gleason score 3 + 3 was not considered as significant cancer which may explain that there results were 55% PI-RADS 3 which is not considered significant cancer. So all significant prostate cancer focal lesions were accurately detected using PI-RADS v2 and only those considered non-significant were undetermined by PI-RADS v2 scoring system. The main limitation and drawback in our study was that our results were compared to biopsy-proven Gleason score and not to post-prostatectomy pathological grading as only one of our patient underwent radical prostatectomy and rest of patients were considered as unsuitable candidates for surgery either due to metastasis, old age or patient refusal and our study was small (n = 23) and larger studies are necessary for better assessment of our results. We recommend in later studies to use larger samples and compare the mp-MRI results to post-prostatectomy pathological results so we can correlate the results to accurate Gleason score.
26
E.F. Dola et al. / European Journal of Radiology Open 4 (2017) 19–26
5. Conclusion Our results proved that mp-MRI of prostate using PI-RADS v2 scoring system had high sensitivity and specificity in diagnosis of prostate cancer. SO PI-RADS v2 scoring system using mp-MRI is recommended as non-invasive diagnostic tool correlated to TRUS guided biopsy pathological results. Conflict of interest No conflict of interest. Acknowledgment Thanks to Dr Madiha Bangash for her help in linguistics revision for our article. Appendix A. Supplementary data Supplementary data associated with this article can be found, in the online version, at http://dx.doi.org/10.1016/j.ejro.2017.02.001. References [1] T. Barrett, B. Turkbey, P.L. Choyke, PI-RADS version 2: what you need to know, Clin. Radiol. 70 (2015) 1165–1176. [2] D. Bonekamp, M.A. Jacobs, R. El-Khouli, D. Stoianovici, K.J. Macura, Advancements in MR imaging of the prostate: from diagnosis to interventions, Radiographics 31 (2011) 677–703. [3] P. Swindle, S. McCredie, P. Russell, U. Himmelreich, M. Khadra, C. Lean, C. Mountford, Pathologic characterization of human prostate tissue with proton MR spectroscopy, Radiology 228 (2003) 144–151. [4] J.C. Vilanova, J. Comet, J. Barcelo, E.L. Bonet, A. Maroto, M. Arzoz, A. Moreno, J. Areal, Peripheral zone prostate cancer in patients with elevated PSA levels and low free-to-total PSA ratio: detection with MR imaging and MR spectroscopy, Radiology 253 (October (1)) (2009).
[5] C. Hoeks, J. Barentsz, T. Hambrock, D. Yakar, D. Somford, S. Heijmink, T. Scheenen, P. Vos, H. Huisman, I. van Oort, J. Witjes, A. Heerschap, J. Fütterer, Prostate cancer: multiparametric MR imaging for detection, localization, and staging, Radiology 261 (October (1)) (2011). [6] F.H. Schröder, H.B. Carter, T. Wolters, et al., Early detection of prostate cancer in 2007. Part 1: PSA and PSA kinetics, Eur. Urol. 53 (3) (2008) 468–477. [7] J.H. Chang, D.L. Joon, S.T. Lee, C.Y. Hiew, S. Esler, S.J. Gong, M. Wada, D. Clouston, R. O’Sullivan, Y.P. Goh, H.T. Danguy, J.G. Chan, D. Bolton, A.M. Scott, V. Khoo, I.D. Davis, Diffusion-weighted MRI, 11C-choline PET and 18F fluoro-deoxy-glucose PET for predicting the Gleason score in prostate carcinoma, Eur. Soc. Radiol. (2013), http://dx.doi.org/10.1007/s00330-0133045-1. [8] F.G. Claus, H. Hricak, R.R. Hattery, Pretreatment evaluation of prostate cancer: role of MR imaging and 1HMR spectroscopy, Radiographics 24 (2004) S167–S180. [9] M.C. Roethke, T.H. Kuru, S. Schultz, D. Tichy, A. Kopp-Schneider, M. Frenchel, H.P. Schlemmer, B.A. Hadaschik, Evaluation of the ESUR PI-RADS scoring system for multiparametric MRI of the prostate with targeted MR/TRUS fusion-guided biopsy at 3.0 Tesla, Eur. Radiol. 24 (2014) 344–352. [10] L. Schimmoller, M. Quentin, C. Arsoy, R.S. Lanzman, A. Hiester, R. Rabenalt, G. Antoch, P. Albers, D. Blondin, Inter-reader agreement of the ESUR score for prostate MRI using in-bore MRI-guided biopsies as the reference standard, Eur. Radiol. 23 (2013) 3185–3190. [11] P. Steige, H. Thoeny, Prostate MRI based on PI-RADS version 2: how we review and report, Cancer Imaging 16 (9) (2016), http://dx.doi.org/10.1186/s40644016-0068-2. [12] H. Hricak, P.L. Choyke, S.C. Eberhardt, S.A. Leibel, P.T. Scardino, Imaging prostate cancer: a multidisciplinary perspective, Radiology 243 (2007) 28–53. [13] J.O. Barentsz, J. Richenberg, R. Cleents, P. Choyke, S. Verma, G. Villeirs, O. Rouviere, V. Logager, J.J. Futterer, ESUR prostate MRguidelines 2012, Eur. Radiol. 22 (2012) 746–757. [14] A.B. Rosenkrantz, S. Kim, R.P. Lim, et al., Prostate cancer localization using multiparametric MR imaging: comparison of Prostate Imaging Reporting and Data System (PI-RADS) and Likert scales, Radiology 269 (2) (2013) 482–492. [15] M. Conti, New prospects for PET in prostate cancer imaging: a physicist’s viewpoint, EJNMMI Phys. 1 (1) (2014) 11. [16] P. Steiger, H. Thoeny, Prostate MRI based on PI-RADS version 2: how we review and report, Cancer Imaging 16 (9) (2016), http://dx.doi.org/10.1186/ s40644-016-0068-2. [17] T. Franiel, C. Stephen, A. Erbersdobler, E. Dietz, A. Maxeiner, N. Hell, A. Huppetz, K. Miller, R. Strecker, B. Hamm, Areas suspicious for prostate cancer: MR-guided biopsy in patients with at least one transrectal US-guided biopsy with a negative finding-multiparametric MR imaging for detection and biopsy planning, Radiology 259 (April (1)) (2011). [18] B. Turkbey, H. Mani, O. Aras, et al., Prostate cancer: can multiparametric MR imaging help identify patients who are candidates for active surveillance? Radiology 268 (2013) 144e52.