Distinguir as fitofisionomias do Cerrado brasileiro é uma tarefa importante para uma melhor avaliação sobre o estoque de carbono e possÃveis emissões de ...
Brazilian Journal of Cartography (2017), Nº 69/5, Special Issue GEOINFO 2017: 891-901 Brazilian Society of Cartography, Geodesy, Photgrammetry and Remote Sense ISSN: 1808-0936
ASSESSMENT OF TEXTURE FEATURES FOR BRAZILIAN SAVANNA CLASSIFICATION: A CASE STUDY IN BRASÍLIA NATIONAL PARK Avaliação de Atributos de Textura para Classificação do Cerrado brasileiro: Um Estudo de Caso no Parque Nacional de Brasília Cesare Di Girolamo Neto, Leila Maria Garcia Fonseca & Thales Sehn Körting Instituto Nacional de Pesquisas Espaciais – INPE Divisão de Processamento de Imagens - DPI Caixa Postal 515 - 12227-010 - São José dos Campos - SP, Brasil {cesare.neto; leila.fonseca; thales.korting}@inpe.br Received on February 4, 2017/ Accepted on May 6, 2017 Recebido em 4 de Fevereiro, 2017/ Aceito em 6 de Maio, 2017
ABSTRACT Distinguishing Brazilian savanna physiognomies is an essential task to better evaluate carbon storage and potential emissions of greenhouse gases. In this study, we propose to evaluate the potential of texture features to improve the discrimination among five physiognomies in the Brazilian savanna: Open Grasslands, Shrubby Grassland, Shrubby Savanna, Savanna Woodland and Gallery Forest. Texture features extracted from RapidEye images and also from Spectral Linear Mixture Model components and Vegetation Index were evaluated. Results showed that texture features based on GLCM can reduce misclassification for Open Grasslands, Shrubby Grasslands and Shrubby Savanna classes. Keywords: Remote Sensing, Data Mining, RapidEye, Random Forest.
RESUMO Distinguir as fitofisionomias do Cerrado brasileiro é uma tarefa importante para uma melhor avaliação sobre o estoque de carbono e possíveis emissões de gases do efeito estufa. Neste estudo foi proposto o uso de atributos de textura para aumentar a discriminação de cinco fitofisionomias do Cerrado brasileiro: Campo Limpo, Campo Sujo, Cerrado Ralo, Cerrado Típico e Mata de Galeria. Os atributos de textura foram extraídos de uma imagem RapidEye, imagens dos componentes do modelo linear de mistura espectral e de uma imagem de NDVI. Os resultados mostraram que atributos de textura extraídos da matriz GLCM reduziram erros entre as fitofisionomias de Campo Limpo, Campo Sujo e Cerrado Ralo. Palavras-chave:Sensoriamento Remoto, Mineração de Dados, RapidEye, Random Forest.
Neto C. G. et al. 1. INTRODUCTION Brazilian savanna, also known as Cerrado, occupies an area of approximately two million square Kilometers in the Brazilian territory, mainly in the central part of Brazil (MMA, 2015). Cerrado is one of the richest biomes in the world and it contains more than 160.000 species of plants, animals and fungi (FERREIRA et al., 2003). Besides that, Cerrado is responsible for storing about 5.9 billion tons of carbon in vegetation and 23.8 billion tons in the ground (MMA, 2014). The loss of natural vegetation in Cerrado reached 45.5% of its original area by 2013 (MMA, 2015). The loss of biodiversity can lead to problems such as: soil erosion, water pollution, carbon cycle instability, microclimate changes and also biome fragmentation (KLINK & MACHADO, 2005). Considering these negative effects on biodiversity, it is essential to promote strategies to monitor the Cerrado biome. Mapping of heterogeneous tropical areas, such as Cerrado, should be carried out considering biological, climatic and topographical information. The major natural formations in Cerrado are Grasslands, Shrublands and Woodlands (Figure 1). Their mapping has been the subject of several studies. Sano et al. (2009) performed visual interpretation of satellite images to produce maps of Cerrado. This process was very time consuming and difficult to discriminate Grasslands. The difficulty to map Cerrado patterns is even greater when considering more formations than those mentioned above. For example, the system proposed by Ribeiro and Walter (2008) splits these major formations
into 14 physiognomies. Identifying these physiognomies is important to evaluate carbon storage and potential emissions of greenhouse gases for each type of land cover. Most studies aiming to classify vegetation types in the Cerrado biome rely on the use of spectral information from remote sensing imagery. The NDVI (Normalized Difference Vegetation Index) has been tested to discriminate Cerrado physiognomies (LIESENBERG et al., 2007; OLIVEIRA et al., 2007; COSTA et al., 2014). However, there is still difficulty to discriminate different grassland physiognomies using only NDVI. Spectral Linear Mixture Model (SLMM) has also been used to classify physiognomies on a protected area of Cerrado in Distrito Federal State, Brazil (FERREIRA et al., 2007). The SLMM reduced the classification error between Grasslands and Shrublands, but it was not enough to fully automate the classification. Differently, Carvalho et al. (2010) used texture features to map the vegetation cover in the Cerrado. In this paper, an initial classification was performed using data based on NDVI, SLMM and spectral features. Afterwards, they included texture information into the dataset and noticed an increase in the classification accuracy. PenequeGalvez et al. (2013) also used texture features to classify Cerrado physiognomies in Bolivia. In this case, Woodlands were classified with high accuracy, but some confusionerrors occurred in the discrimination between Grasslands and Shrublands. However, some texture features increased this error, and reduced the overall classification accuracy. Therefore, it is necessary to investigate whether these features may be really effective for Cerrado classification.
Fig. 1 - Major Cerrado formations describing the vegetation gradient (adapted from SCHWIEDER et al., 2016).
892
Brazilian Journal of Cartography, Rio de Janeiro, No 69/5 p. 891-901, Mai/2017
Assentement of Texture Features for Brazilian Savanna Classification In order to better analyze texture features in the Cerrado classification, we could calculate texture features from NDVI instead of calculating it from original image. The NDVI texture has been used in other applications such as urban studies (NUSSBAUM & MENZ, 2008). It has also been used to detect bushfire prone areas (CHEN et al., 2001) as well as to identify different types of forest and spatial patterns of vegetation structure (NING et al., 2011). Therefore, we propose in this work to evaluate the potential use of texture information extracted from RapidEye original images, and also from vegetation index and SLMM components to classify the following physiognomies in the Brazilian Cerrado: Open Grasslands, Shrubby Grassland, Shrubby Savanna, Savanna Woodland and Gallery Forest. This paper was based on Girolamo Neto et al. (2016), presented at GEOINFO 2016 (http:// www.geoinfo.info/geoinfo2016). 2. METHODOLOGY Figure 2 presents the methodology flowchart proposed to classify vegetation cover
in Cerrado. Each processing step is detailed in the following sections. 2.1 Study Area and Reference Map The study area is located in the Brasília National Park (PNB), which has approximately 30000 ha of preserved natural Cerrado vegetation. Figure 3 shows the major part of the park, in which a red line highlights the study area. For the experiments, we used a RapidEye image in the path-row 1-318 tile 2331801 of the RapidEye Earth Imaging System (REIS). This image was acquired in 05/30/2014 and processed in level 3A product (BLACKBRIDGE, 2015). We also used as reference the map of PNB that was produced by Ferreira et al. (2007). The authors used the system proposed by Ribeiro and Walter (1998) to classify 5 Cerrado physiognomies described in Table 1. Other classes such as Water Bodies, Marsh, Reforestation, Bare Soil and Constructed Area were removed from the dataset.
Fig. 2 - Methodology flowchart.
Fig. 3 - Study area in the Brasília National Park. Brazilian Journal of Cartography, Rio de Janeiro, No 69/5 p. 891-901, Mai/2017
893
Neto C. G. et al. Table 1: Cerrado physiognomies characteristics (Adapted from FERREIRA et al., 2007 and RIBEIRO & WALTER, 2008) Physiognomy name
Vegetation description
Open Grassland (OG)
Grasses
Tree cover (%)
Shrubby Grassland (SG) Grasses and Shrubs
Tree height (m)
0
-
0-5
-
Shrubby Savanna (SS)
Shrubs and a few trees
5-20
2-3
Wooded Savanna (WS)
Trees and a few Shrubs
20-50
3-6
Gallery Forest (GF)
Trees
70-95
15-30
2.2 Image Partitioning In order to extract texture features, the image was partitioned into square objects of s x s pixels size. The use of square objects instead of polygons extracted from segmentation algorithms based on similarity allows us to evaluate texture features that capture the natural heterogeneity in the image. This procedure prevents detecting texture as a possible rule in the classification process, once we intend to evaluate texture potential for classifying Cerrado vegetation cover. Following, the image was linked with the reference map to identify the square objects represented within each class in the map. The larger is the square object size, the fewer number of objects can be extracted from the image. We tested different object sizes ranging from 10 to 35, with a step of 5. The maximum value 35 was chosen because the number of samples for Gallery Forest reached almost zero. Figure 4 illustrates the influence of object size in relation to the number of samples for Gallery Forest. After the partitioning process, some segments presented two or more classes, which can lead to misclassification (FERREIRA et al., 2007; OLIVEIRA et al., 2007; CARVALHO
et al., 2010). To reduce this problem these elements were removed from the dataset. Figure 5 illustrates the cleaning up procedure. 2.3 Feature Extraction Spectral features were obtained from Digital Numbers (DN) of RapidEye (RE) bands. The description the spectral features is presented in Table 2. The NDVI and SLMM components (soil, shadow and vegetation) were computed according to Tucker (1979) and Shimabukuro and Smith (1991), respectively. Texture features were computed from Gray Level Co-occurrence Matrix (GLCM) as shown in Table 3. GLCM is a second order histogram in which each entry reports the join probability of finding a set of two gray levels at a certain distance and direction from each other over some pre-defined window (HARALICK et al., 1973). Additionally, some texture measures were computed from Gray Level Difference Vector (GLDV), as shown in Table 3. GLDV indicates occurrence of the absolute difference between a reference pixel and its neighbor. It can be calculated for 4 different directions (0º, 45º, 90º and 135º). In this study, we used only direction 0º.
Fig. 4 -The influence of objects size in relation to the number of samples of Gallery Forest. 894
Brazilian Journal of Cartography, Rio de Janeiro, No 69/5 p. 891-901, Mai/2017
Assentement of Texture Features for Brazilian Savanna Classification Texture features were also extracted from image bands, from NDVI, and from each SLMM component (soil, shadow and vegetation). Therefore, 9 texture features (Table 3) were
extracted from five images (vector of bands, NDVI, SLMM), which produced a total of 45 features. The features of BT and MD were not used for extracting texture.
Fig. 5 - Clean up process. a) original map with 3 different classes; b) highlighted objects for removal; c) map of samples after cleanup process. Table 2: Spectral features extracted from the RapidEye image Feature Band_1
Description DN from band 1 (Blue 440 510 µm) Band_2 DN from band 2 (Green 520 590 µm) Band_3 DN from band 3 (Red 630 685 µm) Band_4 DN from band 4 (Red Edge 690 730 µm) Band_5 DN from band 5 (NIR 760 510 µm) Brightness (BT) Average of the sum of means for bands 1-5 Maximum Maximum of the difference Difference (MD) between bands NDVI Normalized Difference Vegetation Index SLMM_soil SLMM component of soil SLMM_shadow SLMM component of shadow SLMM_vegetation SLMM component of vegetation
Table 3: Textural features (HARALICK et al., 1973). Pi,j is the normalized co occurrence matrix, N is the number of rows/columns, σi and σj are standard deviation of row i and column j, μi and μj are means of row i and column j, Vk is the normalized gray level difference vector and k = |i-j|.
Brazilian Journal of Cartography, Rio de Janeiro, No 69/5 p. 891-901, Mai/2017
895
Neto C. G. et al. 2.4 Classification In the classification phase we performed two experiments. In the first experiment, we used four datasets in the classification phase, as shown in Table 4. This was the baseline to evaluate the classification accuracy gain by including each feature into the datasets one at a time. The idea of this experiment is to evaluate classification accuracy for each spectral feature and also the spectral texture, which has been pointed out by Carvalho et al. (2010) and PenequeGalvez et al. (2013) as features that improve Cerrado classification. In Table 4, Spectral Texture means texture features extracted from RapidEye bands only. In the experiment 2, we evaluated all 45 texture features, adding one at a time in each one of the datasets 1-3. The idea was to evaluate the improvement or not in the classification accuracy for each texture feature. For comparison, we established the same classification algorithm and parameters for all tests. We used Random Forest classification algorithm (BREIMAN, 2001), implemented in Weka software (HALL et al., 2009), and set the number of trees to 100 in order to construct each forest. Table 4: Combination of groups of features to evaluate the best subset for classification RE bands, BT, MD
NDVI SLMM
Spectral Texture
in which TP = True Positive, FP = False Positive, TN = True Negative, FN = False Negative and n = number of samples. Recall and Precision mean, respectively, percentage of instances of one class that are correctly classified and the map accuracy.We proposed a ranking system to evaluate the inclusion of textural features into the datasets. It is based on accuracy percentage gain (or loss), Acc, when a certain feature is added into the dataset: (4)
in which Acc is the accuracy percentage gain, Acc i is the initial accuracy and Acc f is the accuracy when a texture feature is included in the set of features. Each one of the 45 features was ranked from 1-45, being 1 the feature that presented more percentage gain and so on. This was performed for datasets 1-3 and segmentation of size equal to 30. A final rank considered the average performance. Table 5 shows an example for 3 hypothetical features. 3. RESULTS This section presents results obtained from experiments mentioned in section 2.4. 3.1. Experiment 1: Spectral texture features analysis
Dataset 1
X
Dataset 2
X
X
Dataset 3
X
X
X
Dataset 4
X
X
X
X
The experiments were carried out using a 10fold cross validation. For the validation process, we used Global Accuracy, Precision and Recall values to summarize the confusion matrix in the experiments: (1) (2)
Figure 6 presents the accuracy classification for all 4 datasets (Table 4) in relation to the segmentation parameter s. We observe that for datasets 1, 2 and 3, the classification values did not presented meaningful difference. That is, the addition of NDVI and SLMM features into the feature set did not improve the classification result. Nevertheless, inclusion of spectral texture features (dataset 4) improved the classification result, which corroborates with Carvalho et al. (2010) and PenequeGalvez et al. (2013). Another observation is that the classification for segmentation parameter equals to 30 presented better result than others (Figure 7).
(3) 896
Brazilian Journal of Cartography, Rio de Janeiro, No 69/5 p. 891-901, Mai/2017
Assentement of Texture Features for Brazilian Savanna Classification Table 5: Ranking system example for 3 hypothetical features Dataset #
1
2
3
Average rank
Final Rank
Feature 1 Rank
1st
1st
1st
1,00
1st
Feature 2 Rank
2nd
2nd
3rd
2,33
2nd
Feature 3 Rank
3rd
3rd
2nd
2,66
3rd
In order to better investigate this result, we evaluated Precision and Recall values for each class for the classification for the segmentation parameter of 30 (Table 6). We can observe that Shrubby Savanna (SS) and Shrubby Grassland (SG) classes presented the worst classification. Open Grassland (OG) and Wooded Savanna (WS) presented better precision values, but not as good as the ones for Gallery Forest (GF) class. GF class is the only physiognomy with forest structure and it was expected that it would present better classification accuracy than the others.
Table 6: Precision (P) and Recall (R) values for each class from dataset 1 and 4 for the segmentation parameter of 30
Dataset1 Dataset4
Dataset1 Dataset4
Dataset1 Dataset4
Dataset1 Dataset4
Dataset1 Dataset4
Open Grassland P R 0,761 0,829 0,757 0,866 Shrubby Grassland P R 0,519 0,411 0,578 0,486 Shrub Savanna P R 0,620 0,510 0,666 0,507 Wooded Savanna P R 0,761 0,827 0,781 0,842 Gallery Forest P R 0,947 0,941 0,970 0,935
Fig. 6 - Accuracy values (%) for datasets 1-4 according to the segmentation parameter.
3.2 Experiment 2: Texture features analyses
When spectral texture is added, we noticed an increase in the recall values for all classes, except for GF. The SG class presented the highest precision gains when spectral texture was added. Oliveira et al. (2007) pointed out that discrimination between OG and SG classes is difficult. Costa et al. (2014) even suggested merging both classes to decrease classification error. Ferreira et al. (2007) also reported confusion between SG and SS classes. However, our results show that the use of spectral texture can improve considerablytheir discrimination.
In this part, we analyze the texture potential of improving the classification in relation to the 5 Cerrado classes and s = 30. As mentioned on section Section 2.4, each one of the 45 texture features were added separately on datasets 1-3. Final rank of the best features is presented in Table 7. Considering SLMM components and NDVI, the best ranks were achieved by ‘GLCM Entropy’ features. Homogeneous objects have high entropy values while heterogeneous ones have low entropy. In Cerrado, tree density and canopy formation are responsible for more or less homogeneity.
Brazilian Journal of Cartography, Rio de Janeiro, No 69/5 p. 891-901, Mai/2017
897
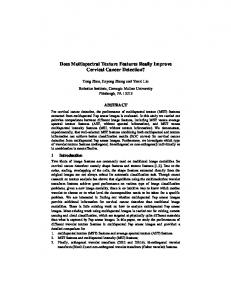
Neto C. G. et al. Figure 7 shows the mean values for the “GLCM Entropy vegetation” for the five Cerrado physiognomies. It shows us that, SG and SS classes presented the lowest mean values for ‘GLCM Entropy vegetation’. Although SG does not have continuous canopy it presents bushes more frequently when compared to OG. This makes SG less homogeneous than OG and, therefore, producing lower entropy vegetation than OG. Regarding to SS class, Ribeiro and Walter (2008) stated that there is a canopy formation, however it is much sparser and with a lower tree cover percentage than the WS class. These vegetation patterns were captured by features
such as “GLCM Entropy vegetation” and “GLCM Entropy NDVI”, which achieved the best rankings (1st and 2nd, respectively). Table 8 presents Recall and Precision values when “GLCM Entropy vegetation”, first feature in the ranking, was added to dataset 3. We noticed a slightly classification improvement for all classes, except for GF Precision. The SG and OG classes presented a little increase in the Recall values. The use of features such as ‘GLCM Entropy vegetation’ and ‘GLCM Entropy NDVI’ improved the discrimination of both classes, as can be noticed in Recall values. We also observed a little improvement of Recall for SS class.
Table 7: Ranking the 10 best texture features. Vegetation, shadow and soil represent the features obtained from SLMM images
Feature Name GLCM Entropy vegetation GLCM Entropy NDVI GLCM Entropy shadow GLCM Entropy soil GLDV Entropy spectral GLCM Contrast shadow GLCM Contrast spectral GLDV Contrast shadow GLCM Dissimilarity spectral GLCM Correlation shadow
Average Rank 1,3 2,3 2,6 4,6 9,6 10,0 11,0 11,0 11,0 11,6
Final Rank 1st 2nd 3rd 4th 5th 6th 7th 10th
Fig. 7 - GLCM Entropy vegetation mean values for Cerrado physiognomies (adapted from SCHWIEDER et al., 2016). 898
Brazilian Journal of Cartography, Rio de Janeiro, No 69/5 p. 891-901, Mai/2017
Assentement of Texture Features for Brazilian Savanna Classification Table 8: Precision (P) and Recall (R) for each class with addition of textural entropy Open Grassland Shrubby Grassland Shrub Savanna Wooded Savanna Gallery Forest P R P R P P R P R P Dataset 3 + GLCM Entropy vegetation
0,760
0,824
0,516
0,450
0,611
0,504
0,763
0,824
0,958 0,941
0,782
0,864
0,567
0,488
0,649
0,529
0,791
0,846
0,936 0,953
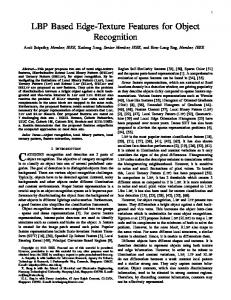
Figure 8 shows an example of how important it is to correctly choose the best features to improve the classification accuracy. GLCM Entropy features were much more consistent than
the others in all classifications, obtaining always the best ranking. Using some texture features may not really improve the classification results as mentioned by PenequeGalvez et al.(2013).
Fig. 8 - Influence of some features in the final classification accuracy. Feature ranked as 1st is “GLCM Entropy vegetation”, 22th is “GLDV Contrast NDVI”and 45th is “GLCM Mean spectral”. 4. CONCLUSION
REFERENCES
In this study, we presented the assessment of texture features (spectral, NDVI and SLMM) to improve the discrimination of Cerrado physiognomies. Considering only spectral features, the initial accuracy was about 71.3%. The spectral texture improved the classification accuracy to 73.8%. Spectral texture was responsible for reducing the misclassification between grassland physiognomies (Open Grassland and Shrubby Grassland). However, the texture based on GLCM entropy extracted from NDVI and SLMM components, especially vegetation, improved even more the classification accuracy reaching 74.3%. They not only reduced the confusion between grassland physiognomies mentioned before but also increased the discrimination of Shrubby Grassland and Shrubby Savanna. Gallery Forests had high accuracy on all cases. As future works, we suggest using temporal data analysis and combining spectral texture with NDVI and SLMM textures.
BLACKBRIDGE. Satellite Imagery Product Specifications, 2015. Available at: www.e-eos.it/ images/Satellite_data/RAPIDEYE/RE_Product_ Specifications_ENG.pdf. Accessed aug 04. 2016. B REIMAN, L. Random forests. Machine Learning Journal, v.45, p.5-32, 2001. CARVALHO, L.; RAHMAN, M.; HAY, G.; YACKEL, J. Optical and SAR imagery for mapping vegetation gradients in Brazilian savannas: Synergy between pixel-based and object-based approaches. In: International Conference of Geographic Object-Based Image, 38, 2010, Ghent, Belgium. Proceedings... 2010, p.1-7. CHEN, K.; JACOBSON, C.; Blong, R. Using NDVI image texture analysis for bushfire-prone landscape assessment. In: Asian Conference on Remote Sensing, 22, 2001, Venue, Singapore. Proceedings… 2010. p.9. COSTA, W. S.; FONSECA, L. M. G.; KÖRTING, T. S. Mapping Grasslands Formations and
Brazilian Journal of Cartography, Rio de Janeiro, No 69/5 p. 891-901, Mai/2017
899
Neto C. G. et al. Cultivated Pastures in the Brazilian Cerrado Using Data Mining. In: GeoProcessing - International Conference on Advanced Geographic Information Systems and Applications, 6, 2014, Barcelona, Spain, Procedings… 2014. p.138-141. FERREIRA, L. G.; YOSHIOKA, H.; HUETA, A.; SANO, E. E. Seasonal landscape and spectral vegetation index dynamics in the Brazilian Cerrado: An analysis within the Large-Scale Biosphere–Atmosphere Experiment in Amazônia (LBA). Remote Sensing of Environment, v.87, n.4, p.534-550, 2003. FERREIRA, M. E.; FERREIRA, L. G.; SANO, E. E.; SHIMABUKURO, Y. E. Spectral linear mixture modeling approaches for land cover mapping of tropical savanna areas in Brazil. International Journal of Remote Sensing, v.2, n.28, p.413-429, 2007. GIROLAMO NETO, C. D.; FONSECA, L. M. G.; KÖRTING, T. S. Assessment of texture features for Brazilian savanna classification: a case study in Brasília National Park. In: Brazilian Symposium on GeoInformatics, 17, 2016, Campos do Jordão, SP. Proceedings…, 2016. p.204-2015. HALL, M. A.; FRANK, E.; HOLMES, G.; PFAHRINGER, B.; REUTEMANN, P.; WITTEN, I. H. The WEKA Data Mining Software: An Update. SIGKDD Explorations. New York, v.11, n.1, p.10-18, 2009. HARALICK, R. M.; SHANMUGAM, K.; DINSTEIN, I. textural features for image classification. IEEE Transactions on systems, man, and cybernetics, n.6, p.610621, 1973. KLINK, C.; MACHADO, R. Conservation of the Brazilian Cerrado. Conservation Biology, v.19, n.3, p.707-713, 2005. LIESENBERG, V.; PONZONI, F. J.; GALVÃO, L. S. Análise da dinâmica sazonal e separabilidade espectral de algumas fitofisionomias do Cerrado com índices de vegetação dos sensores ModisTerra e Aqua. Revista Árvore, v.31, n.2, p.295-305, 2007. MINISTÉRIO DO MEIO AMBIENTE (MMA) – PPCerrado – Plano de ação para prevenção e controle do desmatametno e das queimadas no cerrado: 2ª fase (2014-2015), 2014. Avaliable 900
at: http://www.florestal.gov.br/snif/images/ Publicacoes/ ppcerrado_2fase.pdf. Accessed aug. 04. 2016. MINISTÉRIO DO MEIO AMBIENTE (MMA) – Mapeamento do uso e cobertura do Cerrado: Projeto TerraClass Cerrado 2013, 2015. Avaliable at: http://www.mma.gov. br/publicacoes/biomas/category/62-cerrado. Accessed aug. 05. 2016. NING, H. A. N.; JING, W. U.; TAHMASSEBI, A. R. S.; XU, H. W.; KE, W. A. N. G. NDVIbased lacunarity texture for improving identification of torreya using object-oriented method. Agricultural Sciences in China, v.10, n.9, p.1431-1444, 2011. NUSSBAUM, S.; MENZ, G. Object-based image analysis and treaty verification: new approaches in remote sensing-applied to nuclear facilities in Iran. Springer Science & Business Media, 2008. 172 p. OLIVEIRA, L. T.; OLIVEIRA, T. C. A.; CARVALHO, L. M. T.; LACERDA, W. S.; CAMPOS, S. R. S; MARTINHAGO, A. Z. Comparison of machine learning algorithms for mapping Phytophysiognomies of the Brazilian Cerrado. In: Brazilian Symposium on GeoInformatics, 9, 2007, Campos do Jordão, SP. Anais…, 2007. p.195-205. PENEQUE-GALVEZ, J.; MAS, J. F.; MORÉ, G.; CRISTOBÁL, J.; ORTA-MARTINEZ, M.; LUZ, A. C.; GUÉZE, M.; MACIA, M. J.; Reyes-Garcia, V. Enhanced land use/ cover classification of heterogeneous tropical landscapes using support vector machines and textural homogeneity. International Journal of Applied Earth Observation and Geoinformation, v.23, n.1, p.372-383, 2013. RIBEIRO, J. F.; WALTER, B. M. T. As principais fitofisionomias do Bioma Cerrado. In: SANO, S. M.; ALMEIDA, S. P.; RIBEIRO, J. F. Cerrado: ecologia e flora. Brasília: EMBRAPA, 2008. p.152-212. SANO, E. E.; ROSA, R.; BRITO, J. L. S.; FERREIRA, L. G.; BEZERRA, H. S. Mapeamento da cobertura vegetal natural e antrópica do bioma Cerrado por meio de imagens Landsat ETM+ In: Simpósio Brasileiro de
Brazilian Journal of Cartography, Rio de Janeiro, No 69/5 p. 891-901, Mai/2017
Assentement of Texture Features for Brazilian Savanna Classification Sensoriamento Remoto, 14, 2009, Natal, RN. Anais..., 2009. p.1199-1206. S C H W I E D E R , M . ; L E I T Ã O , P. J . ; BUSTAMENTE, M. M. C.; FERREIRA, L.G.; RAB, A.; HOSTERT, P. Mapping Brazilian savanna vegetation gradients with Landsat time series. International Journal of Applied Earth Observation and Geoinformation, v.52, p.361370, 2016.
SHIMABUKURO, Y. E.; SMITH, J. A. The leastsquares mixing models to generate fractio images derived from remote sensing multispectral data, IEEE Transactions on Geoscience and Remote Sensing, v.29, n.1, p.16-20, 1991. TUCKER, C. J. Red and photographic infrared linear combinations for monitoring vegetation. Remote Sensing of Environment, v.8, n.2, p.127-150, 1979.
Brazilian Journal of Cartography, Rio de Janeiro, No 69/5 p. 891-901, Mai/2017
901