Asymmetric diffusion at the interfaces in multilayers Ajay Gupta∗ and Dileep Kumar, Vaishali Phatak UGC-DAE Consortium for Scientific Research, University Campus, Khandwa Road, Indore-452017, India
arXiv:0909.4837v1 [cond-mat.mes-hall] 26 Sep 2009
(Dated: 26 September 2009) Nanoscale diffusion at the interfaces in multilayers plays a vital role in controlling their physical properties for a variety of applications. In the present work depth-dependent interdiffusion in a Si/Fe/Si trilayer has been studied with sub-nanometer depth resolution, using x ray standing waves. High depth-selectivity of the present technique allows one to measure diffusion at the two interfaces of Fe namely, Fe-on-Si and Si-on-Fe, independently, yielding an intriguing result that Fe diffusivity at the two interfaces is not symmetric. It is faster at the Fe-on-Si interface. While the values of activation energy at the two interfaces are comparable, the main difference is found in the pre-exponent factor suggesting different mechanisms of diffusion at the two interfaces. This apparently counter-intuitive result has been understood in terms of an asymmetric structure of the interfaces as revealed by depth selective conversion electron M¨ ossbauer spectroscopy. A difference in the surface free energies of Fe and Si can lead to such differences in the structure of the two interfaces.
Atomic diffusion is fundamental to many processes in material science such as microstructure development, non-martensitic phase transformation, stress relaxation etc. In multilayers, atomic diffusion at the interfaces plays a vital role in controlling their physical properties for a wide variety of applications. In x ray and neutron mirrors intentionally diffused interfaces have been used to reduce the higher order contamination [1]. In tunnel magnetoresistance multilayers, thermal annealing can increase magnetoresistance by orders of magnitude [2]. In giant magnetoresistance (GMR) multilayers, interdiffusion can significantly affect the GMR [3]. In spin valves with Mn based antiferromagnetic layer, Mn diffusion can seriously degrade the performance [4]. Co diffusion in Sm-Co/Fe exchange-spring magnet films is known to improve the exchange coupling [5]. While atomic diffusion in bulk solids is a widely studied and fairly well understood phenomenon, a reasonable understanding of the interfacial diffusion in multilayers has yet to emerge. Several factors like a steep concentration gradient at the interfaces, interfacial stresses and disorder may significantly modify the diffusion in multilayers. This has resulted in unexpected interfacial phenomenon like a nonparabolic shift of phase boundaries in the presence of strong composition dependence of diffusivity [6]. X ray standing waves generated by total external reflection of x rays from buffer layer [7], or in a multilayer [8, 9] have been used for concentration profiling of various elements. In the present work, we exploit the depth selectivity of x ray standing waves for studying the depth dependent interdiffusion in a Si/Fe/Si trilayer with sub-nanometer depth resolution. High depth sensitivity of the technique allows one to measure diffusion at the two interfaces of Fe namely Fe-on-Si and
∗ Electronic
address:
[email protected]
Si-on-Fe independently. An intriguing finding of the present work is that the Fe diffusivity at the two interfaces is not symmetric; diffusion is faster at the Feon-Si interface. In order to understand this apparently counter-intuitive result, conversion electron M¨ ossbauer spectroscopy (CEMS) has been used to study the interfacial structure. It is found that there is a significant difference in the structure of the two interfaces, resulting in different diffusivities at the two interfaces. A difference in the surface free energies of Fe and Si can lead to such difference in the structure of the two interfaces. The structure of the multilayer used for diffusion measurements is [W (2.0 nm)/Si (3.1 nm)]10 / Si (3.8 nm)/ Fe (2.7 nm)/Si (7.0 nm) (referred as SW− ML). The deposition was done using ion beam sputtering in a vacuum chamber with a base pressure of 1×10⁻⁷ mbar [10]. A broad beam Kaufman type ion source was used with Ar ions of energy 1 keV and a beam current of 20 mA. The bottom [W (2.0 nm)/Si (3.1 nm)]10 multilayer is used to generate x ray standing waves [9]. On the top of this multilayer Si (3.8 nm)/Fe (2.7 nm)/Si (7.0 nm) structure was deposited without breaking vacuum. A thickness of 3.8 nm for the first Si layer is chosen in such a way that the Fe layer lies roughly midway between two antinodes of the x ray standing waves generated in W/Si multilayer at the Bragg peak. This point is clear from the inset of Fig. 1 which shows the contour plot of x ray intensity as a function of depth and the scattering vector q. At q = 1.35 nm−1 which corresponds to the center of the Bragg peak of W/Si multilayer, Fe layer is midway between the two antinodes. Simultaneous x ray reflectivity (XRR) and x ray fluorescence (XRF) measurements were done using Bruker D8 diffractometer fitted with a G¨obble mirror on the incident beam side in order to obtain a parallel monochromatic beam of Cu Kα radiation. Fluorescence spectrum was measured using a Ketek detector with an energy resolution of 200 eV. Thermal annealing of multilayer struc-
2 Fe
1.5
-1
q (nm )
Si-on-Fe
1.4
Fe-on-Si
(nm)
623K
(nm)
1.20
1.3
2.60
Reflectivity (a. u.)
4
8
12
Depth (nm)
598K
0.85 nm
523K
0.65 nm
473K
0.6 nm
RT
0.5
1.0
1.5
q (nm)
-1
0.6 nm
Fluorescence (a.u.)
598K 1.2
523K
1.05
498K
473K
1.95
0.95
1.50
0.90
1.35
RT
0.80
0.80
0.60
0.60
2.0
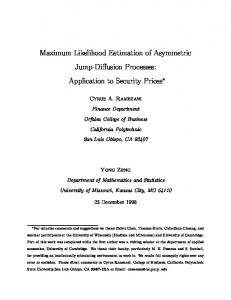
FIG. 1: Representative XRR of SW− ML after various stages of annealing. The continuous curves represent the best fit to the experimental data. The numbers shown against each curve represent annealing temperature and the average interface roughness of W/Si multilayer respectively. Inset shows the contour plot of x ray intensity as a function of q and depth from the surface of the multilayer. The rectangle represents the position of Fe layer.
ture was done in a vacuum of 10−6 mbar in order to induce interdiffusion at the interfaces of Fe and Si layers. A separate study on the annealing behavior of W/Si multilayer showed that at least up to 623 K, the W/Si multilayer structure is stable with almost no change in its x ray reflectivity. Thus the thermal annealing in the present multilayer essentially induces interdiffusion at the interfaces of Fe and Si layers only. In order to study the Fe-on-Si and Si-on-Fe interfaces using CEMS, the following two multilayer structures were also prepared using ion beam sputtering: (i) substrate/ [Si(6 nm)/57 Fe(2 nm)/Fe(2 nm)]10 , and (ii) substrate/ [Si(6 nm)/Fe(2 nm)/ 57 Fe(2 nm)]10 , designed as ML1 and ML2 respectively. In the first multilayer the 2 nm thick Fe layer lies on Fe-on-Si interface while in the second multilayer it lies on Si-on-Fe interface. Since M¨ ossbauer measurements are sensitive only to 57 Fe, the first multilayer gives information preferentially about the Fe-on-Si interface, while the second one gives information about Si-on-Fe interface. The CEMS measurements were done using a Wissel M¨ ossbauer spectrometer and a gas flow proportional counter with 95% He + 5% CH4 . SW− ML was isochronally annealed at 473 K, 498 K, 523 K, 598 K and 623 K for 1 h each. Figure 1 gives some representative XRR of SW− ML after various stages of annealing. The XRR of this multilayer is dominated by that of W/Si multilayer mirror, with only small modulation in the q region below the Bragg peak attributable to the top Si/Fe/Si trilayer. Figure 2 shows Fe-fluorescence data of SW− ML measured simultaneously with XRR. The region around the Bragg peak in which x ray standing waves are generated, is highlighted in the figure by shaded area. One may note that in the as-deposited sample Fe-fluorescence exhibits two well defined peaks in the region where x ray standing waves are generated. The origin of these two peaks can be understood from the
1.0
1.2
1.4
-1
1.6
1.8
q (nm)
FIG. 2: Fe-fluorescence of SW− ML after various stages of annealing. The continuous curves represent the best fit to the experimental data.The shaded area represents the region around Bragg peak where x ray standing waves are formed. The dashed curve represents the best fit to the experimental data of 498K annealed sample with the roughnesses of the two interfaces of Fe taken to be equal.
contour plot of x ray intensity (inset of Fig 1). At the center of the Bragg peak, Fe layer lies roughly midway between the two antinodes. However, as one moves away on either side of the Bragg peak, the antinodes get shifted resulting in partial overlapping of one of the antinodes with Fe layer, giving rise to a peak in Fe-fluorescence. The peak around q = 1.27 nm−1 corresponds to a situation where one of the antinodes partially overlaps with Fe-on-Si interface while the peak at q = 1.41 nm−1 occurs as a result of partial overlap of an antinode at Si-on-Fe interface. With thermal annealing both these peaks get broadened and their intensities get modified. However, changes occuring in the two peaks are quite different, suggesting that the two interfaces get modified differently with thermal annealing. Simultaneous fitting of XRR and Fe-fluorescence data has been done using Parratt´s formalism [11]. The average roughness of the interfaces of W/Si multilayer σW/Si , and the roughnesses of the two interfaces of Fe, σF e−on−Si and σSi−on−F e were the only parameters which were varied as a function of annealing temperature. While the XRR data is mainly sensitive to the changes in σW/Si , the Fe-fluorescence is affected by the changes in the structure of the interfaces of Fe layer. One finds that with thermal annealing up to 623 K, there are only minor changes in the W/Si multilayer with the interface roughness going from 0.6 nm to 0.85 nm. The roughnesses of the Fe-on-Si and Si-on-Fe interfaces as obtained from the fitting of the fluorescence and XRR data are shown in Fig. 2. One may note that the roughness of Fe-on-Si interface increases at a much faster rate as compared to that of Si-on-Fe interface. It may be mentioned that for the thermal annealing upto 473 K, the width of Fe concentration profile is much smaller than the separation between two antinodes. Therefore, from the fluores-
3 -48
ML1
Fe-on-Si
ln
-49
D0= -41.1
0.4 eV
-51
)
D0= -46.1
E = 0.29
Hf
-50
P(B
2
ln
Counts (a.u.)
E = 0.45 0.07eV Si-on-Fe
ln [D (m /s)]
ML1
0.2
ML2
ML2
-52
-53
1.6
1.7 1000/T
1.8
1.9
-8
-6
-4
-2
0
2
4
Velocity (mm/s)
-1
(K )
6
8
10
20
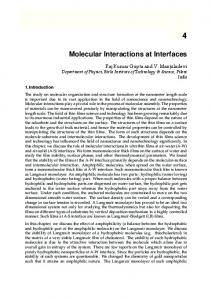
cence data it is difficult to estimate the roughnesses of the two interfaces separately. However, at 498K and above roughnesses of the two interfaces can be determined individually with good reliability. In order to demonstrate this point, the fitting of 498 K data obtained by taking the roughnesses of the two interfaces to be equal is also shown in Fig. 2 (dashed curve). The best fitted curve clearly deviates from the experimental data. The variation in the roughnesses of the two interfaces with the thermal annealing has been used to estimate the diffusivity of Fe at the two interfaces using the relation: D(T2 ) = [σ 2 (T2 ) − σ 2 (T1 )]/2t,where D(T2 ) is the diffusion coefficient at temperature T2 , σ(T1 ) and σ(T2 ) are the roughnesses of an interface before and after annealing at temperature T2 for time t. Figure. 3 gives the Arrhenius plot of lnD versus 1/T at the two interfaces of Fe. One finds that there is a significant difference in Fe diffusivities at the two interfaces. A linear fit to the experimental data as expected from the Arrhenius temperature dependence of the diffusivity D(T ) = D0 exp(−E/KB T ), yields the activation energy E as well as the pre-exponent D0 for the diffusion. The experimentally obtained values are shown in Fig. 3. One finds that the activation energies for diffusion at the two interfaces are comparable within experimental errors. However, the pre-exponent D0 is significantly high for Fe-on-Si interface as compared to that for Si-on-Fe interface, resulting in a significantly high diffusivity at Fe-on-Si interface in the temperature range studied in the present experiment. At first glance the above results appear to be counter intuitive as both interfaces ought to be identical, having Fe layer on one side and Si layers on the other. In order to understand the possible reason for this difference in the diffusivity at the two interfaces, a detailed study of the structure of the two interfaces has been done using CEMS on the samples ML1 and ML2. As discussed in the experimental section CEMS of ML1 is sensitive to Feon-Si interface while that of ML2 is sensitive to Si-on-Fe interface. Figure 4(a) shows M¨ ossbauer spectra of ML1 and ML2 in as-deposited state. The spectra of both the specimens are fitted with three overlapping components: (1) a sharp sextet with hyperfine field about 33 T, (2) a broad mag-
Hf
40
(T)
(b)
(a)
FIG. 3: Arrhenius plot of Fe diffusivity at the two interfaces.
30
B
FIG. 4: (a) Conversion electron M¨ ossbauer spectra of asdeposited ML1 and ML2,(b) The corresponding hyperfine field distribution of the broad magnetic sextet.
TABLE I: Results of fitting of M¨ ossbauer spectra of ML1 and ML2 as described in the text. δ, ∆ and Bhf represent isomer shift, quadrupole splitting and average hyperfine field respectively. Isomer shift δ is with respect to α-Fe. Sample Sharp Sextet Broad Sextet
Doublet
Bhf (T ) Area (%) Bhf (T ) Area (%) δ (mm/s) ∆ (mm/s) Area (%)
ML1 31.34±0.08 28±6 26.11±0.32 46±6 0.16±0.01 0.68±0.02 26±3
ML2 32.32±0.06 32±5 25.74±0.21 50±3 0.24±0.01 0.65±0.03 18±3
netic component, having a distribution of hyperfine fields and (3) a non-magnetic doublet. The sharp sextet represents the bulk of α-Fe, while the broad magnetic component and the doublet represent the Fe atoms in the interfacial region. Further it is known that in Fe-Si alloy, if iron concentration is less than 50%, it becomes nonmagnetic [12]. Therefore, the area under the doublet represents the fraction of Fe atoms in the interfacial region having iron concentration less than or equal to 50%. Results of fitting are given in table (1). One may note that the area under the sharp sextet in both the specimens is about 30%, within experimental errors. However, the relative areas of broad magnetic component and the doublet as well as the shape of the hyperfine field distribution of broad magnetic component [Fig. 4(b)] are very different in the two specimens. This suggests that the structure of the two interfaces namely Si-on-Fe and Fe-on-Si interface may be different. A rough estimate of the interface roughness as obtained from the width of the intermixed region comes out to be 0.78 nm, which is in agreement with that obtained from x ray measurements. From table (1), one finds that at Si-on-Fe interface, the fraction of Fe atoms in the doublet is 18%, which is about 23% of the total Fe atoms in the intermixed region. This area fraction agrees very well with that expected for an error function concentration profile [Fig. 5]. Thus, M¨ ossbauer measurements suggest that the concentration profile at
4
Fe Concentration
1.00
Si
Fe
Si
0.75
0.50
0.25
0.00
Depth
FIG. 5: Schematic diagram of concentration profile of Fe layer. The regions corresponding to sharp sextet, broad sextet and doublet are shown in different shades. The dashed rectangle shows the position of ideal interfaces.
Si-on-Fe interface is an error function. From M¨ ossbauer spectrum of specimen ML1 one finds that in this spectrum, the area of doublet is 27%, which is significantly more than what one expects for an error function concentration profile. Further a comparison of hyperfine field distributions at the two interfaces shows that at Si-on-Fe interface, there is a continuous distribution of hyperfine field values starting from 32 T down to 10 T while at Fe-on-Si interface, low field components are missing. The above two differences can be understood, if one assumes the concentration profile at Fe-on-Si interface to be as shown schematically in Fig. 5, where the area from the low field magnetic component gets transferred to the non-magnetic component. This suggests that at Fe-on-Si interface, there is an interlayer of Fe1−x Six , resulting in a plateau in a concentration profile. The isomer shift and quadrupole values of the doublet of ML1 match very well with those of FeSi2 , suggesting that the composition of interlayer is FeSi2 [13]. Thus, at Fe-on-Si interface diffusion occurs via the FeSi2 interlayer, while at Si-on-Fe interface diffusion occurs via bcc Fe (Si) phase. In literature the diffusivity data for self-diffusion in stiochometric DO3 phase as well as intermetallic compounds of FeSi are given. However, it is not meaningful to compare the diffusivities obtained in the present work at the two interfaces with bulk diffusivities,
[1] J. Padiyath, J. Stahn, M. Horisberger, and P. B¨ oni, Appl. Phys. Lett. 89, 113123 (2006). [2] J. Scola, H. Polovy, C. Fermon, M. Pannetier-Lecoeur, G. Feng, K. Fahy, and J. M. D. Coey, Appl. Phys. Lett. 90, 252501 (2007). [3] D. Iu¸san, M. Alouani, O. Bengone, and O. Eriksson, Phys. Rev. B 75, 024412 (2007). [4] S. H. Jang, T. Kang, H. J. Kim, and K. Y. Kim, Appl. Phys. Lett. 81, 105 (2002). [5] Y. Choi and et al., Phys. Rev. B 75, 104432 (2007). [6] Z. Erd´elyi, M.Sladecek, L.-M. Stadler, I. Zizak, G. A. Langer, M. Kis-Varga, D.L.Beke, and B. Sepiol, Science 306, 1913 (2004). [7] A.Gupta, P. Rajput, A. Saraiya, V. R. Reddy, M. Gupta, S.Bernstorff, and H. Amenitsch, Phys. Rev. B 72, 075436 (2005).
since it is known that the multilayer diffusivities at the interfaces are very different because of high concentration of defects and possible concentration gradient [14]. The difference in the structure of the two interfaces can be understood in terms of the difference in the surface free energies of Fe(2.9Jm−2 ) and Si (1.2Jm−2 ) [15]. During the deposition of Fe on Si, the surface free energy of Si being lower, Si atoms try to move to the surface guided by the chemical driving force. This would lead to a stronger mixing at the interface and a possible formation of FeSi2 compound. On the other hand, during the deposition of Si on Fe, no such chemical driving force exists, therefore the intermixing at Si-on-Fe interface would take place as a result of random thermal motions only and hence concentration profile is expected to be an error function. In conclusion, x ray standing wave technique has been used to get concentration profile of Fe layer in Si/Fe/Si trilayer. The precision of this technique is sufficient to differentiate between the two interfaces of the Fe layer. This allows one to study interdiffusion at the two interfaces namely Fe-on-Si and Si-on-Fe independently. Interestingly the diffusivities at the two interfaces are significantly different. This seemingly counter-intuitive result can be understood in terms of a difference in the structure of the two interfaces in the as-deposited film itself. CEMS measurements show that while at Si-on-Fe interface, the Fe concentration profile is an error function, at Fe-on-Si interface an interlayer exists with approximate composition of FeSi2 . This difference in the structure of the two interfaces is the cause of different diffusivities at the two interfaces. Besides being of fundamental importance in understanding the interfacial diffusion at nanometer scale, present results have important implications on the use of controlled thermal annealing for tailoring the properties of multilayers for a wide variety of applications. Acknowledgement: Partial support from the IndoFrench Center for Promotion of Advanced Research is acknowledged.
[8] M. J. Bedzyk, G. M. Bommarito, M. Caffrey, and T. L. Penner, Science 248, 52 (1990). [9] A. Gupta, D. Kumar, and C. Meneghini, Phys. Rev. B 75, 064424 (2007). [10] M. Gupta, A. Gupta, D. Phase, S. Chaudhari, and B. Dassanacharya, Appl.Surf.Scien. 205, 309 (2003). [11] L. G. Parratt, Phys.Rev 95, 359 (1954). [12] M. Walterfang, W. Keune, K. Trounov, R. Peters, U. Rucker, and K. Westerholt, Phys.Rev.B 73, 214423 (2006). [13] J.Desimoni, F.H.Sanchez, M. F. van Raap, X. Lin, H. Bernas, and C. Clerc, Phys.Rev.B 54, 12787 (1996). [14] W.-H. Wang and et al., Phys.Rev.B 59, 10811 (1999). [15] F. J. Himpsel and et al., Mag.nano 47, 511 (1998).