AUDIOMETER WITH FREE SOFTWARE IN A WEB ENVIRONMENT Diego Murillo, Ever Velásquez, Carlos Castro, Andrés Cárdenas
Affiliation: {Universidad de San Buenaventura Medellín} e-mail: {
[email protected],
[email protected],
[email protected],
[email protected]}
Abstract In this work is presented the construction and calibration process of an audiometer designed free software according to the Colombian standard NTC 2884 which is based on international standard ISO 389. This equipment allows audiometric testing by air and bone conduction, using a free software application in a web environment, for managing information concerning to audiometric test as well as operation frequencies and its respective intensity levels. The hardware design involve of an electronic module for amplification, demultiplexingmulteplexing and filtering, which ensure the purity of the generated tone. The audiometer was calibrated and certified by a specialized laboratory for audiological equipment. The final result was a low-cost audiometer, with high reliability and adjusted to international standards. Keywords: Audiometer, Hearing Loss, Free Software
1 Introduction Noise pollution is a problem of great relevance worldwide. This type of pollution is generated in many ways, in urban areas there are various sound sources that produce high levels of sound intensity as transportation, airports, industries, clubs, bars and taverns [1]. Currently, there is a phenomenon of decline in hearing ability in younger people, due to some daily routines like work in industry, use of portable audio players constantly and inappropriate, and frequent visits to nightclubs and bars. In all these cases sound intensity levels are near the maximum audible level. Additional to this, the general population does not undergo audiometric testing in order to know their status hearing, that which degenerate progressively auditory system. On one side is not a routine in the health institutions carry out audiometric testing in the population since the degeneration of the auditory system is not considered a public health problem. Moreover,
1
INTERNOISE 2010 │ JUNE 13-16 │ LISBON │ PORTUGAL
such tests require specialized equipment and high cost, which its makes less accessible to society. All this shows that obtaining an audiometric device, low cost and greater portability, would help in part to show, by means of newspaper records, evolution and behavior of a specific population. In order to mitigate this problem in our country and the world are have raised a number of solutions in the design and construction of audiometers. C. G. Ortiz et. al School of Engineering of Antioquia (EIA) with the CES University in Medellin , is obtained a virtual audiometer [2] that performs tests for bone and air pathways. This prototype is designed in Labview 7.1 platform and allows to the audiologist do the reports, storage data and review of the reviews made to the patient. D. M. Murillo et. al. built a type 5 software audiometer in Visual Basic 6.0 that allows both testing by air and bone, which can controlling the intensity levels manually or automatically. This application stores the results in a database which allows monitoring and recording of various tests to make comparisons and determine trends in the hearing state [3]. This audiometer is based in Colombian Standard [4]. Norio Nakamuta [5] developed a mobile audiometer to detect hearing loss using a mobile phone with Java and ringtones. The design is composed of a server connected to the internet which distributes the program audiometry, a database to record key patient data and a mobile phone that emits tones to perform the audiometric test, also the results are stored temporarily in memory phone. The design was made to probe easily the hearing capacity in a short time. Han-Chang Wuy [6] and his team designed an audiometer at low cost using a direct digital synthesizer (DDS) to generate pure sinusoidal signals, an attenuator to limit the intensity of the tones, a microcontroller to control the frequency and amplitude of tones, a data acquisition card, which in this case is the interface between the electronic system designed and the computer. In our work we develop a free software-based audiometer using JAVA language [7], which to able to do audiometric testing by air and bone. The construction is based on the integration of software and hardware components that allow for proper operation and compliance the technical Colombian Standard [4]. The electronic development consists of a stage of multiplexing, filtering, amplification and interface for the capture of stimuli. The software is by Web and improves portability, analysis and dissemination of results. It consists of a graphical user interface to do the test and a database to store patient information.
2 Theoretical Frame 2.1
Acoustics and Psychoacoustics
The ear is responsible for the processes of hearing and balance in the human body. It is composed of three parts: outer ear, middle ear and inner ear.The outer ear is responsible for improving the spread of the frequencies of the incide waves that coming towards him, through a combination of the shell and the ear, because are created resonance effects which modify the frequencies entering the ear. The pressure waves travel through the canal and reach the middle ear. The middle ear consists of the eardrum, the tympanic cavity and three tiny bones hammer, anvil and stirrup. The tympanic membrane is located between the outer ear and the middle ear and therefore receives the sound waves which travel through the ear
2
INTERNOISE 2010 │ JUNE 13-16 │ LISBON │ PORTUGAL
canal, doing to vibrate the membrane due to pressure changes. The eardrum is connected to the three bones in where is reduced the pressure by a factor of 20 times. After reducing pressure in the middle ear, the waves propagate to the inner ear. This has a form similar to that of a snail called the cochlea and is responsible for converting the mechanical vibrations that come from the middle ear into electrical impulses or signals neuroelectric. There, the membranes are responsible for the analysis and separation of frequencies. These membranes obtained a logarithmical dependence with the frequency of the incide waves, which makes useful a logarithmic scale for its measurement [8]
2.2
Theoretical bases
The sound is defined as a mechanical vibration that is transmitted in an elastic medium, whose oscillation frequency is in a range of 20 to 20,000 cycles per second. The ear's response is not linear for each frequency, so is used a logarithmic scale (decibel dB) for the measurement of intensity. The range of intensity or loudness to the human ear is from 0 dB and 130 dB, but these ranges of intensity changes for each frequency. The frequency range of human hearing system is between 20Hz to 20kHz. The sensitivity to the sounds of different frequencies varies across the range of pressure levels. On average, the minimum pressure variation that can be detected by the human ear is 20 microPascals [9]. The sound pressure is defined as the difference between the instantaneous pressure caused by the disturbance and reference atmospheric pressure at one point in particular. This relationship is given in the following equation:
(1) where Pi is the pressure initial and Pref reference pressure equal to 20 microPascals. The human ear does not have a linear behavior at low and high frequencies and is less sensitive in the mids [10]. Based on the foregoing, the decibel SPL is not suitable for evaluations of the auditory system, since the same level is not necessarily the same sensation of loudness [8]. The decibel HL takes account of these differences in sensitivity and provides 0 dB depending on sound frequency, so that audiometric tests generate a flat response in cytologically healthy patients.
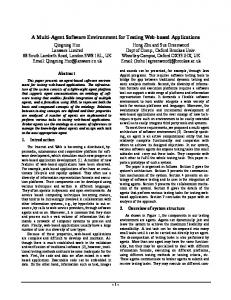
3 Methodology The audiometer is designed like an integration between hardware and software. The performance requirements are: sinusoidal frequencies reproduction for audiometric testing by pure tone, panorama control, integration of audio cards (internal and external) to characterize the audiometer response, filtering on specific frequencies and signal amplification level, Web environment software that allows interaction with users, for the calibration step, the development of audiometric testing, management of historical data, tabular and statistical reports. For electronic implementation are took into account the given requirements by the legislation [4] in terms of harmonic distortion, stabilization of the instrument and amplification levels. The Figure No. 1 shows the general outline of the audiometer.
3
INTERNOISE 2010 │ JUNE 13-16 │ LISBON │ PORTUGAL
Figure No 1 – Audiometer structure
3.1
Software Engineering equipment.
applied to the implementation of audiometric
Audiometric equipment construction, was based on a process of requirements elicitation and specification, with tools and techniques of software engineering. For the design and implementation is used an evolutionary and iterative prototyping. The IEEE Computer Society's Software Engineering Body of Knowledge defines "software engineering" as the application of a systematic, disciplined, quantifiable approach to the development, operation, and maintenance of software [11]. This definition has implications with the use of techniques, methodologies, tools, documentation and standards to produce quality software. For the specification of requirements was used the Unified Modeling Language (UML). According OMG (Object Management Group) the UML is a language that helps to specify, visualize and document models of software systems [12]. In this work was utilized use case high-level and extended use case for design and specification requirements For the design of software architecture was implemented a variant of the Model-ViewController (MVC), the sequence of events is based entirely on this variant. Figure No. 2 We present a sequence diagram illustrating the use of this architecture.
4
INTERNOISE 2010 │ JUNE 13-16 │ LISBON │ PORTUGAL
Figure No 2 - Sequence Diagram audiometric testing process. MySQL® was the database manager system used to develop the application. In Figure No. 3 shows the relational model.
Figure No 3 - Type 3 audiometer relational model.
3.2
Electronic Design & Development
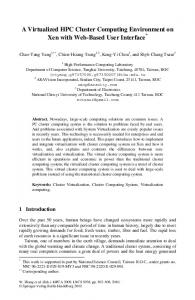
The electronic design must meet two basic requirements raised in the NTC2884 [4]. According to standard, the signal must be amplified to 100 dB(HL) and must have a total harmonic distortion less than 3%. The electronic implementation is divided into six items: the pre-amplification, demultiplexing, filtering, multiplexing, amplification, reproduction and transmission / reception, as shown in Figure No. 6.
5
INTERNOISE 2010 │ JUNE 13-16 │ LISBON │ PORTUGAL
Figure No 4 - Electronic design. In step 1a, the test signals are generated digitally by software and are converted to analog through the sound card Mbox 2 from Digidesign. Since the signal given by the application should be recognized and routed to a specific filter, the computer software sends a binary code to microcontroller and then it sends to the demultiplexer. In the third item, the signal prove is filtered and multiplexed in 2b. in step 4 the audio signal is amplified and played in 5. Finally, 6a and 6b transmit and receive respectively a encoded pulse which is produced when the patient hears the pure tone. 3.2.1 Pre-amplifier, microcontroller and demultiplexing The pre-amplification stage uses a sound card Mbox 2, which increases the level of the test signal up to 80dBHL and ensures a THD of 0.002%. The manipulation of control bits, the recognition of listener pulse and the processing is performed by a microcontrolling step. The microcontroller MCF51QE128 of 32bits developed by FreeScale was used in the implementation. This device communicates with the computer through the module of USB-SERIAL conversion, FT232 as is shown in figure 5(a).
(a)
(b)
Figure No 5. a) - Schematic circuit of FT232. b) - Multiplexer schematic diagram. To select sinusoidal signals of 250Hz, 500Hz, 1000Hz, 2000Hz, 4000Hz and 8000Hz, corresponding at audiometric testing was used the integrated circuit multiplexer and demultiplexer HFC4051BE which guaranteed that harmonic distortion was it less than 0.04%. In Figure 5(b) is shown the topology used to implement the multiplexer-demultiplexer IC. In laboratory test was found a THD less than 0.0003%. As the audiometric test accuracy is necessary filter signals so that the fundamental frequency is not altered by noise and distortion-free.
6
INTERNOISE 2010 │ JUNE 13-16 │ LISBON │ PORTUGAL
3.2.2 Pass Band Filter Design For filtering the signals, it was decided to implement narrowband filters with two design criteria based on the transition band and the THD. Is expected remove the frequency component from the first harmonic and a distortion of less than 0.04%. To find the values of the resistors and capacitors were used the method suggested by Kaufman [13], which is based on the choice of the bandwidth, center frequency and the quality factor. During the design of the filters, was found that if the quality factor (Q) increased the resistor values calculated fell to one-tenth of Ohm, which produced a short circuit at the source. This was solved by finding a balance between good quality factor and some acceptable resistance values. However, it was found that the sound card Mbox 2 increased the passband width as the frequency decreased. Therefore, was ensured a quality factors at low frequencies around 25 and 10 in high frequencies. For the implementation, the LME49740NA operational amplifier was used and a 0.00003% of harmonic distortion was achieved. 3.2.3 Amplification, Reproduction, Transmission and Reception The amplification stage must meet the requirements of harmonic distortion and amplification to 100dBHL; for a test by air. Whereby the amplification is the most critical in the electronics design, as this may saturate the headphones and generate distortion, which becomes a nonlinearity that drastically alters the desired performance specifications for the audiometer. To meet the requirements was chosen the high definition power amplifier TDA2040, which establishes a maximum THD of 0.1% approximately and a power amplification of 30Watts. The amplifier circuit showing in Figure No 6, can increase gain if the potentiometers P4, P5 y P7 are manipulated.
Figure No 6. - Power Amplifier variable (Po>30W) Not was possible found a relationship between of power in watts and dBHL, because this logarithmic measurement unit implies acustic and electrical properties into one, which involving aspects such as design of the amplifier and its gain, the design of headset itself and the outer ear. This shown that power gain of the amplifier is a variable of the measurement in dBHL.
7
INTERNOISE 2010 │ JUNE 13-16 │ LISBON │ PORTUGAL
Finally, for interaction patient - hearing test, was used a module of transmitting and receiving RLP434 and TLP434A respectively, which is tuned to 433.92Mhz. This system sends encoded binary pulses that are received by a microcontroller and in turn sent to the computer on serial mode. Summarizing, the electronic instrumentation has a total harmonic distortion less than 0.5%, thereby met all the requirements established.
4 Results and discussions Audio Web consists of 5 modules: Home, patient, test, calibration and manager (see Figure No 7). Inicio identifying the type of profile counting user with three options. The manager has access to and control over the database and its structure, can modify your settings for intensity levels allowing the calibration process in audiometric equipment. The specialist has sufficient privileges for make audiometric testing and results monitoring, also has access to consultation and statistical reports. Finally, the patient only may consult his medical history.
Figure No 7 – Screen Audiometer Software The paciente module creates new users, allow consult tests on each beneficiary and amending personal information from them. In prueba the audiometer makes exams performed by air and bone, for this, load values related to the intensity from the database created in MySQL. The stimulation by pure tones is done through reproducing audio files (*.wav) through the implementation of the library javax.sound.sampled. Also is possible stored in the database a different external sound cards configurations to work with various manufacturers. The sound card used in the audiometer is the M-Box 2 Pro, which has 6 balanced outputs that are manipulated from software for the routing of signals. The transducers used for the examination by air is the headset TDH 39 and by bone conduction is the vibrator B71, them are validated for international standards related with audiometric exams.
8
INTERNOISE 2010 │ JUNE 13-16 │ LISBON │ PORTUGAL
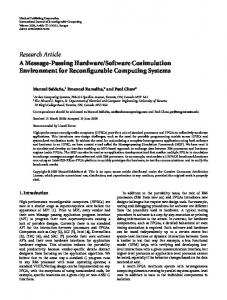
The software allows intensity control level automatically (AutoThreshold Test) or mechanical where the specialist determines the time interval for the variation of level. The patient response is directly captures from the hardware interface, what minimizes a possible error when determining the threshold of hearing. Additionally, the software generates reports related to age, thresholds, type of activity, city, etc. In the administrador option is possible define the working directory, active sound card, routing of signals and offers a visualization of users with their respective profiles. Calibración allows establish of intensity levels by frequency and by type of transducer. Its incorporation in the device permits validate its operation in a laboratory specializing in audiological equipment. The validation and certification process was complete in laboratory Technick Ltda, the verification report No 10,041 and calibration certificate No 0499 ensures the proper functioning of audiometer. The review of the device was made based on the following standards: ISO 389-1-3, IEC 373, IEC 303 and ANSI S3.6-1996. In the Figure No. 8 presents the audiometer's behavior with relation to ISO 389 (1-3) standard [14].
Standard ISO 389-1 [14] Left value Right value
95
INTENSITY (dB SPL)
INTENSITY (dB SPL)
80
90
85
80
75
Standard Average value
70
65
60
55
75 50
0
1000
2000
3000
4000
5000
6000
7000
8000
0
500
1000
1500
2000
2500
3000
3500
4000
FREQUENCY (Hz)
FREQUENY (Hz)
(a)
(b)
Figure No 8 – Calibration Results a) Air conduction b) Bone conduction. The size of error bands are established by the NTC 2884 Standard [4] which determines a tolerance of 3 dB for the amplitude level. Additionally, the standard provides an accuracy of 3% in the frequency, in the measured frequencies were found maximum differences of 0.63 Hz which correspond to the uncertainty of measurement equipment. These differences in the frequencies are very low compared to the maximum allowed by the NTC [4].
5 Conclusions The integration of hardware and software enhances the functionality and quality of the audiometer, optimizing the use, reporting and analysis capabilities. The electronic development allows improve the quality and features of the audiometer to be classified as type 3, however this stage can be removed for reducing the manufacturing cost and obtain basics audiometers which are used for earlier exams.
9
INTERNOISE 2010 │ JUNE 13-16 │ LISBON │ PORTUGAL
To be developed in a web environment, the audiometer only requires install the sound card in the pc and have an internet connection which facilitates the portability and information management. However, the software also works as localhost.
References [1] OMS, Organización Mundial de la Salud, Guías Para El Ruido Urbano, London, 1999. [2] Ortiz C. G., Vélez J. A., Vanegas C. Z. y Marín J. M., Diseño y Construcción de un Audiómetro Virtual, Revista Ingeniería Biomédica, (No 1), 2007, pp. 52-54. [3] Murillo D. M., Castro C. A., Aplicativo De Software Para Audiómetro De Tamizaje, 8th Conferencia Iberoamericana en Sistemas, Cibernética e Informática; Orlando, USA, Volumen 3, ISBN 1-934272-66-3; 2009. [4] Icontec; Norma Técnica Colombiana NTC 2884-1: Acústica- Audiómetros, Colombia, 1991. [5] Nakamura N,. Development of Mobile Audiometric Test System Using Mobile Phones. National Institute of Advanced Industrial Science and Technology (AIST), JAPAN. IEEE. [6] Wu H., Yang L., Chen C., Young S., Kuo T.. A Low-Cost Architecture of Audiometer Based on Direct Digital SYNTHESIZER. Proceedings of the first Joint BMES/EMBS Conference Serving Humanity, Advancing Technology. IEEE. [7] Sun MicroSystems, “Glosary-JAVA”, http://sunsolve.sun.com/handbook_pub/validateUser.do?target=Systems/commondocs/glossary” (date accessed: 29/09/2009). [8] Howard D.M., Angus J. Acoustics and psichoacoustics, Elsevier, England, 1 ed., 2006. [9] Talbot-Smith, M., Audio Engineer’s Reference Book, Focal Press, England, 2 ed., 1999. [10] Bonello O., Ruffa F., Gavinowich D, Protocolo De Mediciones Para Trazado De Mapas De Ruido Normalizados” Argentina, 2002. [11] IEEE Computer Society, Software Engineering, Curriculum Undergraduate Degree Programs in Software Engineering” 2004.
Guidelines
[12] The Object Management Group, What Is http://www.omg.org/gettingstarted/what_is_uml.htm (date accessed: 29/09/2009).
for
UML,
[13]
Kaufman M., Electrónica Moderna Práctica, Mcgraw-Hill, 1999.
[14]
ISO, 389 Standard, Acoustics -- Reference zero for the calibration of audiometric equipment, 1998.
10