Australian Unity Wellbeing Index Survey 18.1 Report 18.1 February 2008
Part A: The Report “The Wellbeing of Australians – The effect of seven successive home-loan rate rises”
Robert A. Cummins School of Psychology, Deakin University
Adrian Tomyn, Jacqui Woerner and Adele Gibson, Doctoral Students, School of Psychology, Deakin University
Australian Centre on Quality of Life Deakin University, 221 Burwood Highway Melbourne, Victoria 3125, Australia http://www.deakin.edu.au/research/acqol/index_wellbeing/index.htm
Published by Deakin University, Geelong, Victoria 3217, Australia First published 2008 © Deakin University and Australian Unity Limited ISBN 978 1 74156 104 3
This is a joint publication of: The School of Psychology, Deakin University The Australian Centre on Quality of Life, Deakin University Australian Unity Correspondence should be directed to: Professor Robert A. Cummins Deakin University Geelong, Victoria 3217 Australia Email:
[email protected] Website: http://www.deakin.edu.au/research/acqol/index.htm
Australian Unity Wellbeing Index, Report 18.1, February 2008
Table of Contents Executive Summary ...............................................................................................................................................v 1.
Introduction...........................................................................................................................................1
1.1. 1.2. 1.3. 1.4. 1.5.
Background .............................................................................................................................................1 Understanding Personal Wellbeing .........................................................................................................2 The Survey Methodology........................................................................................................................3 Presentation of results and type of analysis.............................................................................................3 Internal Report Organisation...................................................................................................................3
2.
A Comparison Between Survey 18.1 and Survey 18 ..........................................................................4
2.1. 2.2. 2.3.
Overview.................................................................................................................................................4 Personal Wellbeing Index .......................................................................................................................5 Personal Wellbeing Domains ..................................................................................................................7
3.
Household Income...............................................................................................................................17
3.1. 3.1.1. 3.1.2. 3.1.3. 3.1.4. 3.2. 3.3. 3.3.1. 3.4.
Income and Wellbeing ..........................................................................................................................18 Personal Wellbeing Index .....................................................................................................................18 Personal Domains..................................................................................................................................20 Domain Discrimination with Income ....................................................................................................21 Personal Wellbeing Index Changes Across Surveys x Income .............................................................22 Income and Gender ...............................................................................................................................22 Income and Age ....................................................................................................................................23 Income x Age x Gender ........................................................................................................................24 Regression of PWI Domains against Life as a Whole...........................................................................25
4.
Gender..................................................................................................................................................28
4.1. 4.2. 4.2.1. 4.2.2. 4.3. 4.3.1. 4.3.2. 4.3.2.1. 4.3.2.2. 4.3.2.3. 4.3.2.4. 4.4. 4.4.1. 4.4.2. 4.4.2.1. 4.4.2.2. 4.5. 4.5.1. 4.5.2.
Overall Distribution ..............................................................................................................................28 Gender and Wellbeing...........................................................................................................................28 Personal Wellbeing Index .....................................................................................................................28 Personal Wellbeing Domains ................................................................................................................29 Gender and Age ....................................................................................................................................32 Personal Wellbeing Index .....................................................................................................................32 Gender x Age: Domains.......................................................................................................................34 Standard of Living.................................................................................................................................34 Relationships.........................................................................................................................................35 Safety ....................................................................................................................................................36 Community............................................................................................................................................36 Normative Data Based on Individual Scores.........................................................................................37 Personal Wellbeing Index .....................................................................................................................37 Age Norms (individual scores) .............................................................................................................38 Male Norms x Age ................................................................................................................................38 Female Norms x Age ............................................................................................................................38 Normative Data based on Survey Mean Scores ....................................................................................40 Personal Wellbeing Index and Domains ...............................................................................................40 Normative: Gender x Age ....................................................................................................................41
5.
Age........................................................................................................................................................44
5.1. 5.2. 5.2.1. 5.2.2. 5.2.2.1. 5.2.3. 5.2.4. 5.3. 5.4. 5.5.
Distribution Overall ..............................................................................................................................44 Age and Wellbeing................................................................................................................................44 Personal Wellbeing Index .....................................................................................................................44 Age x Surveys .......................................................................................................................................45 The Oldest Group..................................................................................................................................47 Personal Wellbeing Domains ................................................................................................................48 Life as a Whole .....................................................................................................................................50 Normative Data Generated from Individual Scores ..............................................................................50 Normative Domain Scores (raw data) ...................................................................................................51 Normative Data from Survey Mean Scores (N=18)..............................................................................52
Australian Unity Wellbeing Index, Report 18.1, February 2008
i
Table of Contents Continued
5.6.
Normative Domain Scores (Survey Mean Scores : N=18)....................................................................53
6.
Money Matters ....................................................................................................................................55
6.1. 6.2. 6.3. 6.4. 6.5.
Shares....................................................................................................................................................55 Cost of Living .......................................................................................................................................55 Interest Rates.........................................................................................................................................56 Investments ...........................................................................................................................................57 Summary ...............................................................................................................................................57
Appendix A1 .........................................................................................................................................................59 A1.1
References to the Text...........................................................................................................................59
Acknowledgement We thank Ann-Marie James for word processing this document. All analyses in this Report were performed by Jacqui Woerner, Adrian Tomyn and Adele Gibson.
Australian Unity Wellbeing Index, Report 18.1, February 2008
ii
Index of Tables Table 2.1: Table 3.1: Table 3.2: Table 3.3: Table 4.1: Table 5.1:
Means and standard deviations of the 18.1 survey................................................................................ 4 Income Frequency (Survey 18.1)........................................................................................................ 17 The Cost of Each PWI Increment ....................................................................................................... 19 Rank Order of Domains ...................................................................................................................... 22 Range (2SD) of Personal Wellbeing Mean Scores over Surveys, 1-13 .............................................. 40 Mean Domain Score Changes for 76+y (Personal Wellbeing Index) ................................................. 46
See Part B for Appended Tables.
Australian Unity Wellbeing Index, Report 18.1, February 2008
iii
Index of Figures Figure 1.1: Interest Rate Rises May 2002 – February 2008................................................................................... 1 Figure 2.1: Personal Wellbeing Index.................................................................................................................... 5 Figure 2.2: Satisfaction with Standard of Living ................................................................................................. 7 Figure 2.3: Satisfaction with Health...................................................................................................................... 8 Figure 2.4: Satisfaction with What you are Currently Achieving in Life .......................................................... 9 Figure 2.5: Satisfaction with Relationships ........................................................................................................ 10 Figure 2.6: Satisfaction with How Safe you Feel................................................................................................ 11 Figure 2.7: Satisfaction with Feeling Part of Your Community ....................................................................... 13 Figure 2.8: Satisfaction with Future Security .................................................................................................... 14 Figure 3.1: Income and the Personal Wellbeing Index (combined surveys) ..................................................... 18 Figure 3.2: The cost of purchasing a percentage point of personal wellbeing ..................................................... 19 Figure 3.3: Magnitude of Difference Within the Personal Domains from S2, S4,S5,S10,S11 79
78
Strength of satisfaction
77
>S1
76
75
Key:
d
e
f
g
h
Au g
20 No 0 2 v 20 S6 0 M ar 2 20 S7 Ju 03 n S8 20 Au 03 g 20 S9 No 0 3 v S1 20 0 Fe 0 3 b S1 20 1 04 M a y S1 20 2 Au 04 g 20 04 S1 3 M ay 20 05 S1 4 O ct 20 05 S1 5 M ay 20 06 S1 6 O ct 20 06 S1 7 Ap r2 00 7 S1 8 S1 Oc t 8. 20 1 Fe 07 b 20 08
c
S5
S4
M ar 20 02
b
S3
Se pt 20 01
a
S2
S
1
Survey Date
Ap r2 00 1
Major events 74 preceding survey
a = September 11 b = Bali Bombing
c = Pre-Iraq War d = Hussein Deposed
e = Athens Olympics f = Asian Tsunami
g = Second Bali Bombing h = New IR Laws
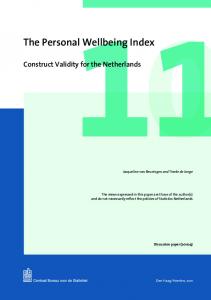
Figure 2.2: Satisfaction with Standard of Living
Satisfaction with standard of living has numerically fallen 0.2 points (non-significant) since Survey 18 (Table A2.1). This maintains an upward tend since May 2006 (S15). The values for this domain have generally remained significantly higher than they were at Survey 1, with only two (Survey 4 in 2002 and Survey 15 in 2006) being statistically at the same level. Thus, 15/17 (88.2%) of survey mean scores are higher than Survey 1. The range of scores is 4.7% between April 2001 (S1:74.5) and August 2004 (S12:Olympics: 79.2). It is fascinating to note that the rise in satisfaction with Standard of Living since May 2006 has occurred despite a succession of 0.25 point rises in interest rates.
Australian Unity Wellbeing Index, Report 18.1, February 2008
7
Section 2 A Comparison Between Survey 18.1 and Survey 1 continued
Health 77
76
Strength of satisfaction
>S1
75
74
Key:
d
e
f
g
h
Au g
20 No 0 2 v 20 S6 0 M ar 2 20 S7 Ju 03 n S8 20 Au 03 g 20 S9 No 0 3 v S1 20 0 Fe 0 3 b S1 20 1 0 M ay 4 S1 20 2 Au 04 g 20 04 S1 3 M ay 20 05 S1 4 O ct 20 05 S1 5 M ay 20 06 S1 6 O ct 20 06 S1 7 Ap r2 00 7 S1 8 S1 Oc t 8. 20 1 Fe 07 b 20 08
c
S5
S4
M ar 20 02
b
S3
Se pt 20 01
a
S2
S
1
Survey Date
73
Ap r2 00 1
Major events preceding survey
a = September 11 b = Bali Bombing
c = Pre-Iraq War d = Hussein Deposed
e = Athens Olympics f = Asian Tsunami
g = Second Bali Bombing h = New IR Laws
Figure 2.3: Satisfaction with Health
Satisfaction with health has risen by a non-significant 0.1 point since Survey 18. It remains not different (+1.5 points) from its level at Survey 1. Historically, this domain rose briefly at March 2003 (S6:Pre-Iraq war) but quickly returned to its original level. It is notable that the level of significance at Survey 6 was marginal (p=.02) and so may reflect a random fluctuation. The overall ANOVA between surveys is also only marginally significant (Table A 2.1). It is evident that satisfaction with personal health is little influenced by world or national events and this stability is confirmation that the change in other domains since Survey 1 are valid. The range of scores is 2.4% between April 2001 (S1:73.6) and March 2003 (S6:Pre-Iraq war:76.0).
Australian Unity Wellbeing Index, Report 18.1, February 2008
8
Section 2 A Comparison Between Survey 18.1 and Survey 1 continued
Achieving 77
76
75
Strength of satisfaction
>S1
74
73
72
71
Key:
h
c = Pre-Iraq War d = Hussein Deposed
e = Athens Olympics f = Asian Tsunami
O ct S1 6
S6
a = September 11 b = Bali Bombing
S1 8 S1 Oct 8. 20 1 Fe 07 b 20 08
g
Ap r2 00 7
f
20 06
e
S1 7
d
20 0 M ar 2 20 S7 Ju 03 n S8 20 Au 03 g 20 S9 No 0 3 v S1 20 0 Fe 0 3 b S1 20 1 04 M S1 ay 2 2 00 Au 4 g 20 04 S1 3 M ay 20 05 S1 4 O ct 20 05 S1 5 M ay 20 06
20 02
c
No v
Au g
S5
S4
M ar 20 02
b
S3
Se pt 20 01
a
S2
S
1
Survey Date
Ap r2 00 1
70 Major events preceding survey
g = Second Bali Bombing h = New IR Laws
Figure 2.4: Satisfaction with What you are Currently Achieving in Life
Achieving in life has not fallen by a non-significant 0.4 points since Survey 18. It remains no different than it was at Survey 1. The wording of this item has changed once. From Survey 1 to Survey 10, satisfaction with ‘what you achieve’ barely changed over the surveys. It was marginally higher at Survey 6 (Pre-Iraq war), and the range of scores was 1.8% between April 2001 (S1:73.2) and March 2003 (S6:Pre-Iraq war:75.0). In Survey 11 the wording of this item changed from ‘How satisfied are you with what you achieve in life?’ to ‘How satisfied are you with what you are currently achieving in life?’. The reason for this change is to make it more explicit that the question referred to current life rather than to some past aggregation of achievement. The effect of this word change has significantly reduced the score for this domain. The average value over Survey 1 to Survey 10 is 74.47 (SD=0.45). The average value over Survey 11-Survey 17 is 72.96 (SD = 0.53). So it appears to still be a highly reliable measure that has stabilised about 1.5 points below the original and no different from Survey 1.
Australian Unity Wellbeing Index, Report 18.1, February 2008
9
Section 2 A Comparison Between Survey 18.1 and Survey 1 continued
Relationships 82
81
>S2, S3,S4,S5 >S1
80
79 Strength of satisfaction
78
77
76
75
Key:
d
e
f
g
h
Au g
20 No 0 2 v 20 S6 0 M ar 2 20 S7 Ju 03 n S8 20 Au 03 g 20 S9 No 0 3 v S1 20 0 Fe 0 3 b S1 20 1 0 M ay 4 S1 2 0 2 Au 04 g 20 04 S1 3 M ay 20 05 S1 4 O ct 20 05 S1 5 M ay 20 06 S1 6 O ct 20 06 S1 7 Ap r2 00 7 S1 8 S1 Oct 8. 20 1 Fe 07 b 20 08
c
S5
S4
M ar 20 02
b
S3
Se pt 20 01
a
S2
S
1
Survey Date
74
Ap r2 00 1
Major events preceding survey
a = September 11 b = Bali Bombing
c = Pre-Iraq War d = Hussein Deposed
e = Athens Olympics f = Asian Tsunami
g = Second Bali Bombing h = New IR Laws
Figure 2.5: Satisfaction with Relationships
Satisfaction with relationships has fallen by a massive and significant 2.0 points since Survey 18. It remains no difference from Survey 1 but now lies numerically 1.0 point below its level at Survey 1. The only other survey to fall below the level of Survey 1 is Survey 13, which registered 77.6 points. Thus, the current value of 77.2 points is the lowest yet recorded. While there is no obvious reason for this it is important to note that its current level is not significantly below that of Survey 1. The highest value for this domain has been 81.39 points at the time of the Athens Olympics (S12). It has fallen a massive 4.2 points since then. At Survey 13 this domain recorded its lowest ever value (77.64) down 3.8 points from the Olympics (S12) value of 81.39 points. It has not statistically changed since then. The overall pattern of change for this domain does not conform to that of the Personal Wellbeing Index (Figure 2.1) in that the earlier rise is restricted to the period surrounding the Iraq war. It therefore differs from the domains Standard of Living, Safety, Community, and Future Security, all of which rose significantly in the period following September 11. Perhaps this difference is due to the fact that these other domain changes were reactions to a past event, whereas the rise in Satisfaction with relationships at Survey 6 was in anticipation of the looming war, to which Australian troops were clearly to be committed. At this time, both of the domains involving other people rose significantly (relationships and community). Perhaps the anticipation of war drew people closer to their family and friends as well as enhancing bonding with the general community. These changes then dissipated as the period of the war was left behind, but the domain was again briefly elevated during the period of the Olympics. The range of scores is 4.2 points between February 2008 (S18.1:77.2) and February 2008 (S18.1: Olympics:81.4).
Australian Unity Wellbeing Index, Report 18.1, February 2008
10
Section 2 A Comparison Between Survey 18.1 and Survey 1 continued
Safety 82
81
80
79 Strength of satisfaction
78
77
>S8
>S3,S4,S6
>S2,S5
>S1
76
75
Key:
h
S6
a = September 11 b = Bali Bombing
c = Pre-Iraq War d = Hussein Deposed
e = Athens Olympics f = Asian Tsunami
S1 8 S1 Oct 8. 20 1 Fe 07 b 20 08
g
Ap r2 00 7
f
S1 7
e
20 06
d
20 0 M ar 2 20 S7 Ju 03 n S8 20 Au 03 g 2 S9 0 No 0 3 v S1 20 0 Fe 0 3 b S1 20 1 04 M a y S1 20 2 Au 04 g 20 04 S1 3 M ay 20 05 S1 4 O ct 20 05 S1 5 M ay 20 06
20 02
c
No v
Au g
S5
S4
M ar 20 02 S3
Se pt 20 01 S2
Ap r2 00 1 S
1
Survey Date
b
O ct
a
S1 6
74 Major events preceding survey
g = Second Bali Bombing h = New IR Laws
Figure 2.6: Satisfaction with How Safe you Feel
Satisfaction with personal safety has fallen by a non-significant 0.2 points since Survey 18 (Table 2.1). It remains at one of its highest level yet recorded. The first major rise followed the defeat of Saddam Hussein in Iraq at Survey 7 and has been maintained ever since. This sustained rise may have been linked to the positive feelings of relief following the defeat of Hussein without unleashing weapons of mass destruction, and subsequently our increasingly strong American alliance. The rise during the Olympics (S12) may have been more due to the overall sense of elevated wellbeing than to specific feelings of greater safety. The current rise is hard to explain but is associated with a relatively low proportion of the sample feeling that a terrorist attack is likely (see Section 2.8). The range of scores is 5.0 points between April 2001 (S1:75.2) and October 2007 (S18: 80.2). It is interesting to relate these data on safety to the sense of terrorist threat that is felt by the population. Since Survey 9 (November 2003) we have asked people ‘whether they think a terrorist attack is likely in Australia in the near future’ and, if they say ‘Yes’, we ask about the strength of their belief that such an attack will occur. These data are combined with the population levels of ‘Satisfaction with Safety’ in Table A2.9. It can be seen that the average level of safety satisfaction correlates negatively with the percentage of people who think an attack is likely (r = -.49) and less strongly with the strength of belief among those respondents who think an attack likely (r = -.15). The correlation of -.49 explains about 24% of the variance between these two measures, which is a significant degree of co-variation. Other factors that will be contributing variance to safety are homeostasis, personal circumstances and, quite possibly, the sense of security offered by an effective wellbeing military force and alliance with the USA. The
Australian Unity Wellbeing Index, Report 18.1, February 2008
11
Section 2 A Comparison Between Survey 18.1 and Survey 1 continued
latter influence, exemplified by the rise in safety at Survey 7 (defeat of Hussein) may represent a constant background factor onto which the fluctuations in terrorist attack probabilities are imposed. One implication of these results is that raising terrorist attack fears through issuing terrorist alerts, harms the safety satisfaction, and thereby compromises the overall wellbeing of vulnerable members of the population.
Australian Unity Wellbeing Index, Report 18.1, February 2008
12
Section 2 A Comparison Between Survey 18.1 and Survey 1 continued
Community 74
73
72
Strength of satisfaction
71
>S4,S5,S11
>S1
70
69
Key:
h
S6
a = September 11 b = Bali Bombing
c = Pre-Iraq War d = Hussein Deposed
e = Athens Olympics f = Asian Tsunami
S1 8 S1 Oct 8. 20 1 Fe 07 b 20 08
g
Ap r2 00 7
f
S1 7
e
20 06
d
20 0 M ar 2 20 S7 Ju 03 n S8 20 Au 03 g 2 S9 0 No 0 3 v S1 20 0 Fe 0 3 b S1 20 1 04 M a y S1 20 2 Au 04 g 20 04 S1 3 M ay 20 05 S1 4 O ct 20 05 S1 5 M ay 20 06
20 02
c
No v
Au g
S5
S4
M ar 20 02 S3
Se pt 20 01 S2
Ap r2 00 1 S
1
Survey Date
b
O ct
a
S1 6
68 Major events preceding survey
g = Second Bali Bombing h = New IR Laws
Figure 2.7: Satisfaction with Feeling Part of Your Community
People’s satisfaction with feeling part of their community has risen by a non-significant 0.6 points since Survey 18. It remains statistically higher than Survey 1. Apart from the Olympic period elevation (S12), the previous rises are coherently related to times of major conflict. In the six months following September 11, satisfaction with community connectedness went up from its lowest level in April 2001, and was maintained at this higher level for a further six months. It then fell, but returned to an even higher level in the lead-up to the Iraq war (S6). This higher level was maintained for six months following the defeat of Hussein (S9), then dissipated only to be recharged once again following the second Bali bombing (S14). This pattern is consistent with social psychological theory. An external threat will cause a group (or population) to become more socially cohesive. The range of scores is 4.0 points between April 2001 (S1:68.6) and August 2004 (S12:Olympics:72.6).
Australian Unity Wellbeing Index, Report 18.1, February 2008
13
Section 2 A Comparison Between Survey 18.1 and Survey 1 continued
Future Security 74
73 >S4, S5, S11 72 >S4 Strength of satisfaction
71
>S1 >S2
70
69
68
Key:
d
e
f
g
h
Au g
20 No 0 2 v 20 S6 0 M ar 2 20 S7 Ju 03 n S8 20 Au 03 g 20 S9 No 0 3 v S1 20 0 Fe 0 3 b S1 20 1 0 M ay 4 S1 2 0 2 Au 04 g 20 04 S1 3 M ay 20 05 S1 4 O ct 20 05 S1 5 M ay 20 06 S1 6 O ct 20 06 S1 7 Ap r2 00 7 S1 8 S1 Oct 8. 20 1 Fe 07 b 20 08
c
S5
S4
S3
Se pt 20 01 S2
20 01 Ap r S
1
Survey Date
b M ar 20 02
a
Major events preceding survey
a = September 11 b = Bali Bombing
c = Pre-Iraq War d = Hussein Deposed
e = Athens Olympics f = Asian Tsunami
g = Second Bali Bombing h = New IR Laws
Figure 2.8: Satisfaction with Future Security
Satisfaction with future security has risen by a non-significant 0.2 points since Survey 18. It fell strongly and significantly by 2.2 points between Surveys 14 and 15. Since that it has risen progressively higher and is now at its highest recorded level (73.2). In previous surveys, satisfaction with future security dropped to its lowest level immediately following September 11, and then rose to a significantly higher level six months later (S3). It then rose again immediately following the Iraq war (S7), and then gradually fell back. This pattern is very similar to that shown by safety and the explanations are probably similar to those that have been stated for the safety domain. The correlation between the survey mean scores for safety and future security is r = .45 (Table A2.18). The range of scores is 4.6 points between September 2001 (S2: 68.6) and February 2008 (S18.1: 73.2).
Australian Unity Wellbeing Index, Report 18.1, February 2008
14
Section 2 A Comparison Between Survey 18.1 and Survey 1 continued
Dot Point Summary for the Wellbeing of Australians 1. The Personal Wellbeing Index has fallen by a non-significant 0.2 percentage points since October 2007. It remains higher than it was in the first survey in April 2001. 77
>S11 76
75
>S2, S4, S5
Scores above this line are significantly higher than S1
Strength of satisfaction 74
73
Key:
c = Pre-Iraq War d = Hussein Deposed
e = Athens Olympics f = Asian Tsunami
S1 8 O ct S1 20 8. 07 1 Fe b 20 08
20 06
Ap r2 00 7 S1 7
O ct
M ay
20 05 S1 5
S6
Au g
S5
a = September 11 b = Bali Bombing
h 20 06
g
S1 6
f
O ct
e
20 02 M ar 2 0 S7 03 Ju n 20 S8 Au 03 g 20 S9 03 No v S1 20 03 0 Fe b S1 20 1 04 M ay S1 20 2 Au 04 g 20 04 S1 3 M ay 20 05
d
No v
20 02
M ar 20 02
S4
S
S2
1
Survey Date
c
b
S3
Ap r2 00 1
Se pt 20 01
a
S1 4
Major events 72 preceding survey
g = Second Bali Bombing h = New IR Laws
2. Satisfaction with Standard of Living has remained stable over the past 18 months despite a succession of raises in interest rates. 80
>S2, S4,S5,S10,S11 79
78
Strength of satisfaction
77
>S1
76
75
Key:
d
e
f
g
h
20 No 0 2 v 20 S6 0 M ar 2 20 S7 Ju 03 n S8 20 Au 03 g 20 S9 No 0 3 v S1 20 0 Fe 0 3 b S1 20 1 04 M S1 ay 2 2 0 Au 04 g 20 04 S1 3 M ay 20 05 S1 4 O ct 20 05 S1 5 M ay 20 06 S1 6 O ct 20 06 S1 7 Ap r2 00 7 S1 8 S1 Oc t 8. 20 1 Fe 07 b 20 08
c
S5
Au g S4
M ar 20 02
b
S3
Se pt 20 01
a
S2
S
1
Survey Date
Ap r2 00 1
Major events 74 preceding survey
a = September 11 b = Bali Bombing
c = Pre-Iraq War d = Hussein Deposed
Australian Unity Wellbeing Index, Report 18.1, February 2008
e = Athens Olympics f = Asian Tsunami
g = Second Bali Bombing h = New IR Laws
15
Section 2 A Comparison Between Survey 18.1 and Survey 1 continued
3. Satisfaction with Relationships has decreased to its lowest point yet recorded. However, this is not statistically below the level at Survey 1. 82
81
>S2, S3,S4,S5 >S1
80
79 Strength of satisfaction
78
77
76
75
a
Key:
c
e
f
g
h
S4
Au g
20 No 0 2 v 20 S6 0 M ar 2 20 S7 Ju 03 n S8 20 Au 03 g 20 S9 No 0 3 v S1 20 0 Fe 0 3 b S1 20 1 0 M ay 4 S1 20 2 Au 04 g 20 04 S1 3 M ay 20 05 S1 4 O ct 20 05 S1 5 M ay 20 06 S1 6 O ct 20 06 S1 7 Ap r2 00 7 S1 8 S1 Oc t 8. 20 1 Fe 07 b 20 08
d
S5
M ar 20 02
b
S3
S
S2
1
Ap r2 00 1
Survey Date
74
Se pt 20 01
Major events preceding survey
a = September 11 b = Bali Bombing
c = Pre-Iraq War d = Hussein Deposed
e = Athens Olympics f = Asian Tsunami
g = Second Bali Bombing h = New IR Laws
4. Satisfaction with Future Security is at its highest recorded level. 74
73 >S4, S5, S11 72 >S4 Strength of satisfaction
71
>S1 >S2
70
69
68
Key:
d
e
f
g
h
Au g
20 No 0 2 v 20 S6 0 M ar 2 20 S7 Ju 03 n S8 20 Au 03 g 20 S9 No 0 3 v S1 20 0 Fe 0 3 b S1 20 1 0 M ay 4 S1 2 0 2 Au 04 g 20 04 S1 3 M ay 20 05 S1 4 O ct 20 05 S1 5 M ay 20 06 S1 6 O ct 20 06 S1 7 Ap r2 00 7 S1 8 S1 Oc t 8. 20 1 Fe 07 b 20 08
c
S5
S4
S3
Se pt 20 01 S2
Ap r2 00 1 S
1
Survey Date
b M ar 20 02
a
Major events preceding survey
a = September 11 b = Bali Bombing
c = Pre-Iraq War d = Hussein Deposed
Australian Unity Wellbeing Index, Report 18.1, February 2008
e = Athens Olympics f = Asian Tsunami
g = Second Bali Bombing h = New IR Laws
16
3. Household Income We ask: “I will now give you a number of categories for household income. Can you please give me an idea of your household’s total annual income before tax. Please stop me when I say your household income category.” Table 3.1: Income Frequency (Survey 18.1) Cumulative
Less than $15,000 $15,000 to $30,000 $31,000 to $60,000 $61,000 to $100,000 $101,000 to $150,000 $151,000 to $250,000 $251,000 to $500,000 $500,000 or more Total
Cumulative (Survey 7-18) 2495 3714 5700 4192 3148 289 68 26 19,632
Survey 18.1 % of respondents to this question 13.0 19.1 29.1 21.2 16.0 1.2 0.3 0.1 79.6%
N 51 132 226 207 137 68 13 3 837
% of respondents to this question 6.0 15.8 27.0 24.7 16.4 8.1 1.6 0.4 87.7% of respondents answered this question
The data in Table 3.1 are derived from Tables A3.1 and A3.2. The proportions in each income category are all within 1.4 percentage points of survey 18, even though the overall sample size is only half normal. The three categories $151-250K, $250-500K and $500K+ were only introduced in Survey 17. It can be seen that the sample for Survey 18.1 is considerably wealthier than the running average. This trend started being noticeable from Survey 16. The reason for this current change is not known but it should bias the overall Personal Wellbeing Index to be higher than it would have been with a regularly proportioned sample. As background to the data in this chapter, annual gross incomes are currently as follows: Category Age pension Disability support Pension Unemployment
- single - couple - Single 18-25
m> 56-65
81.5 79.4
80.8 77.8
83.7
77.3
77.0
78.8
81.5 80.1
m> 26-35
76.4
76
m> 18-25
74 72
73.4
70 18-25
26-35
36-45
46-55
56-65
66-75
76+
Key: Values above the trend-lines are significantly higher than the designated age groups for males (m) and for females (f). Shaded boxes denote a significant between-group difference.
Figure 4.10: Gender x Age: Relationships (combined surveys)
Even though the gender difference is significant at each age group (minimum N = 1,039), there is also a significant interaction (p = .027). It is apparent that the gender difference in relationship satisfaction diminishes with age.
Australian Unity Wellbeing Index, Report 18.1, February 2008
35
Section 4 Gender continued
4.3.2.3. Safety
82
Males
80.8
79.7
80
Strength 78 of satisfaction 76 (Safety) 74
79.4
79.1
79.1
Females 79.5
78.2
78.7 77.4
77.4
18-25
26-35
77.7
77.9 76.2
76.7
56-65
66-75
72 36-45
46-55
76+
Age
Figure 4.11: Gender x Age: Safety (combined surveys)
There is a significant gender x age interaction (p=.011) reflecting convergence between the genders with increasing age. Gender difference in satisfaction with safety does not occur beyond 66 years (Minimum N=1,042). Across the ages, both genders show their lowest level of safety satisfaction quite late in life, at 56-65 years for females and 66-75 years for males. This trend then reverses, with safety rising for the oldest groups. 4.3.2.4. Community The other gender x age interaction occurs for Community (p=.000) and is shown in Figure 4.12 below (minimum cell size = 1,071). Males
Females 76.8
78 76
f >36-45
74 Strength 72 of satisfaction 70 (Com m unity) 68 66 64
71.6
f >26-35 f >18-25
74.9
73.7 73.3
71.4 71.5
69.2
76.9
69.2
m >46-65 m >18-25
68.0
65.5 64.7
64.7
18-25
26-35
62 36-45
46-55
56-65
66-75
76+
Age
Key: Values above the trend-lines are significantly higher than the designated groups for males (m) and for females (f). Shaded boxes denote a significant between-group difference.
Figure 4.12: Gender x Age: Community Connection (combined surveys)
While both genders show increasing satisfaction with Community Connection as they get older, there is no gender difference within the 18-25y group. Moreover, whereas females show a marked 3.7 point increase in satisfaction from 18-25 to 26-35, males show no change (0.2 points). Over the following decade, however, male satisfaction increases by 3.2 points. In sociobiological terms, it is possible that the 18-35y period covers the ‘breeding years’ during which men are more concerned with providing for their immediate family while females are more concerned with creating mutually supportive ties with other mothers for the purpose of joint child care and
Australian Unity Wellbeing Index, Report 18.1, February 2008
36
Section 4 Gender continued
protection. Thus, the initial rise in satisfaction with Community Connection is delayed in males with respect to females. It could also be tied to an earlier age for marriage by females.
NORMATIVE DATA 4.4. Normative Data Based on Individual Scores 4.4.1.
Personal Wellbeing Index
The normative data for individuals on the Personal Wellbeing Index are presented below derived from the individual values of 14,499 males and 16,114 females (Table A4.14).
Strength of satisfaction PWI
105 100 95 90 85 80 75 70 65 60 55 50 45
100.3
99.1
75.6
74.4
49.8 Male
50.8 Females
Figure 4.13: Gender Normative Data for Individuals: Personal Wellbeing Index
The vertical bars represent two standard deviations around the mean. In contrast with the normative data for household income, the groups that differ have approximately the same degree of difference at the top of their distributions (1.2 points) as at the bottom (1.0 points). This is also reflected in the mean score difference (1.1 points) indicating a symmetrical advantage to females throughout the distributions.
Australian Unity Wellbeing Index, Report 18.1, February 2008
37
Section 4 Gender continued
4.4.2.
Age Norms (individual scores)
These normative data are taken from Table 2 A4.4. 4.4.2.1. Male Norms x Age 110 100 Strength of Satisfaction (PWI)
97.9
98.4
96.6
100.2
98.8
102.4
100.5
90 80
73.9
75.3
73.3
73.5
73.5
76.7
77.6
70 60 50 40
52.9
50.6
50.5
48.6
47.8
50.4
52.9
18-25
26-35
36-45
46-55
56-65
66-75
76+
101.2
101.7
101.8
Age - Males
4.4.2.2. Female Norms x Age 110 100 Strength 90 of 80 Satisfaction 70 (PWI) 60 50 40
74.3
100.9
99.8
98.8
96.9
75.2
77.5
76.0
74.7
74.9
78.8
51.8
51.7
50.1
48.4
50.7
53.3
55.9
18-25
26-35
36-45
46-55
56-65
66-75
76+
Age - Fem ales
Figure 4.14: Gender x Age: Normative Data for Individuals: Personal Wellbeing Index
It is apparent that there is greater gender variation at the bottom of these normative ranges than at the top. The following two figures show this in more detail. Highest Margin of the Norm al Distribution (individual data) Males
104
Females 100.9
102 Strength 100 of satisfaction 98 (PWI) 96
101.2
101.7
102.4 101.8
99.8 97.9 96.9
98.8
100.2 98.4
98.8
36-45
46-55
100.5
96.6
94 18-25
26-35
56-65
66-75
76+
Age
Figure 4.15: Gender x Age: Highest Margins of the Normal Range Calculated from Individuals
Australian Unity Wellbeing Index, Report 18.1, February 2008
38
Section 4 Gender continued
Lowest Margin of the Normal Distribution (individuals)
Strength of satisfaction (PWI)
58 57 56 55 54 53 52 51 50 49 48 47 46
Males
Females 55.9 53.3
51.8
50.6
52.9 51.7
50.7 50.1
50.5
48.4 48.6
18-25
26-35
36-45
50.4
52.9
Threshold for depression risk
47.8 46-55
56-65
66-75
76+
Figure 4.16: Gender x Age: Lowest Extent of the Normative Range Calculated from Individuals
In relation to these two figures the following observations can be made: 1.
The top and bottom of the distributions change with age in quite different ways. The top of the ranges gradually increases with age Figure 4.15. The bottom of the ranges shows a bi-phasic pattern, where the range extends downward to 46-55 years, after which it rises.
2.
The decrease in the bottom of the distribution starts at (36-45y). Two age cohorts of males (3645, 46-55y) lie below the threshold (50%) that signals increased risk of depression, compared with just one age cohort (46-55y) for females.
3.
These patterns are consistent with the mean age-related gender differences shown in Figure 4.6. In general, the top of the female range is higher and the bottom of the female range is higher. This reflects the overall higher Personal Wellbeing Index score for females over the intermediate age ranges.
4.
These distributions also inform the lack of a gender difference in the Personal Wellbeing Index of the youngest group. As can be seen, at the lower range margin there is a consistent advantage to females (Figure 4.16). However, at the top of the ranges, the youngest group shows a marginally higher level for males than for females (Figure 4.13)
5.
The lack of a consistent gender difference across the age groups makes it unlikely that the overall gender differences in the Personal Wellbeing Index represent a more positive female response bias. It also indicates that the drop in the lower range margin of the distribution between 26-55 years is likely to be experientially introduced. It is notable that this range coincides with the child-care years. A future analysis should split this analysis into people living with or without children.
It can be seen that the Personal Wellbeing Index values are more consistently higher for females when comparing the bottoms of the gender-specific normative ranges than the tops. The bottom scores average to a 1.44 point advantage to the females, whereas the top scores advantage females by an average of just 0.90 points. These results are consistent with the idea that the gender difference is not the product of a differential response bias, but rather due to a higher proportion of vulnerable people within the male group. Moreover, it appears this vulnerability exists at all ages except for the youngest 18-25y group.
Australian Unity Wellbeing Index, Report 18.1, February 2008
39
Section 4 Gender continued
4.5. Normative Data based on Survey Mean Scores 4.5.1.
Personal Wellbeing Index and Domains
Survey mean scores (N=18, Table A4.15).
Normative Personal Wellbeing: Index and Domains
87 85 83 81 79 77 75 73 71 69 67
83.6 82.3 80.4
79.8 76.2 74.4
75.6
73.9
72.6
80.6
79.3
77.3
77.9 76.9
76.8
75.9 74.3
75.9
74.5
73.0
74.0
79.1
77.9
76.7 74.7 72.7
77.3
77.6
74.6
75.5
80.6
74.0
75.9
75.4
74.0
72.8
73.9 71.9
68.9
69.9
66.7
65 Female P WI
M ale
Female
Standard o f Living
M ale
Female
Health
M ale
Female
A chievements
M ale
Female
M ale
Relatio nships
Female
Safety
M ale
Female
67.6
67.9
M ale
Female
Co mmunity
Future Security
Figure 4.17: Index and Domains: Normative Personal Wellbeing
The interesting feature of Figure 4.17 is the magnitude of the 2SD range. This indicates the extent of variation over the course of the 18 surveys and, so, shows the relative volatility of the gendered domains to world events. These ranges are presented in Table 4.2 below.
Table 4.1: Range (2SD) of Personal Wellbeing Mean Scores over Surveys, 1-13
Male Female Difference M-F
PWI 3.3 3.6 -0.3
Standard 4.9 4.1 +0.8
Health 3.0 3.1 -0.1
Achieve 4.0 4.0 +0.0
Relations 5.0 6.1 -1.1
Safety 5.7 6.7 -1.0
Community 4.2 4.3 -0.1
Future Security 4.6 6.0 -1.4
In relation to these values and Figure 4.17 the following observations can be made: 1.
The pattern of domain volatility across surveys is similar for males and females.
2.
For both genders, the most volatile domain is safety, with a 2SD range of 5.7 points (males) and 6.7 points (females).
3.
For both genders, most stable domain is ‘health’ (3.0 and 3.1 points).
Australian Unity Wellbeing Index, Report 18.1, February 2008
70.9
70.5
70.8
M ale
73.3
71.0
40
Section 4 Gender continued
4.5.2.
Normative: Gender x Age
87 85
Normative Personal Wellbeing: Index and Domains
83 81 79
77.6
77.4
77 75 73 71 69
82.7
82.6
74.2
77.4
76.1
77.3 75.2 75.3
74.4
73.5
73.1 71.0
75.0
73.5
71.2
71.0
Female
M ale
75.1 73.2
72.7
71.7
71.3
72.6
73.0
Female
M ale
78.9 77.5
76.6
75.9
75.2
74.7
79.4
78.2
77.5
76.7
80.7
73.6
73.8
Female
M ale
77.3
75.0
74.4
72.0
67 65 M ale 18-25
Female 26-35
M ale
Female 36-45
M ale 46-55
56-65
Female 66-75
M ale
Female 76+
Figure 4.18: Normative Gender x Age
These data have been drawn from Tables A4.16 and A4.17. They show that the gender difference in wellbeing only develops after the age bracket of 18-25 years.
Australian Unity Wellbeing Index, Report 18.1, February 2008
41
Section 4 Gender continued
Dot Summary Points for Gender 1. Females generally have higher levels of personal wellbeing than males. However, this is survey-dependent and it is curious that there has been no significant gender difference over the past six surveys.
Personal Wellbeing Index Male
Female
78
77.3
77
76.5
76.1
76.4
76 Strength of satisfaction (PWI)
75
75.2
75.0
76.0 75.3
75.0
75.7
75.0
f2
76.6
75.9
75.3
75.2
74.1
74.7
74 73.6
73.3
73
74.5
74.7
73.6
75.5
74.6
74.3
74.8
74.6
74.5
74.1
f1
75.6
75.7
75.6 75.6
75.7
74.4
74.0
m
73.9
72 71.9 71 S1
S2
S3
S4
S5
S6
S7
S8
S9
S10
S11
S12
S13
S14
S15
S16
S17
S18
S18.1
Apr
Sept
Mar
Aug
Nov
Mar
Jun
Aug
Nov
Feb
May
Aug
May
Oct
May
Oct
Apr
Oct
Feb
01
01
02
02
02
03
03
03
03
04
04
04
05
05
06
06
07
07
08
81.7
81.4
81.5
Survey
Females tend to have higher wellbeing than males
2. The only personal domain to be lower for females is safety. This dropped lower following September 11 for females but not for males. These differences were maintained for about 18 months. Since then the gender differences have been unpredictable but have been significant over the past seven surveys.
Safety Satisfaction 84
Male
83
Female
82 81 80 Strength of satisfaction (Safety)
79 78
78.2
77.7
77.1
74
78.5
78.1
75.0
S1 Apr 01
S2 Sept 01
m2
78.8
79.0
78.6
78.5
79.1
78.2
78.4
78.1
77.9
77.0
76.3
75.2
80.2
80.2
79.9
79.9
77.8
76.2
75.2
75
77.9
80.3
79.6
79.3
78.3
77 76
80.1
79.8
76.9
75.6 73.9
73 72
S3 Mar 02
S4 Aug 02
S5 Nov 02
S6 Mar 03
S7 Jun 03
S8 Sept 03
S9 Nov 03
S10 Feb 04
S11 May 04
S12 Aug 04
S13 May 05
S14 Oct 05
S15 May 06
S16 Oct 06
S17 Apr 07
S18 Oct 07
S18.1 Feb 08
Survey
Males tend to have higher satisfaction with personal safety than females.
3. Relationships shows a significant interaction between gender and survey. It seems possible that the sense of threat over surveys 2-12 increased the level of relationship satisfaction for both genders, but more so for females than males. Since May 2005 the satisfaction level of both genders has returned to their baseline Survey 1 values.
Australian Unity Wellbeing Index, Report 18.1, February 2008
Relationship Satisfaction Male
Female
83
82.1
82 81 Strength 80 of relationship 79 satisfaction 78 77 76
81.1
81.0
80.5
82.5
81.0
80.1
79.9
79.3
78.6 79.1
75.8 S2 Sept 01
76.4 S3 Mar 02
S4 Aug 02
S5 Nov 02
S6 Mar 03
S7 Jun 03
S8 Sept 03
S9 Nov 03
S10 Feb 04
S11 May 04
S12 Aug 04
S13 May 05
78.3 79.0 79.0
77.2
76.7
76.4
79.4
78.3 77.9
77.4
77.1
79.4
79.1
77.9
79.0
77.8
77.3
S1 Apr 01
82.1 81.6
79.1
75
82.9
82.3
80.9
77.6 76.1
S14 Oct 05
S15 May 06
S16 Oct 06
Survey
The gender difference in relationship satisfaction has disappeared.
42
S17 Apr 07
S18 Oct 07
S18.1 Feb 08
f2 m f1
Section 4 Gender continued
4. Gender differences in personal wellbeing only emerge at 26-35 years of age. They then progressively decrease with increasing age. The reason for this is not understood.
Age Differences 3.0 Gender PWI difference (Fem ale m inus m ale)
1.7
2.0
1.4
1.4
1.0
1.2 0.7
0.8
56-65
66-75
0.0 0.0 18-25
26-35
36-45
46-55
76+
Age
There is no gender difference in wellbeing at 18-25 years.
5. The gender difference in satisfaction with relationships is most pronounced in the youngest groups. Males are lower than females.
Gender x Age x Relationship Satisfaction Males 86
Females
f> 56-65
85.8 83.4
84 82 80 Strength of satisfaction (Relationships) 78
f> 18-25
m> 56-65
81.5 80.8
77.8
83.7
77.3
79.4 77.0
78.8
81.5 80.1
m> 26-35
76.4
76
m> 18-25
74 72
73.4
70 18-25
26-35
36-45
46-55
56-65
66-75
76+
Males have particularly low satisfaction with relationships at 18-25 years.
6. Conclusion: There are no obvious gender-related effects of the rate-rises.
Australian Unity Wellbeing Index, Report 18.1, February 2008
43
5. Age 5.1. Distribution Overall The sample is well represented in all age groups (Table A5.1). The minimum number of respondents is in the 76+y group (N=51) and the maximum in the 46-55y group (N=236). 5.2. Age and Wellbeing 5.2.1.
Personal Wellbeing Index Age-specific normative range for group mean scores T
Value for Survey 18.1
X
Age-specific normative mean 76.1
82 80 78 Strength of satisfaction
77.6
74.9
76.9
73.6
76.4
76 74
75.9
74.5
74.3
72.6
72
75.7
76.6 74.8
75.6
74.3
74.0
72.7
72.4
81.7
79.2 78.2
77.4
77.1
75.6
74.9
74.7
73.8
71.8
70 18-25
26-35
36-45
46-55
56-65
66-75
76+
Figure 5.1: Age: Personal Wellbeing Index (Survey 18.1 vs. Normative Data)
All age groups lie within their normal range except for the 36-45y group who lie 0.7 points above their normal range. There is no obvious reason for this and the result probably reflects a random variation. There is no difference across the age groups for these Survey 18.1 values (Table A5.1).
Australian Unity Wellbeing Index, Report 18.1, February 2008
44
Section 5 Age continued
5.2.2.
Age x Surveys
Figure 5.2 shows the changes in Personal Wellbeing Index that have occurred for the youngest and the oldest group (Table A5.2). 18-25y 81 78.9
76+y
80.5
80.4
80.0 78.9
79.4
Values above line >S1
79 79.0 Strength 77 of satisfaction (PWI) 75
76.6
76.4
77.5
76.3
77.1
76.8 74.4
74.0 74.0
73.2
74.9 73.5
74.4
74.1
73.9
76.1
76.4
74.9
73.1
78.3 77.8
75.6
73.2 73
78.3
77.9 78.3
78.2
73.6
73.3
73.0
72.8
71 1
2
September 11
3
4
5
6
7
8
9
10
Pre-Iraq war
11
12
13
14
15
16
17
18
18.1
Olympics Survey
Figure 5.2: Age x Survey (Personal Wellbeing Index)
For the third and consecutive time in seven years, the oldest and the youngest groups are not significantly different from one another, being separated by just 1.2 points. The notable features of this are: 1.
Neither group is significantly higher than they were at Survey 1 (Table A5.2).
2.
The oldest group has shown a decreasing trend over the past nine surveys. The current value of 76.1 points is the lowest since Survey 2.
3.
The youngest group has dropped from its highest level yet recorded at Survey 18.
In historical terms, the data from Survey 1, immediately prior to September 11, showed no age-related differences in personal wellbeing between the youngest and oldest groups (Figure 5.2). In subsequent surveys the three oldest groups showed a progressive increase in personal wellbeing (Table A5.2). In contrast, the youngest group remained remarkably steady prior to Survey 12, with a maximum variation of only 1.9 points. Olympic success at Survey 12 then apparently caused the Personal Wellbeing Index to rise, but this was a very transitory effect which had dissipated by the time of the following Survey 13 (Table A5.2) and the overall ANOVA across the 15 surveys for this youngest group was non-significant at that time. This has now changed and the differences across surveys are significant (Table A5.1). The total range of values for this youngest group is 5.1 points. This range was achieved by the lowest at Survey 16 (72.8) and the highest at Survey 18 (77.1). In contrast, the oldest group (Table A5.2) has changed over a range of 7.4 points (Survey 1: 73.1, Survey 10: 80.54). This rise became significantly different from Survey 1 six months after September 11 (Survey 3: +5.9 points) and rose significantly again to reach its peak value (80.4 points) in the period immediately prior to the Iraq war. This elevation above the first survey continued until Survey 13, in the period following the Olympic games, and now seems to be gradually subsiding. It can be reasonably concluded that the period of elevated SWB for this oldest group, which spanned the period between March 2002 (S3) and August 2004 (S12), is now over. However, it still has quite a way to fall before it returns to the same level as it was in Survey 1. In summary, the 76+ year group has shown a 2.5 year elevation in their subjective wellbeing that seems to have been triggered by September 11, perhaps maintained by a sense of external threat through the Iraq war and terrorist threats, and which is now over.
Australian Unity Wellbeing Index, Report 18.1, February 2008
45
Section 5 Age continued
The scores for the middle-range age groups have shown sporadic changes but, as shown in Table A5.2, only marginally significant changes over time. Any explanations for this pattern must account for the transitory nature of the rise in the oldest groups. Possible contenders are as follows: (a)
The first involves reminiscence regarding the Second World War, the fact of survival, and the mateship of that time.
(b)
The second involves heightened arousal. Both interest and anxiety are stimulated by terrorist atrocities and Australia at war. If the anxiety can be dampened, then positive arousal dominates. Anxiety may be quelled if the Government message, that ‘our side’ is winning the ‘war on terror’, is seen as credible. Moreover, elderly people are generally more receptive to such propaganda. They have a stronger positive regard for Government than younger people (Table A5.1), and fewer elderly people consider the terrorist risk in Australia to be high (Table A5.1). As one consequence, the continued media presentation of overseas terrorist activities may have caused the heightened sense of wellbeing in elderly Australians.
(c)
There is evidence from other research that older people are better at accentuating the positives and ignoring the negatives. However, this explanation does not account for the transitory nature of the rises in wellbeing, and neither does it account for the finding of no age-group differences prior to September 11.
(d)
It is possible that older people, having more established personal and community relationships, can draw on these more effectively during times of threat to buffer the negative impact of world events. It may also be that the sense of threat caused these people, many of whom live alone, to bond and connect more strongly with their peers, and that these enhanced relationships have persisted, maintaining the elevated sense of wellbeing.
This last hypothesis is tested by studying the relative influence of surveys on the domains. The data are the mean domain scores for the 76+ year group from Survey 6, at which point this group’s Personal Wellbeing Index reached its maximum (Figure 5.2) through to Survey 15 (Table A5.2). Thus, each calculation is based on seven domain mean scores. Table 5.1: Mean Domain Score Changes for 76+y (Personal Wellbeing Index) Domain Standard Health Achieve Relations Safety Community Future Security
Values at Survey 1 78.06 66.21 75.73 78.23 71.85 69.92 71.45
Values at Survey 6 84.02 72.42 77.63 86.11 80.01 77.17 79.16
Values at Survey 15 82.25 68.02 72.94 78.13 81.08 75.18 76.98
Survey 6 relative to Survey 1 +6.76 +6.21 +1.90 +7.88 +8.16 +7.25 +7.71
Survey 15 relative To Survey 1 +4.19 +1.81 -2.79 -0.10 +9.23 +5.26 +5.53
It can be seen from these figures that the domains fall into two groups as: 1.
One domain (Achieving in Life) has shown little change. The lower value at Survey 15 may be largely due to the item wording change (see Chapter 2). The fact that the domain of Achieve did not rise with the others adds credibility to the reliability and validity of the changes that have been found. If some generic influence was the cause, such as a change in positive arousal (Hypothesis b), it would be expected that all of the domains would rise. The fact this has not occurred lends credence to the idea that some more specific influence is the engine behind these changes.
2.
The other six domains show highly variable levels in relation to Survey 1.
Australian Unity Wellbeing Index, Report 18.1, February 2008
46
Section 5 Age continued
5.2.2.1. The Oldest Group The two domains of Health and Relationships are illustrated in Figure 5.3.
Health 87.8
87.0
90 85 Strength 80 of satisfaction 75 (PWI) 70 65
87.1
83.8 78.1
86.2
85.0
Relationships 86.6
84.2
87.6
86.0
84.4
86.9
84.0 82.0
83.2
81.3
75.7
75.3 73.2
73.8 70.6
70.2
78.1
78.6 71.4
73.2
71.3
71.0
69.9
66.2
>S1
72.3 71.8
69.5
68.5
68.0
67.1
67.5
60 S1 Apr 01
S2 Sept 01
S3 Mar 02
S4 Aug 02
S5 Nov 02
S6 Mar 03
S7 PostIraq War
S8 Aug 03
S9 Nov 03
S10 Feb 04
S11 May 04
S12 Aug 04
S13 May 05
S14 Oct 05
S15 May 06
S16 Oct 06
S17 Apr 07
S18 Oct 07
S18.1 Feb 08
Figure 5.3: Age x Survey: 76y+, Health and Relationships
Both of these domains have shown substantial change, with a range of 9.5 points for health and 9.7 for relationships. The significant rises in health satisfaction at Survey 6 and Survey 9 are remarkable because, for the population as a whole, this domain has been the most consistent showing no significant change between surveys (Chapter 2). However, over the past 4.0 years it has remained at a level not statistically different from Survey 1. The rise in relationship satisfaction has been more persistent and has remained fairly consistently above Survey 1. Its value in the current survey is no different from Survey 1. It is not at all clear why only the most elderly group is affected in this way. This is discussed in depth in Report 15.0.
Australian Unity Wellbeing Index, Report 18.1, February 2008
>S1
47
Section 5 Age continued
5.2.3.
Personal Wellbeing Domains
Most of the domains show the same pattern of no age-related changes as shown in Figure 5.1 (Table A5.1). The data for Health satisfaction in Survey 18.1 are shown below in relation to age-normative data for groups (Table A5.30). Age-specific normative range for group mean scores 82
78.4
82.0
76.6
80 78.6
78
76.4
77.6 75.1
75.3
74
Value for Survey 18.1
X
Age-specific normative mean
78.4 76.5
76 Strength of satisfaction w ith health
80.1
T
74.0
74.8 75.6 74.0
74.6
76.0
75.7
73.4
72
75.9
67.5 76.5
72.6
72.3 71.2
70.7
70
69.3
68 66
66.0
64 62 60 58 18-25
26-35
36-45
46-55
56-65
66-75
76+
Figure 5.4: Age: Satisfaction with Health (Survey 18.1)
In terms of normative data, the cell size is N=18 (Table A5.14). The following can be noted: (a)
Health satisfaction is within the normal range for all age groups.
(b)
Health satisfaction of the oldest group is 3.7 points below its normative mean score.
Australian Unity Wellbeing Index, Report 18.1, February 2008
48
Section 5 Age continued
The results in relation to normative Relationships (Table A5.33) are as follows: Age-specific normative range for group mean scores
92
82.0 89.7
90
T
Value for Survey 18.1
88
X
Age-specific normative mean
81.4
86 84
79.4
77.4
82.7
82 Strength of satisfaction
80
71.5
78.8
78
79.4
76
76.0
75.4
78.1
80.6
73.8
80.7
80.8
77.8
78.1
79.9
79.6
74.9
74 72
84.8 82.5
78.3 76.0
85.3
83.5
72.1
70 68 66 64 18-25
26-35
36-45
46-55
56-65
66-75
76+
Figure 5.5: Age: Satisfaction with Relationships (Survey 18.1)
In Survey 18.1, all values are below their normative mean score and two age groups (18-25 and 3645y) lie below their normative range.
Age-specific normative range for group mean scores
86
81.0
84
T
Value for Survey 18.1
X
Age-specific normative mean 80.2 84.3
84.4 79.8 82.3
82 80
79.4
80.2
81.5
82.0
81.2
78.5
78.4
79.3
78.4
78
81.0
78.1
80.6 78.8
77.3 77.3
Strength 76 of satisfaction 74
75.6
74.8
74.7
74.3
74.1
73.6
73.3
72 70 68 66 64 18-25
26-35
36-45
46-55
56-65
66-75
76+
Figure 5.6: Age: Satisfaction with Safety (Survey 18.1)
In Survey 18, all values are within their normal ranges.
Australian Unity Wellbeing Index, Report 18.1, February 2008
49
Section 5 Age continued
The results in relation to Community Connection (Table A5.35) are shown below: Age-specific normative range for group mean scores
82 80
T
Value for Survey 18.1
78
X
Age-specific normative mean
72.2 80.7 74.0
76 74 Strength of satisfaction
73.0
73.4
69.7
70
66.1 68.4
68
76.0 74.5
75.2
71.4 72.4
72
78.7
72.6
72.5
71.7
69.5
71.3
70.7
70.3 69.8 68.0
67.3
67.2 66 64.5
65.0
64 62
61.5
60 18-25
26-35
36-45
46-55
56-65
66-75
76+
Figure 5.7: Age: Satisfaction with Community Connection (Survey 18.1)
Two age groups (18-25 and 36-45y) lie above their normative range. 5.2.4.
Life as a Whole
This increases with age in much the same pattern as for the Personal Wellbeing Index in Figure 5.1. 5.3. Normative Data Generated from Individual Scores Table A5.20 has been constructed by averaging the Personal Wellbeing Index values of all individuals who fall within each age-range across all surveys. The minimum N=2,173 (76+ year group). These results are shown in Figure 5.8. 110 100 Strength of satisfaction (PWI)
97.4
97.8
99.2
100.0
100.7
101.1
102.1
51.2
51.1
49.4
48.1
50.6
53.1
54.5
18-25
26-35
36-45
46-55
56-65
66-75
76+
90 80 70 60 50 40
Years
Figure 5.8: Normative Range for Each Age Group Derived from the Scores of Individuals (Personal Wellbeing Index)
There are three interesting features of these data as follows: (a)
They are very regular in two respects. First the range of two standard deviations for the entire database (N=33,576) conforms almost precisely with the theoretical normal range of 50-100 points. The top of the empirical range (Table A5.21) averages 99.8 points and the bottom averages 50.3 points. Second, the differences between the ranges of the seven age groupings is
Australian Unity Wellbeing Index, Report 18.1, February 2008
50
Section 5 Age continued
just 5.7 points (from 46.3 : 18-25y to 51.9 : 46-55y). The correlation between the mean and standard deviation across the seven age groups is .198 (NS). (b)
The base of the ranges show a dip in the 36-55y age groups. This indicates a downward extension of the Personal Wellbeing Index and indicates a higher than usual (compared with the other age groups) proportion of the sample experiencing homeostatic failure (individual values S1
79 79.0 Strength 77 of satisfaction (PWI) 75
76.6
76.4
78.3
77.9 78.3
78.2 77.5
77.1
76.8
75.6
76.4
74.9
73.2
74.4
74.0
73.2
73.1
76.1 74.9
73.5
74.4
74.1
73.9
78.3 77.8
76.3
74.0 73
76+y
80.5
80.4
73.6
73.3
73.0
72.8
71 1
2
3
September 11
4
5
6
7
8
9
10
Pre-Iraq war
11
12
13
14
15
16
17
18
Olympics Survey
After having risen, all age groups are now returned to be no different from Survey 1.
3. Conclusion: There is no obvious effect of the rate-rises on the age-related data.
Australian Unity Wellbeing Index, Report 18.1, February 2008
54
18.1
6. Money Matters 6.1. Shares We asked: “Does anyone in your household currently own any shares in the stock market (except from superannuation)?” 80 77.4
78
76.4
76 PWI
74.4
Normal range 74
73.4
72 70 Yes
No
Figure 6.1: Own Shares x Personal Wellbeing Index
Not surprisingly, people who own shares (41% of the sample) have higher wellbeing than those who do not (Table A6.1). These people are predominantly male (Table A6.2), aged 36-75 years (Table A6.3), and with higher income (Table A6.4). 6.2. Cost of Living We asked: “How worried are you about the cost of living?” 84
82.7
82
79.9
80
79.3
78
75.9
76 PWI
77.4
76.4 74.2
Normal range
74
73.5
74.8
76.4 73.4
72
70.3
70 68 66 64 N
42
41
47
56
193
106
150
162
62
92
0/1
2
3
4
5
6
7
8
9
10
Level of w orry
Figure 6.2: Worry about cost of living x Personal Wellbeing Index
These data come from Table A6.5. It is apparent that worry about the cost of living is not a major issue for most people. Only those 9.2% whose level of worry is 10/10 have a Personal Wellbeing Index that is reliably below the normal range.
Australian Unity Wellbeing Index, Report 18.1, February 2008
55
Section 6 Money Matters continued
This same pattern is pretty much repeated for each of the Personal Wellbeing Index domains (Tables A6.6 to A6.12) with two exceptions. Neither Health (Table A6.7) nor Relationships (A6.9) show a significant downward trend. It seems that both of these domains are predominantly influeced by other concerns. 6.3. Interest Rates We asked: “How worried are you about interest rises?” 80
79.0
78
77.1
76.8 76.0
76 Normal range
PWI
75.2
74.8
73.7
74
74.1
74.8
76.4 74.3 73.4
72 70 N
115
58
49
47
153
82
126
133
69
119
0/1
2
3
4
5
6
7
8
9
10
Level of w orry
Figure 6.3: Worry at interest rates x Personal Wellbeing Index
The data for Figure 6.3 come from Table A6.13. This figure is interesting in two respects. First it shows that worry about interest rates has no impact on wellbeing. The slight downward trend is nonsignificant and all values remain in the normal range. Second, it is most interesting to discover a potential source of ‘worry’ that has no reliable link with the Personal Wellbeing Index even when the level of worry is rated as 10/10. This means that the 11.9% of the sample who registered this extreme level of worry are not simply an extremely anxious or depressed sub-set of the sample with low wellbeing due to their general psychological state. If this was the case their group mean would lie below the normal range. Instead, this appears to be a group who are able to register a level of extreme concern with the knowledge that interest rates are climbing, but this concern is not personalised, so it does not affect their personal wellbeing. This is an excellent validation for the sources of worry that are associated with low wellbeing. Where this is found, the low wellbeing can be reasonably attributed to the influence of the specific source of the worry. As might be expected, this pattern does not differ for gender (Table A6.14) or age (Table A6.15). One further observation relates to the nature of the question and the proportion of the sample endorsing an extreme level of worry. A crucial aspect of the question is that it concerns something that is not under personal control and is highly distal in relation to the self. The rate rises are controlled by the Reserve Bank and there is nothing an individual can do to control the Bank’s decisions on this matter. They can, however, take control of their own lives in the face of such rises. This may involve primary control through reduced discretionary spending and secondary control through such ideas as the rises will soon cease, their wages are rising, and so these difficult times are transitory. Of course, both forms of control have a limited capacity and at some level of difficulty, they will fail to maintain
Australian Unity Wellbeing Index, Report 18.1, February 2008
56
Section 6 Money Matters continued
wellbeing, and the Personal Wellbeing Index will fall. However, for the majority of the sample this level of difficulty has not yet been reached. 6.4. Investments We asked: “How worried are you about your investments?” Table A6.16 shows much the same pattern as Figure 6.2, with only the 4.8% of the sample who rate their level of worry as 10/10 showing wellbeing below the normal range (72.6 points). There is no interaction of worry about investments with gender (Table A6.17) or with age (Table A6.18.), or with owning shares (Table A6.19). 6.5. Summary The current series of rate increases has had little effect on the wellbeing of the Australian population. To some extent this shows people’s capacity to absorb such increases into their lives without distress. It also reflects the gradual nature of these rises such that people have time to adapt. This latter point has policy implications for governance. A series of small rate rises is likely to be better tolerated by the population than a single large rise.
Australian Unity Wellbeing Index, Report 18.1, February 2008
57
Section 6 Money Matters continued
Dot Summary Points for Money Matters 1. Shares: People who own shares have higher wellbeing because they tend to be wealthy.
80 77.4
78
76.4
76 PWI
74.4
Normal range 74
73.4
72 70 Yes
2. Cost of living: Only the 9.2% of the sample whose worry level about the cost of living is 10/0 have lower wellbeing.
84
82.7
82
79.9
80
79.3
78
75.9
76 PWI
No
77.4
76.4 74.2
Normal range
74
74.8
73.5
76.4 73.4
72
70.3
70 68 66 64 N
42
41
47
56
193
106
150
162
62
92
0/1
2
3
4
5
6
7
8
9
10
Level of w orry
80
3. Rate rises: No level of worry about rate rises is linked to low wellbeing.
79.0
78
77.1
76.8 76.0
76 PWI
Normal range
75.2
74.8
73.7
74
74.8
74.1
76.4 74.3 73.4
72 70 N
115
58
49
47
0/1
2
3
4
153
82
126
133
69
119
5
6
7
8
9
10
Level of w orry
4. Conclusion: The current series of rate increases has had little effect on the wellbeing of the Australian population. To some extent this shows people’s capacity to absorb such increases into their lives without distress. It also reflects the gradual nature of these rises such that people have time to adapt. This latter point has policy implications for governance. A series of small rate rises is likely to be better tolerated by the population than a single large rise.
Australian Unity Wellbeing Index, Report 18.1, February 2008
58
Appendix A1 A1.1 References to the Text Cummins, R.A., Gullone, E. & Lau, A. L. D. (2002). A model of subjective well being homeostasis: The role of personality . In: E. Gullone & R.A. Cummins (Eds.). The universality of subjective wellbeing indicators: Social Indicators Research Series, (pp. 7-46), Dordrecht: Kluwer. Cummins, R.A., Eckersley, R. Pallant, J. Van Vugt, J, & Misajon, R. (2003a). The development of a national index of subjective wellbeing: The Australian Unity Wellbeing Index. Social Indicators Research, 64, 159-190 Cummins, R.A., Eckersley, R., Lo, S.K., Okerstrom, E., Hunter, B., & Davern, M. (2003b). Australian Unity Wellbeing Index: Cumulative Psychometric Record. Melbourne: Australian Centre on Quality of Life, School of Psychology, Deakin University. http://acqol.deakin.edu.au/index_wellbeing/index.htm Cummins, R.A., Davern, M., Hunter, B., Eckersley, R. & Lo, S.K. (2004). Subjective Wellbeing in Australia following September 11: The Effects of Age (in preparation). Renner, R. (2003). Nietzsche’s toxicology: whatever doesn’t kill you might make you stronger. Scientific American, 289(3), 15-17.
Australian Unity Wellbeing Index, Report 18.1, February 2008
59