Aug 3, 1988 - Authentication Scheme Using Walsh Encoding of. Random Patterns. RICHARD KRUKAR, NASIR AHMED, FELLOW, IEEE, AND DAECHUL ...
407
IEEE TRANSACTIONS ON ELECTROMAGNETIC COMPATIBILITY, VOL. 30, NO. 3, AUGUST 1988
Authentication Scheme Using Walsh Encoding of Random Patterns RICHARD KRUKAR, NASIR AHMED, FELLOW, IEEE,AND DAECHUL PARK
Abstract-A scheme is developed to help prevent the use of new generations of copying equipment to forge products. Computer images of three-dimensional reflective particle labels are encoded using the WalshHadamard transform. An optimal quantizer and the encodings are then used to authenticate the labels. Key Words-Authentication scheme, random patterns, Walsh encoding, 3-D images. Index Code--P’ld/f, H99K.
I. INTRODUCTION
N THE PAST, authentication schemes have been developed
I
to detect when an item has been tampered with, or is a forgery. The more advanced schemes use a label that is altered or destroyed by tampering and is very difficult to duplicate. The new generation of duplicating equipment has brought with it the ability to flawlessly duplicate such labels, and leave the door open to tampering and forgery. Hence the need for new authentication schemes that are impervious to new duplicating equipment. The purpose of this paper is to introduce one such scheme that employs random three-dimensional labels. The major limitation of copying machines is that they can only reproduce two-dimensional images. An obvious countermeasure is to use three-dimensional labels, which look different from different viewing angles. Examples of threedimensional labels are the holograms that appear on many credit cards. A three-dimensional label can be authenticated via two two-dimensional images obtained from different viewing angles. The nature of the label forces any duplication to be three-dimensional, and hence counters the low-level threat introduced by new copy machines. Credit card holograms cannot be duplicated on copy machines, but they are deterministic, in that they can be duplicated by the machine that produced them. If a label can be duplicated, it can be forged. As such, holograms have already been forged. Two-dimensional labels can be copied, and deterministic three-dimensional labels can be manufactured by a forger. Thus, we consider random three-dimensional labels that do not suffer from either shortcoming. With random three-dimensional labels, verification is the process of making sure that the label on the product matches the label that ought to be there. The information on what label should be on the product can be stored either in a large Manuscript received April 17, 1987; revised January 6 , 1988. This work was supported in part by Sandia National Laboratory, Albuquerque, NM 87185. The authors are with the Electrical and Computer Engineering Department, University of New Mexico, Albuquerque, NM 87131. IEEE Log Number 8822302.
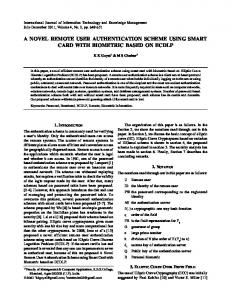
database or imprinted on the product. In either case, the information must be encoded using some one-way encoding scheme such as public key encryption [ 5 ] . Public key encryption allows a manufacturer to be the sole producer of labels, but anyone could do the verification. In order for a forger to make verifiable labels, the encryption code would have to be broken. This paper introduces an authentication scheme using labels containing randomly distributed reflective particles. Approximately 500 bits of information about the label are used by the scheme. The problem then is to characterize a label in 500 bits in such a manner that the characterization is almost unique. The scheme developed uses two one-dimensional patterns. Each pattern is obtained by thresholding a picture of a label and then integrating in one direction. The acquisition of a pattern from a label for some given positions of the light sources and camera is called a reading, as depicted in Fig. 1. Two different patterns can be read from a label by changing the geometry of the light source and camera. Each pattern is encoded by taking its Walsh-Hadamard transform [ 11, retaining the dominant transform coefficients and then quantizing them [4].By choosing the proper number of coefficients and bits of quantization, an encoded pattern is obtained. The encoded patterns must specify which coefficients were retained as well as the quantized coefficients themselves. Each encoded pattern is assigned approximately 250 bits. Authentication of a label entails reconstructing the original patterns from the encoded patterns. These reconstructions are called the representativepatterns. Two new patterns are read from the label, care being taken to duplicate the geometry of the original readings. Measures of how close the new patterns are to the representative patterns are the Euclidean distances between them. The Euclidean distances are combined into a vector. Then pattern recognition techniques are used to determine if the new readings were taken from the same label that the representative patterns came from. Authentication is achieved if this is the case. 11. THETESTAPPARATUS The test apparatus shown in Fig. 2 consists of an optic bench with a charge injection device (CID) camera and a target solidly mounted on it. In addition to the camera and target, there is a light source that is free to rotate around the target. The camera views the target, which is illuminated from a known position by the light source. The camera generates a video signal that is fed to Monitor 1, as depicted in Fig. 3. This step helps to ensure that the camera is working, and set up
OO18-9375/88/0800-0407$01.OO 0 1988 IEEE
408
IEEE TRANSACT'IONS ON ELECTROMAGNETIC COMPATIBILITY, VOL 30, NO. 3, AUGUST 1988
Fig. 1 .
Geometry of the reading apparatus.
Fig. 2. The test apparatus, with the camera, the light source, and the label in place. All four pieces of equipment are on an optic bench. The light source is mounted on an arm and is free to rotate around the label.
properly, in addition to amplifying the video signal power. From Monitor 1 the amplified signal is received by an Imaging Technologies AP-5 12 analog processor board mounted in a Sun 2/170 micro-computer. The AP-512 first digitizes the input signal and makes the digitized signal available to an Imaging Technologies FB-5 12 frame buffer board mounted in the same computer. The AP-512 also converts the digitized signal back into an analog video output signal. The AP-512 video output is fed into a graphics monitor where one can view the information the computer receives. By issuing the proper command, the digitized signal can be loaded into the FB-512 where it becomes a 512 x 512 pixel image with 256 gray levels per pixel. With the present camera settings, the label occupies an area slightly larger than 256 x 256 pixels. The present algorithms work on 128 x 128 pixel images, so four distinct 128 x 128 images can be read by the computer from the frame buffer. P ( m , n), 0 I m , n 5 127, is used to represent a 128 x 128 camera image. Once a camera image is read from the frame buffer into the computer, it is ready for further processing. The light source swings on a rigid arm and is limited to one plane of motion. Using the spherical coordinate system, this plane has been defined as the plane in which the light source azimuth angle O/ equals zero. The light source elevation angle & ranges from 12 degrees to over 90 degrees. Near 12 degrees, depending on the camera and lens being used, the light source collides with the camera stand or lens. When $1 is much over 50 degrees, P ( m , n ) contains very little information. Therefore, the physical constraints on the equipment are 8, = 0 and 12 I & 5 50. It has been found that all the parameters of the test apparatus can be expressed in terms of 0, and 4/, and are often more useful that way. The radius from the light source to the target is not a crucial parameter. 111. REFLECTIVE LABELS
----I
I
I
'
Monitor 1
Sun21170
I Mi-Computer
AP-512
I
The specific labels experimented with were made by mixing small metallic particles in plastic resin and then hardening a layer of the mixture over a flat black background. A certain amount of experimentation was necessary before labels of acceptable quality were produced. The best results so far use extemely small particles and a fast curing resin. The labels were read by placing them on the target in the test apparatus. The position of the light source is described by the vector 1 where
ANALOG PROCESSOR
II
I = [si@/ cos 81, sin 4/ sin O,, cos $/] T. FB-512 FRAME BUFFER
I
I
The vector 1 points from the origin toward the light source. The camera takes a picture P,(m, n ) , 0 I m , n 5 127, with the light source positioned at I = f,. Recalling that 0 5 P ( m , n) I 255 over the entire range of m and n , P ( m , n ) is read from the frame buffer into the computer where it undergoes a thresholding operation defined as
Disk or Tape Mass Storage
L _ _ _ _ _ _ _ J Fig. 3 .
Data acquisition flowgraph.
(1)
I(m, n)=
0 OsP(m, n) 2/3/-, p does not of (sin& cos 0,) and cos 4, are saved. The latter two numbers change in a large or predictable manner; the images no longer are used instead of just $, and 0, because considerable correlate. computer time is saved when (7) is being evaluated frequently. Acquiring the amount of data necessary for algorithm If the second term of the inner product in (6), development proved to be impossible due to limits on the (sin$, sin O,)sin$/ sin 01, had not dropped out, it would have number of labels available and the throughput of the equip- been better to store it rather than compute it every time. ment. The solution was to create a model for the labels, and A label model is a set of N reflective particle models. To then to simulate labels as needed. The real data taken was used simulate a label, the total number of particles that will appear to develop, adjust, and verify the model. must be determined. Presently, N is being taken from a normal distribution with mean 300 and variance 100, or N is IV. SIMULATING LABELS n(300, 100). Having determined how many particles thcre The label model was developed from observations of real will be, each particle is simulated as described above. A label can be read by specifying the light source elevation labels in the test apparatus. The physical constraints and
410
IEEE TRANSACTIONS ON ELECTROMAGNETIC COMPATIBILITY. VOL. 30. N O . 3 . AUGUST 1988
angle and an image I ( m , n) = 0 for 0 5 m , n 5 127. For N , evaluating (7) indicates if each particle pi,i = 1, 2, particle i is on. If the particle is on, then I ( m i ,ni) is set to 1, where m, and n,are the x - y coordinates of the ithparticle. If the particle is not on, nothing is done. After all N particles have been checked, the image is ready for processing by any authentication or encoding scheme. An example of such an image is shown in Fig. 5. The first step in the encoding and verification algorithms being examined is to condense the 128 x 128 image I ( m , n) to a 128-point data vector x(m) as a ,
127
I ( m , n)
x(m)=
(8)
fl=O
where x(m) is called the pattern; see Fig. 6(a). A time-saving step when working with simulated labels is to start with x(m) instead of I ( m , n). If the ithparticle is on, then x(mi)is incremented. The resulting data vectors are the same. The savings in both time and memory allow more data to be generated and evaluated than would otherwise be possible. V. THEWALSHHADAMARD TRANSFORM
1
N-l
X(m)(-l)(m,u),
u = o , 1,
N-1
*.-,
(9)
Nm=O
I
I
0
PICTURE
I
where the binary form of an integer r , with 0 5 r
r = r,- 2"-'
+ r f l - 2 2 n - 2+ , .
e ,
I
(d)
Fig. 5. Data acquired through simulations. A label was simulated and then read from 30" to 31.5" degrees in 0.5" increment,. The correlation between an image and Image, is givcn. (a) Image I , , 4 = 30.0", p , I = 1 .O. (b) Imaee I,. _ ,6. = 30.5".. ,D , , = 0.6957. ( c ) Image I , , d = 31.0". P , I = 0.5600. (d) Image I,, q5 = 3 1 . 5 " , p 1 4 = 0.3846. _
The Walsh Hadamard Transform (WHT) is an orthogonal transform that is defined by [ l ]
b,(u)=-
(C)
25
N - 1, is
+ r121+ r,
Place Dominant WHT Coefficients
Threshold
128x1 vector
(1 1)
u and m are integers and n is the bitwise AND operator. The value of ( m , u) is simply the number of "ones" in the result of ANDing together the binary representations of m and u . Similarly, the inverse WHT (IWHT) corresponding to (9) is defined as
REPRESENTATIVE PATrERN
Summation 128x1 vector
PATrERN
Choose Dominant Components Quantize approx 250 bits
ENCODED PATTERN
u=o
Fast WHT (FWHT) and IWHT (FIWHT) algorithms [2] are used to obtain sequency information about the data vectors. The FWHT algorithm has a Cooley-Tukey type signal flow graph and is essentially the same as a fast Fourier transform (FFT) that requires no reorderings or multiplications. The FIWHT is the same as the FWHT, except that the result is not scaled by 1 / N . The speed and simplicity of the FWHT make it ideal for this application. VI. CHARACTERIZING LABELS AND FINDING DISTANCES To characterize a label, two uncorrelated readings are taken from it. To simulate these readings, two label simulations are used assuming that the two readings correspond to different
ENCODED PATTERN 1
I ENCODED PATTERN
2 approx 500 bits
LABEL CHARACTERIZATION
(c)
Fig. 6 . An illustration of the steps involved in obtaining: (a) an encoded pattern from a camera picture; (b) a representative pattern from an encoded pattern; (c) an interpretation of a label characterization as simply two encoded patterns set side by side.
azimuth angles. Whichever method is used, two uncorrelated patterns are acquired. These patterns are separately encoded. To encode a pattern, first the dominant 18 of the 128 WHT coefficients are found. These coefficients are thcn quantized to 7 bits using Max quantizer tables [4]. The 7-bit quantizations plus the 7 bits needed to specify each coefficient imply that 14
41 1
KRUKAR et a/.: AUTHENTICATION SCHEME USING WALSH ENCODING
bits are needed per transform component. However, the first coefficient is always used, so 7 bits of position information are saved. The result is that there are 17.14 7 = 245 bits of information per pattern. These 245 bits are called the encoded pattern. Two encoded patterns, or 490 bits, specify a label characterization, as seen in Fig. 6(c). A representative pattern is found by decoding an encoded pattern, as depicted in Fig. 6(b). By taking a 128-point zero vector and reading the 18 transform coefficients from the encoded pattern into it, being careful to put them in the right position, the WHT of the representative pattern is found. The IWHT reveals the representative pattern. Decoding a label characterization gives two representative patterns, rl and r2. Along with decoding a label's characterization, two new and x2 must be read from the label. Care must be patterns taken to ensure that the light positions are the same for the new readings as for the original ones. x1and x2 are readily available during simulation, as are bad readings if they are desired. With two representative patterns and two patterns in hand, four useful Euclidean distance measures are available. They are d l l , d12, d z l , and d22defined as
+
d,, = (r,- x,) T ( r ,- x,) = II r, - XJ I/ 2 .
Recalling that the Mahalinobis distance between z and Z is defined as (z - Z ) T V - l ( z - t),we define c, the square error, as
c = ( z - t) v- ' ( z - 2 ) .
For constant c , (15j is an ellipsoid in n-dimensional space. A surface of equal square error is ellipsoid in shape and would make an acceptable decision boundary. Pfo would be determined by the volume probability outside the ellipsoid. On inspection it is clear that (15) and the quadratic form in the argument of (14) are similar. Define the random variable
c=( z - Z ) 7- v- I (2 - 2).
1
F(w)=
( 2 7 pIvI
-
5 , I-, ... iym[-jw(z-Z)~V-~(z--t) c
a
THE
DECISION RULE
A decision rule dependent on z must now be produced. There are two possible sources of z . The first source m l is when there is no forgery and the label characterization and the label match. The second source m2 is when the label and label characterization do not match and there is a forgery. This appears at first to be a two class decision theory problem, but it is not. Through simulation, the statistics of m , can be investigated. Also, various forgery attempts can be simulated and investigated. The problem is that no statistic concerning m2can be trusted. There is no way to predict what will be done to fool any authentication attempt. A decision rule dependent only on m l is needed. The one-class nature of the problem forces the realization that only the probability of deciding a good label is a forgery, known as the probability of false alarm P f o ,can be analyzed. The probability that a forgery gets past the verifier, known as the probability of missed detection Pmd, cannot be found. After designing a decision rule with a known P,,, simulations can be run to find the Pmdfor certain forgery attempts. Assuming that the measurement z , z = [ T I , 22, . . . , z n l ' , follows a multivariate normal distribution. defined as 1 p z ( z )= (24n/2 1 T/1 I / 2 exp
where Z is the mean of covariance matrix.
z,
[
-
(z-
( z - Z)
1
(14)
and V - ' is the inverse of the
m
exp
v- (z - 2)
- ( z - t)
2 -
1
m
(2a)n/2\ VI
[
. exp VII. DECISIONS AND
(16)
Knowing that z is from a multivariate normal distribution, the Fourier transform of the probability density function of C is
(13)
Recall that the patterns are 128-point data vectors. The distances are combined into the measurement z = [ d l l , d12, d21, d22] .' Authentication of the label is dependent on the measurement z .
(15)
dzl
-
d.22
112
1
dzl
dz2
. . . dzn
m
5 , 5 , . ST,
(2 -t)TV-
l(z- t ) ( l + 2jw) 2
. . . dZn.
1 (18)
Multiplying and dividing the leading constant by (1 yields
F ( o )=
(17)
+ 2jw)""
1 (1 + 2 j ~ ) " / ~
. exp *
dzl
[
( z - Z) V - ' ( z - Z)( 1 + 2jw)
-
dz2
2 -
-
a
dz,,) .
1 (19)
The quantity inside the braces is a multivariate normal probability density function integrated over its entire range, which evaluates to 1 by definition. So
F ( o )=
1 (1 + 2 j ~ ) " ' ~
which is the Fourier transform of a x: density function [3], c, as defined in (16), is xs. By choosing an ellipsoid as a decision boundary the decision ' ( z - Z) > c. rule, as shown in Fig. 7, becomes ( z This condition implies that z came from a forgery, otherwise it
412
IEEE TRANSACT11DNS ON ELECTROMAGNETIC COMPATIBILITY, VOL. 30, NO. 3, AUGUST 1988
be addressed during further development of the authentication scheme.
C c), where C is defined in (16). The answer to this problem has already been solved, Pfu = Q(c1n).By the proper choice of c , any Pro desired can be achieved. However, for any choice of Pf,, there will be an unknown P,nd, which can only be found by simulating forgery attempts and testing the decision rule with them. VIII. EXPERIMENTAL RESULTS The authenticator has a desired performance of Pfo = and Pmd = The decision rule for PfU= lo-’ is found as
‘Y -
(Z - t)
I
(z - Z ) > Q( 10
14) = 18.476.
(2 1)
IX. ADDITIONAL CONSIDERATIONS There are two important considerations to be examined before judging the merits of the proposed authentication scheme. These considerations are sensitivity to noise and comparison with other transforms. Simulations similar to those discussed above have been run using discrete Fourier transform (DFT) and discrete cosine transform (DCT) encodings. Both the DCT and DFT gave no false alarms in the entire 100 000 point sample compared to three false alarms with the WHT. However, the DCT gave five false alarms versus the DFT with two false alarms. The performances of the DFT and DCT are both better than that of the WHT, but at the cost of more complex and time consuming algorithms to compute the transforms. As a test of noise immunity, a series of simulations were run under the assumption that particles would be occluded or lost from the original label. Intraclass distances d l l or d22 were found where between 2 and 40 percent of the particles in the original label were removed. Examining 7700 point samples led us to assert that over 10 percent of the particles could be lost without causing the scheme to yield a Pfu > 10. This assertion has not yet been verified, nor have simulations been run where the sensitivity to the reading angle has been evaluated. Future research must evaluate the effects of these noise sources.
’.
X. CONCLUSIONS This investigation demonstrates that the process of authentication using three-dimensional patterns is extremely promising. Computer simulation results suggest that probabilities of missed detection and false alarm of the order of are achievable, which may be acceptable for a variety of applications. Future work will involve testing the overall scheme with extensive experimental data. The experimental data will also be used to improve the model, and find better ways to create and read the labels themselves.
implied that the data sets would need to have Pmd = on the order of lo5 points. Using simulations, four uncorrelated sets of 100 000 patterns were created. Readings from class m l were generated by taking the patterns x1and x2from Sets 1 and 2 , respectively. Representatives rl and r2 were obtained from the patterns and then measurements zm1 = [ d 1~, d12, 4 1 , ACKNOWLEDGMENT d22],were generated using (13). Using 20 000 of the measureThe authors thank D. Bauder, P. Stokes, and K. Tolk of ments, Z = E [ z ]and Y-’ = [ E [ ( z - Z)(z - Z)?]-’ were Sandia National Laboratories, Albuquerque, N M , for their calculated, where E represents the expected value operator. help in carrying out this research work. Having calculated Z and V - l , the rule is fully defined. A set of forgery data was calculated by using the representatives as REFERENCES acquired above and patterns x3and x4taken from pattern Sets 3 and 4, respectively. The forgery data set was calculated using [ l ] N. Ahmed and K. R. Rao, Orthogonal Transforms f o r Digital Signal Processing. Berlin: Springer-Verlag, 1975. zrn2 = [&I, 4 2 , d41, &]. Using all 100 000 measurements of [2] R. M . Bates, “The multi-dimensional bifore transfomm,” Ph.D. dissertation, Elect. Eng. Dept., Kansas State Univ., Manhattan. KS. zml to calculate Pf, yielded Pfu = 3 x Using the 1976. forgery data set gave the result that P,nd = 4 X w5. [3] R. T. Hogg and A. T. Craig, Introduciion Io Mathematical The results reported above meet the design goals. However, Statistics. New York: Macmillan, 1978. the forgery attempt simulated is the crudest possible, and the [4] J. Max, “Quantizing for minimum distortion.” IRE Trans. Inform. Theory, vol. IT-6, pp. 7-12, Mar. 1960. label characterization was used to authenticate a totally wrong (51 R. L. Rivest, A. Shamir, and L. Adleman, “A method for obtaining label. Another point is that faulty reading equipment and digital signatures and public-key cryptosystems.” Communicalions of the ACM, vol. 21. no. 2. pp. 120-126, Feb. 1978. damaged labels have not been examined. These concerns will