Automated amorphous phase detection through template matching M Véron and EF Rauch SIMAP laboratory, CNRS-Grenoble INP, BP 46 101 rue de la Physique, 38402 Saint Martin d’Hères, France
Email:
[email protected],
[email protected] Keywords: electron crystallography, TEM phase mapping, amorphous material
A TEM attachment using an automated crystal orientation mapping method (ACOM/TEM) has been developed the last few years [1-3]. This technique is complimentary to the electron backscatter diffraction (EBSD) technique (also known as orientation imaging microscopy or the back-scatter Kikuchi diffraction method) in scanning electron microscopy (SEM). While the EBSD technique is limited by the size of the poly-crystalline grains (its spatial resolution is limited to 20 to 80 nm) and is sensitive to the plastic deformation, damage or contamination of the crystal surfaces, ACOM is working efficiently for the mapping of crystallite phases and orientations of polycrystalline samples at significantly smaller length scales and is rather insensitive to the plastic deformation state and the surface of nanocrystals. It has also been demonstrated that the precession electron diffraction mode [4,5] improves the reliability of this technique significantly and the so called “180º ambiguity” in the indexing of spot patterns from the zero order Laue zone can be reliably overcome [4]. As for EBSD tools, the electron beam is scanned over the area of interest with a given step size and thousands of electron diffraction patterns are recorded and analysed with appropriate software. The main difference, apart from the use of a transmission instead of a reflection microscope, stands in the fact that spot patterns (i.e.: Bragg diffraction peaks) are preferred to Kikuchi lines to derive the local orientation from the TEM diffraction patterns. Indeed, the positions of Kikuchi (or pseudoKikuchi) lines are very sensitive to the crystal orientation and consequently if the irradiated volume contains small misorientations, the lines are smoothed out and hard to extract from the background noise. This is why EBSD tools indexing capability declines with increasing strain. In the contrary, it is the intensity of the spots rather than their location that is modified by small orientation changes, so that despite the distortions related to dislocations existing in the volume crossed by the electron beam, the Bragg peaks remain well defined and easy to recognize. A further particularity of the present tool is that the spot patterns are identify with image correlation techniques. This means that, firstly, the spot patterns for every set of Euler’s angles within the ranges limited by the crystal symmetry are calculated with devoted software and stored in a database. Then, all the theoretical patterns, called templates, are compared to the acquired one through a variant of the so-called template matching algorithm and the closest one is selected. The Euler’s angles being known for the template, the orientation of the crystal is deduced. The angular resolution is related to the angular step used to generate the database and limited by the quality of the acquired patterns. Further details on the technique are given elsewhere [1-3]. The important point for the present work is that the procedure is efficient even if the acquired image contains superimposed patterns - typically at grain boundaries – in which case the identification procedure is able to extract the dominant one. It is the objective of the present work to demonstrate that the template matching technique may be adapted to non–crystalized materials as well. By essence, the method consists in recognizing, in the acquired image, a signature of the phase to be detected. For crystallized materials, the templates are composed of a collection of diffracting spots calculated in kinematical conditions and, therefore, correspond to crude estimates of the real (dynamical) diffracting signal. The efficiency of the procedure is such that it appears reasonable to recognise any features that may be, at least partly, reproduced on a dedicated template. For amorphous materials, the most striking features are the diffracting rings representative of small range order. Such ring has been merely mimicked using a collection of around 40 points distributed regularly over a circle whose radius is adapted to the acquired conditions (i.e.: TEM camera length). Figure 1 depicts such procedure for a sample of MgCu-Gd partly recrystallized metallic glass. Details concerning the elaboration of the metallic glass
may be found in the paper devoted to this material [6]. This material is essentially amorphous but, due to a specific heat treatment, it contains Mg 2 Cu and Cu 2 Gd precipitates. The classical phase recognition method consists in generating the templates for all the phases to be detected and to select the one with the best matching index (i.e.: image correlation index). If two phases exhibit nearly the same matching index, indexing safety is low and this is captured by a dedicated parameter called reliability. For the amorphous phase, the ring type template was added to the set of possible solutions and the indexing procedure is launched as usual. Figure 2 demonstrate that the procedure is effective. Indeed, the amorphous matrix is systematically recognized with, moreover an excellent reliability. It turns out that for this specific sample it is easier to extract the metallic glass than to distinghuish unambiguously between the two types of possible crystallized precipitates. The authors of [6] are warmly acknowledgments for their contribution to the present work. References [1] EF Rauch and L Dupuy, Arch. Metall. Mater. 2005, 50, P. 87. [2] EF Rauch and A Duft, Mater. Sci. Forum, 495–497 (2005) 197–202. [3] EF Rauch and M Veron, J. Mater. Sci. Eng. Tech. 36 (2005) 552–556. [4] R Vincent and P Midgley, Ultramicroscopy 53 (1994) 271. [5] EF Rauch et al., Special Issue on “Precession Electron Crystallography” of Zeits. Krist. 225, (2010) 103. [6] S Puech, JJ Blandin and JL Soubeyroux, Rev. Adv. Mater. Sci. 18 (2008) 311-316.
Figure 1. The diffracting signal of Mg-Cu-Gd metallic glass exhibits diffuse Rings (left). A typical template used to recognize this signature is depicted at right.
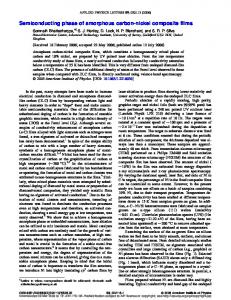
Figure 2. Phase recognition in the metallic glass sample. The bright field image (left) is poorly informative. The indexing reliability (right) is sensitive to crystalline phases. In the phase map (center), both Mg 2 Cu (red) and Cu 2 Gd (green) precipitates are easily distinguished from the amorphous matrix (blue).