typically consider every Virtual Machine (VM) as a black box each with independent .... nodes and virtual machines by organizing the data in time series. Another ...
Automated Clustering of Virtual Machines based on Correlation of Resource Usage Claudia Canali, Riccardo Lancellotti Department of Information Engineering University of Modena and Reggio Emilia {claudia.canali, riccardo.lancellotti}@unimore.it
Abstract—The recent growth in demand for modern applications combined with the shift to the Cloud computing paradigm have led to the establishment of large-scale cloud data centers. The increasing size of these infrastructures represents a major challenge in terms of monitoring and management of the system resources. Available solutions typically consider every Virtual Machine (VM) as a black box each with independent characteristics and face scalability issues by reducing the number of monitoring resource samples, considering in most cases only average CPU usage of VMs sampled at a coarse time granularity. We claim that scalability issues can be addressed by leveraging the similarity between VMs in terms of resource usage patterns. In this paper we propose an automated methodology to cluster VMs depending on the usage of multiple resources, both systemand network-related, assuming no knowledge of the services executed on them. This is an innovative methodology that exploits the correlation between the resource usage to cluster together similar VMs. We evaluate the methodology through a case study with data coming from an enterprise datacenter, and we show that high performance may be achieved in automatic VMs clustering. Furthermore, we estimate the reduction in the amount of data collected, thus showing that our proposal may simplify the monitoring requirements and help administrators to take decisions on the resource management of cloud computing datacenters.
1. I NTRODUCTION Cloud computing has recently emerged as a new paradigm to provide computing services through large-size data centers where customers may run their applications in a virtualized environment. Modern customer applications consist of different software components (e.g., the tiers of a multi-tier Web application) with complex and heterogeneous resource demand behavior. In a virtualized data center, each physical server is enabled to host multiple independent virtual machines (VMs), and each VM runs one software component of a customer application. Due to the rapid increase in size and complexity of these infrastructures, the processes of monitoring and managing cloud data centers are becoming challenging tasks. The monitoring of such infrastructures is likely to present scalability issues due to the amount of data to collect and store when a large number of VMs are considered, each with several resources monitored at high sampling frequency [2]. Also efficient management of VMs in a data center (for example, through periodic consolidation of VMs) do not scale well due to the large amount of data to analyze [22]. The scalability issue is particularly difficult to tackle because providers of Infrastructure as a Service (IaaS) cloud data centers do not have direct knowledge
of the application logic inside a software component, and can only track OS-level resource usage on each VM [23], [27]. Hence, most monitoring and management strategies in cloud data centers assume that each VM is a single object whose behavior is independent from the other VMs of the cloud infrastructure. To reduce the complexity of VM monitoring and management problem, the typical approach in IaaS cloud is to reduce the problem size. To this aim, available solutions may rely on low sampling frequency of VM status or reduce the number of resources that are taken into account, typically considering only CPU- or memory-related information [4], [11], [3], [25]. However, these approaches are likely to suffer important drawbacks: on one hand, reducing the sampling frequency leads to low reactivity to changes in demand; on the other hand, limiting the monitoring to CPU or memory resources may not be sufficient to capture changes in the behavior of VMs running I/O bound or network bound applications. We argue that the scalability of monitoring and management tasks in cloud infrastructures may be improved by leveraging the similarity between VM behaviors, considering VMs not as single objects but as members of a class composed by objects that are running the same software component (e.g., Web server or DBMS). In particular, we refer to the scenario of the so-called private cloud, where the virtualized infrastructure is typically devoted to a reduced number of customers. When a customer outsources part of his data center to this type of cloud, the outsourcing tends to last for long-term periods, possibly in the order of months: customer VMs tend to not change frequently the software component they are running and VMs are acquired or released with relatively low frequency with respect to public cloud scenarios [22], [23]. In this scenario, once we have identified classes of similar VMs, we may select a few representative VMs for each class and carry out monitoring at a detailed level only on these representatives. Other VMs can be monitored at a much coarser granularity level with the goal to discover if their behavior is changing with respect to the class they belong to. This coarse-grained approach can easily reduce the amount of data collected by one order of magnitude with respect to the fine-grained monitoring of every single VM, improving the scalability of cloud monitoring and management. The main contribution of this paper is the proposal of an automated, non parametric methodology to cluster together similar VMs in an IaaS cloud data center on the
basis of their resource usage. The proposed methodology exploits the correlation between the usage of multiple resources to determine which VMs are following the same behavioral patterns. A main advantage of our methodology is that we take into account multiple resources, differently from most of the existing solutions that mainly consider CPU- or memory-related information. We apply the proposed methodology to a dataset coming from a real cloud environment with VMs running Web servers and DBMS. We demonstrate that our methodology can achieve an accuracy in clustering VMs that is between 80% and 100% for every considered scenario, with a reduction in the amount of collected data samples by a factor of 15. Furthermore, we show that taking into account multiple VM resources leads to better results than considering only CPU or memory, as usually done in the state-of-the-art. The remainder of this paper is organized as follows. Section 2 discusses the related work. Section 3 describes the proposed methodology for clustering similar VMs in a cloud environment. Section 4 presents the case study used to evaluate our methodology, while Section 5 and describes the results of our experiments. Section 6 concludes the paper with some final remarks. 2. R ELATED W ORK The research activities related to the scalability issues in cloud data centers concern two main topics that are strictly correlated: resource management and infrastructure monitoring. Many existing studies propose resource management strategies based on the usage of one or few resources compared against thresholds. For example, the studies in [4] and [11] propose solutions for consolidation of virtual machines based on adaptive thresholds regarding the CPU utilization values. Wood et al. [27] propose a reactive, rule-based approach for virtual machine migration that defines threshold levels regarding the usage of few specific physical server resources, such as CPU-demand, memory allocation, and network bandwidth usage. Kusic et al. [15] address the issue of virtual machine consolidation through a sequential optimization approach; the drawback is that the proposed model requires simulation-based learning and the execution time grows very fast even with a limited number of nodes. All these studies perform a per-node analysis based on the usage of one or few resources; however, these approaches are likely to suffer from scalability issues in large scale distributed systems, such as IaaS cloud computing data centers. Few recent studies aim to reduce the dimensionality of the resource management problem, such as [22], [21], [24]. The studies in [22], [21] exploit a statistical analysis based on Singular Value Decomposition (SVD) to predict the workload demand aggregated on different virtual machines to anticipate overload conditions on physical servers and trigger virtual machine migrations. Tan et al. [24] apply Principal Component Analysis (PCA) to evaluate resource usage patterns across different nodes. The proposal consists in placing on the same physical
server virtual machines with negatively correlated resource patterns to reduce the usage variability on the servers. All these studies have a different goal with respect to our paper, because they address the specific problem of virtual machine consolidation in cloud datacenters. Moreover, all their solutions consider only one resource, that is the CPU utilization of virtual machines, while we aim to support management strategies that consider multiple resources, from CPU to network and disks. An initial version of the present methodology was proposed in [5]. However the present paper is a clear step ahead with respect to the previous proposal. Beside a more detailed theoretical definition of our proposal, we provide a wider set of experimental analyses with respect to [5]. In particular, we to demonstrate the advantage of considering multiple metrics with respect to choosing only the most popular ones (that is CPU, memory, network, etc). Furthermore, we discuss in detail the scalability of the clustering step to demonstrate that the proposed methodology can be applied also to large data centers. As regards the issue of monitoring large data centers, current solutions can be divided into log aggregators and frameworks for periodic collection of system status indicators. Among log aggregators, often called also log collectors, the most widespread solution is the Syslog daemon, with its recent extension [12] that was explicitly designed to be used by cloud entities or applications to log and trace activities occurring in the cloud. Solutions such as Cacti and Munin [16], [18] are more oriented towards the periodic collection of data. Cacti is an aggregator of data transferred through the SNMP protocol, while Munin is a monitoring system based on a proprietary local agent interacting with a central data collector. Both these solutions are typically oriented to medium to small data centers because of their centralized architecture that limits the overall scalability of the data collection process. Ganglia [10] provides a significant advantage over the previous solutions as it supports a hierarchical architecture of data aggregators that can improve the scalability of data collection and monitoring process. As a result, Ganglia is widely used to monitor large data centers [8], [19], even in cloud infrastructures [26], by storing the behavior of nodes and virtual machines by organizing the data in time series. Another solution for scalable monitoring is proposed in [2], where data analysis based on the map-reduce paradigm is distributed over the levels of a hierarchical architecture to allow only the most significant information to be processed at the root nodes. However, all these solutions share the same limitation of considering each monitored object (being it a VM or a host) independent from the others. This approach fails to take advantage from the similarities of objects sharing the same behavior. On the other hand, a class-based monitoring system may perform a fine-grained monitoring for only a subset of objects that are representative of a class, while other members of the same class can be monitored at a much more coarse-grained level. We believe that integrating our solution into existing hierarchical models for monitoring
Figure 1.
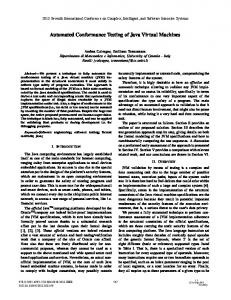
Methodology overview
can significantly improve the scalability of monitoring operations. 3. M ETHODOLOGY In this section we describe the proposed methodology to automatically cluster similar VMs in a cloud data center on the basis of their resource usage information. For each customer application, we aim to group together VMs which are running the same software component (e.g., VMs belonging to the same tier of a Web application), and are therefore showing similar behaviors in term of resource usage. We recall that our reference scenario is a private cloud where we assume that the software components hosted on each VM do not change for long periods of time (i.e., they remain the same for months), and VMs are seldom acquired or released. The process of clustering similar VMs and the related collection of data about VM resource usage is carried out periodically with a frequency that allows to cope with changes in the VM behavior, for example once every several weeks. Hence, the actual computational cost of the methodology is not considered as critical, due to its low invocation frequency. The proposed methodology consists of the following steps, outlined also in Figure 1 • Extraction of a quantitative model for describing the VM behavior. • Clustering based on the VM behavior model to identify classes of similar VMs. Given a set of N VMs, the first step of the methodology aims at representing the behavior of each VM n, with n ∈ [1, N ]. We consider that capturing the inter-dependencies among the usage of different resources, such as CPU utilization, network throughput or I/O rate, can describe the VM behavior during a period of time. For example, in Web servers network usage is typically is related to the CPU utilization [7], while for DBMS CPU utilization tends to change together with storage activity [14]. We consider each VM as described by a set of metrics, where each metric m ∈ [1, M ] represents a resource of the VM. Let (Xn1 , Xn2 , . . . , XnM ) be a set of time series, where Xnm is the vector of the samples of the time series describing the metric m of VM n. The inter-dependencies between VM metrics are measured using correlation values, that can be represented as elements of the correlation matrix Sm , where snm1 ,m2 = cor(Xnm1 , Xnm2 ) is the
correlation coefficient between the two time series Xnm1 and Xnm2 . We choose the Pearson product-moment correlation coefficient (PPMCC) to measure the degree of correlation between pairs of metric time series, that is defined as:
snm1 ,m2
X P
(xnm1 (i) − x ¯nm1 )(xnm2 (i) − x ¯nm2 ) s =s X X P P ¯nm1 )2 ¯nm2 )2 (xnm1 (i) − x (xnm2 (i) − x i=1
i=1
i=1
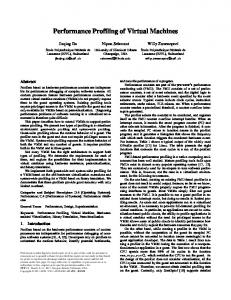
where X is the length of the metric time series (X = ¯nm |Xnm |, ∀m ∈ [1, M ], ∀n ∈ [1, N ]), while xnm (i) and x are the i-th element and the average value of the time series Xnm , respectively. The correlation matrix Sn describing the behavior of the VM n is given as input to the second step of the methodology, that aims to group similar VMs into classes. Starting from the matrix Sn , we build a feature vector Vn that is fed into a clustering algorithm. Clustering algorithms typically have a computational complexity that grows with the size of the feature vector, hence the performance of the clustering task can be reduced by avoiding redundancies in the Vn vector. To this aim, we exploit the symmetric nature of the matrix Sn and the fact that the main diagonal is composed of “1” to reduce the length of Vn . We create the feature vector using the elements of the lower triangular sub-matrix: the feature vector is defined as Vn = (sn2,1 , sn3,1 , sn3,2 , . . . , snM,1 , . . . , snM,M −1 ). Figure 2 provides an example of creation of the feature vector from the correlation matrix. In the provided example M = 4. The feature vector Vn is thus used by the clustering algorithm as the coordinate of VM n in the feature space. We define C as the vector resulting form the clustering operation. The n-th element of vector C, cn , is the number of the cluster to which VM n is assigned. Many algorithms are available for clustering, starting from the simple and widespread k-means to more complex kernel-based solutions, up to clustering based on spectral analysis [13], [9]. In this first proposal of a methodology to automatically cluster similar VMs, we adopt one of the most popular solutions for clustering, that is the k-means algorithm [13]. The k-means algorithm core is a loop with two steps. The first step starts with a set of centroids and a set of VM, each described as a point in a multi-dimensional feature
tolerance [6]. The above-described methodology has been implemented using popular technologies for the data management and analysis. Specifically, we use the R language 1 for the statistical analysis functions, python 2 for the for the task of reading and writing data and as a wrapper for the R core. Finally, we use Bourne shell 3 to invoke the main steps of the methodology. These choices ensure that our proposal can be easily deployed directly in currently available cloud infrastructures. 4. C ASE STUDY
Figure 2.
Creation of feature vector
space (for the VMs their coordinates in the feature space are represented through their feature vectors Vn ). Each VM is assigned to the cluster of the centroid that is closer to the VM position in the feature space. Next the centroids updated so that the centroid coordinates are the mean value of the coordinates of the points belonging to the cluster. The loop ends when the assignments of VMs to clusters no longer change. It is worth to note that the k-means algorithm starts with a random set of centroids. To ensure that the kmeans result is not affected by local minimums, we iterate the k-means multiple times, then we compare the ratio between inter-cluster distances (sum of squares of distances between elements belonging to different clusters) and intra-cluster distances (sum of squares of distances between elements of the same cluster). Finally, we select the best solution across multiple k-means runs as the solution that maximize inter-cluster distances and minimize intra-cluster distances. The use of the popular k-means clustering technique leaves unaddressed the problem of automatically identify the number of clusters to be used to classify the considered VMs. More advanced techniques, such as techniques based on the Spectral Analysis, can be used to this aim [20], but we leave the comparison of different clustering algorithms as a future work. Once the clustering is complete, we can select some representative VMs for each class to the purpose of simplifying the monitoring task. Clustering algorithms such as k-means provide as additional output the coordinates of the centroids for each identified class. In our scenario, the representative VMs can be selected as the VMs closest to the centroids. The choice to consider more than one representative for each class is due to the possibility that a selected class representative changes its behavior with respect to the class it belongs to. When more than one representative is used, quorum-based techniques can be exploited to identify a misbehaving VM within the list of representatives, as suggested in the case of byzantine fault
To evaluate the results of the proposed methodology, we consider a case study based on a dataset coming from an enterprise datacenter supporting one customer Web-based application deployed according to a multi-tier architecture. The data center is composed of 10 nodes on a Blade-based system and exploits virtualization to support the Web application. The nodes host 110 VMs that are divided between Web servers and back-end servers (that are DBMS). We collect detailed data about the resource usage of every VM for different periods of time, ranging from 5 to 180 days. The samples are collected with a frequency of 5 minutes. For each VM we consider 11 metrics describing the usage of different resources (such as CPU, memory, disk, and network). The complete list of the metrics is provided in Table 1 along with a short description. Table 1 V IRTUAL MACHINE METRICS
X1 X2 X3 X4 X5 X6 X7
Metric SysCallRate CPU DiskAvl CacheMiss Memory UserMem SysMem
X8
PgOutRate
X9
InPktRate
X10
OutPktRate
X11
ActiveProc
Description Rate of system calls [req/sec] CPU utilization [%] Available disk space [%] Cache miss [%] Physical memory utilization [%] User-space memory utilization [%] System-space memory utilization [%] Rate of memory pages swap-out [pages/sec] Rate of network incoming packets [pkts/sec] Rate of network outgoing packets [pkts/sec] Number of active processes
It is worth to note that, to collect data about 11 VM metrics with a frequency of 1 sample every 5 minutes, we need to manage a volume of data in the order of 3.1 × 10³ samples per day per VM. Considering a data center hosting 110 VMs, the total amount of data is in the order of 3.5×10⁵ samples per day. After the clustering, we need to continue monitoring every 5 minutes only a few representatives per class, while the remaining VMs can be monitored with a coarse time granularity, for example 1R
project home page: http://www.r-project.org/ home page: http://www.python.org/ 3 Bourne shell home page: http://www.gnu.org/software/bash/ 2 Python
of 1 sample every few hours. Assuming to select 3 representatives for each of the 2 classes, the amount of data to collect after clustering is reduced to 1.9 × 10⁴ samples per day for the class representatives; for the remaining 104 VMs, assuming to collect 1 sample every 6 hours for VM, the data collected are reduced to 4.5 × 10³ samples per day. From this example we observe that our proposal may reduce the amount of data collected by nearly a factor of 15, from 3.5 × 10⁵ to 2.35 × 10⁴ .
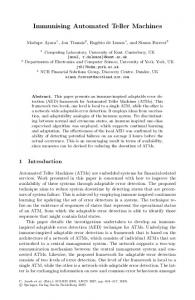
short time series of measurements are available. However, the capability of the methodology to achieve acceptable performance for short time series is particularly important for our scenario because it allows us to reduce the period of time during which we need a fine-grained monitoring of the VM resources. This motivates a more in-depth analysis to understand how the methodology performance can be improved for short time series of data.
5. E XPERIMENTAL RESULTS
purity =
|{cn : cn = cn∗ , ∀n ∈ [1, N ]}| |C|
where |{cn : cn = cn∗ , ∀n ∈ [1, N ]}| is the number of VMs correctly clustered and |C| = N is the number of VMs. In our experiments, we evaluate the purity of the clustering as a function of the length of the time series expressing the metric measurements. Furthermore, we provide an insight on the computational costs of the proposed methodology for varying number of VMs and considered metrics. A. Analysis for different time series length The histogram in Figure 3 presents the clustering purity as a function of the time series length. We show that, given a very long time series, the clustering achieves perfect results, meaning that every Web server and every DBMS is correctly identified. On the other hand, the purity significantly decreases as we reduce the amount of data used to create the correlation matrix. In particular, when the time series is below 20 days, the purity is below 0.7, reaching 0.65 for a time series of only 5 days. From this first analysis, we observe that the straightforward application of the methodology is likely to provide poor results when
0.8 Clustering Purity
Let us now describe the application of the methodology to the considered case study. For each considered VM, we compute the correlation between each pair of measured metrics. As discussed in Section 3, the resulting correlation matrix is used to build a feature vector, which describes the VM behavior and is given as input to the subsequent VM clustering step. As the k-means algorithm starts each run with a set of randomly-generated cluster centroids, we run the final clustering 103 times, then we select the best solution C as described in Section 3. Finally, we compare the output of the clustering step with the ground truth represented by the correct classification of VMs (we consider that Web servers and DBMS servers are divided into two different clusters) to evaluate the performance of the methodology. Specifically, we aim to evaluate how many VMs are correctly identified as Web and DBMS servers. To this purpose, we consider the clustering purity [1], that is one of the most popular measures for clustering evaluation. The clustering purity is obtained by comparing the output of the clustering algorithm C with the vector C∗ , which represents the correct clustering solution. Purity is thus defined as:
1
0.6
0.4
0.2
0 5
10
15
20
30
40
60
120
180
Time series length [days]
Figure 3.
Clustering purity for different time series length
B. Filtering of idle periods Analyzing the reasons for the poor performance with time series shorter than 20 days, we observe that some VMs present a bimodal behavior, showing periods where the VM is mostly idle mixed with periods where the VM is heavily utilized. When we consider short intervals (e.g., 5 days), we notice that some time series are composed almost exclusively by idle periods. This is the reason for the poor performance of the methodology: during the idle periods, the correlation between the metrics describing the VM behavior is significantly reduced, thus leading to wrong clustering. To avoid this effect, we consider a different approach, where we filter the time series in order to extract a sequence of samples with no idle periods in between. In Figure 4, we compare the results of our filtered data against the time series of the same length used previously. The histograms of Figure 4 clearly show the benefit derived from the filtering of data. The clustering purity is increased by 14% for every considered time series length. This results is important because it shows that applying filtering to the resource measurements can increase the purity of the clustering up to values higher than 0.8 even for the shortest considered time series. C. Impact of metric reduction We now aim to evaluate the impact on the methodology performance of a reduction in the number of the metrics considered in the description of VM behavior. The main reason to perform this analysis is the comparison with common state-of-the-art approaches for data center monitoring and management [4], [11], [3], [25], which tend
1
No Filter Idle Filter
0.8
0.8 Clustering Purity
Clustering Purity
All metrics 4 Metrics 2 Metrics
1
0.6
0.4
0.2
0.6
0.4
0.2
0
0 5
10
15
5
10
Time series length [days]
Figure 4.
Impact of idle data filtering on clustering purity
to consider only few VM resources, typically CPU and memory. Specifically, we evaluate if the metrics that are typically used in these approaches are sufficient for our methodology to perform an accurate clustering of VMs. We should also consider that the choice to reduce the number of metrics fed into the clustering algorithm could provide a twofold benefit: first, it reduces the amount of information that is necessary to collect before applying the methodology; second, it reduces the computational cost of the clustering operation as it reduces the size of the feature vectors |Vn | given as input to the final clustering step. In this experiment, we compare the clustering purity when different sets of metrics are used to generate the feature vectors for the clustering step. We compare the proposed methodology, where all the 11 metrics are considered, with two alternatives: the 2 Metrics case, where only CPU and memory (X2 and X5 metrics in Table 1, respectively) are considered as in state-of-theart approaches, and the 4 Metrics case, where we include also two network-related metrics measuring the rate of input and output packets (X2 , X5 , X9 , X10 in Table 1). Figure 5 shows, for different time series lengths, the purity achievable when considering every metric (All Metrics), only CPU and memory (2 Metrics), and four metrics related to CPU, memory, and network (4 Metrics). On the right side of the figure, we report the results for the filtered time series, labeled as X-F, where X represents the time series length expressed in number of days. The histograms in Figure 5 show that reducing the amount of metrics considered by the clustering is not a viable option for VM clustering. Using only four metrics leads to a performance degradation up to 25.6% and 17.6% for unfiltered and filtered time series, respectively. Considering the case where only two metrics are taken into account, the clustering performance is even worse, especially because the penalty in the achieved purity is more evident for the shortest time series, with a decrease up to 21.5% and 33.8% for unfiltered and filtered time series, respectively. Furthermore, when only CPU and memory are considered the application of filtering techniques to short metric time series does not lead to any improvement
15
20
30
40
60
120 180
5-F 10-F 15-F
Time series length [days]
Figure 5.
Clustering purity for different sets of metrics
of the clustering performance with respect to the unfiltered case. This result confirms our claim that for clustering VMs on the basis of similar behaviors we need to consider multiple metrics, differently from common approaches for data center monitoring and management, where only CPU and memory are typically considered. D. Evaluation of methodology computational cost As reducing the number of considered metrics is not a viable option for VMs clustering, we aim to evaluate the computational cost of the proposed methodology as the number of VMs grows in order to investigate the scalability of our approach. To this purpose, we measure the execution times of the two steps of the methodology on an Intel Xeon 2GHz node. We observe that the time required for the first step of the methodology, which basically computes the correlation matrix describing the VM behavior, always remains in the order of few seconds: it reaches 3 seconds for time series of 180 days and 11 metrics, which is the most expensive case from the computational point of view for this step. As regards the second step of the methodology, we should consider that the computational cost of the clustering phase depends on two elements: the number of considered metrics, which determines the length of the feature vectors given in input to the clustering algorithm, and the number of VMs to cluster. Figure 6 shows the execution times of the clustering step as a function of the number of metrics and of VMs to cluster, considering filtered metric time series of 15 days. In particular, we consider a number of metrics ranging from 2 to 11 and a number of VMs increasing from 10 to 110. The graph shows a linear growth of the time required for clustering as the number of VMs increases, while the growth of clustering time as a function of the number of metrics is super-linear. This result is consistent with the theoretic computational complexity of the k-means algorithm [17], which is in the order O(ICN V ), where I is the number of iteration of the clustering, C is the number of clusters, N is the number of VMs, and V is the length of the feature vectors used to describe each VM. The length
R EFERENCES Clustering time [s]
1.5
2
2.5
3
3.5
4
4.5
5
5.5
6
6.5
[1] E. Amig´o, J. Gonzalo, J. Artiles, and F. Verdejo. A Comparison of Extrinsic Clustering Evaluation Metrics Based on Formal Constraints. Journal of Information Retrieval, 12(4):461–486, Aug. 2009.
7 6 5 4 3 2 1
100 Num 80 60 ber o f nod 40 20 es N
Figure 6.
[2] M. Andreolini, M. Colajanni, and S. Tosi. A software architecture for the analysis of large sets of data streams in cloud infrastructures. In Proc. of the 11th IEEE International Conference on Computer and Information Technology (IEEE CIT 2011), Cyprus, Aug.-Sept. 2011. 2
3
4
5
6
7
8
9
10 11
trics M
Number of me
Clustering time for varying number of metrics and Vms
of the feature vector V has a quadratic dependence from the number of metrics M , thus explaining the super-linear growth of the clustering time with respect to M . We also evaluate the purity achieved for varying metric and VM number. We observe that the purity is mostly unaffected by the number of VMs to cluster, ranging from 0.83 to 0.85 when all the metrics are considered. On the other hand, purity is highly affected by the the number of considered metrics, as discussed in Section 5-C, with values ranging from 0.84 for the whole set of metrics to 0.57 for the case of only two metrics. The proposed analysis of computational costs proves that our methodology for clustering VMs on the basis of their resource usage is scalable and does not pose performance issue for the applicability even in the case of large data centers. 6. C ONCLUSIONS AND FUTURE WORK Modern data centers supporting Infrastructure as a Service cloud present major challenges in terms of scalability issues for the monitoring and management of the system resources. In this paper we propose a methodology for automatically clustering VMs into classes sharing similar behavior with the aim to improve the scalability of data center monitoring and management. To capture the VM behavior, the proposed methodology exploits the correlation among the usage of multiple resources, ranging from CPU to storage and network. The application of the proposed methodology to a real data center hosting multitier Web applications shows that the purity of VMs clustering ranges between 100% and 80% for every considered scenario and can reduce the amount of data collected by a factor of 15. This study is just a first step towards the definition of a general methodology for the automated classification of VMs in cloud data centers. As a future work we plan to apply our methodology to a more complex scenario where the data center hosts not only two classes of VMs but several different applications. In this scenario, the methodology will be extended to automatically determine the number of classes to identify during the clustering phase. Furthermore, we intend to investigate the use of alternative techniques to determine the similarity of VMs behavior.
[3] D. Ardagna, B. Panicucci, M. Trubian, and L. Zhang. Energy-Aware Autonomic Resource Allocation in Multitier Virtualized Environments. IEEE Transactions on Services Computing, 5(1):2 –19, Jan.-Mar. 2012. [4] A. Beloglazov and R. Buyya. Adaptive Threshold-Based Approach for Energy-Efficient Consolidation of Virtual Machines in Cloud Data Centers. In Proc. of (MGC’10), Bangalore, India, Dec. 2010. [5] C. Canali and R. Lancellotti. Automated Clustering of VMs for Scalable Cloud Monitoring and Management. In Proc. of 20th International Conference on Software, Telecommunications and Computer Networks (SOFTCOM’12), Split, Croatia, Sept. 2012. [6] M. Castro and B. Liskov. Practical Byzantine Fault Tolerance. In Proc. of the 3rd Symposium on Operating Systems Design and Implementation (OSDI’99), New Orleans, Louisiana, United States, Feb. 1999. [7] E. Cecchet, A. Chanda, S. Elnikety, J. Marguerite, and W. Zwaenepoel. Performance Comparison of Middleware Architectures for Generating Dynamic Web Content. In Proc. of the 4th International Middleware Conference, Jun. 2003. [8] W.-C. Chung and R.-S. Chang. A new mechanism for resource monitoring in Grid computing. Future Generation Computer Systems, 25(1):1 – 7, 2009. [9] M. Filippone, F. Camastra, F. Masulli, and S. Rovetta. A survey of kernel and spectral methods for clustering. Pattern Recognition Letters, 41(1):176–190, Jan. 2008. [10] Ganglia Monitoring System, http://ganglia.sourceforge.net/.
2012.
–
[11] D. Gmach, J. Rolia, L. Cherkasova, and A. Kemper. Resource pool management: Reactive versus proactive or let’s be friends. Computer Networks, 53(17), Dec. 2009. [12] G. Golovinsky, S. Johnston, and D. Birk. Syslog Extension for Cloud Using Syslog Structured Data. Internet-Draft, March 2011. [13] A. K. Jain. Data clustering: 50 years beyond K-means. Pattern Recognition Letters, 31(8):651 – 666, 2010. [14] S. Kavalanekar, D. Narayanan, S. Sankar, E. Thereska, K. Vaid, and B. Worthington. Measuring database performance in online services: A trace-based approach. In R. Nambiar and M. Poess, editors, Performance Evaluation and Benchmarking, pages 132–145. Springer-Verlag, Berlin, Heidelberg, 2009.
[15] D. Kusic, J. O. Kephart, J. E. Hanson, N. Kandasamy, and G. Jiang. Power and Performance Management of Virtualized Computing Environment via Lookahead. Cluster Computing, 12(1):1–15, Mar. 2009. [16] S. M. I. Lavlu and D. Kundu. Cacti 0.8 Network Monitoring. Packt Publishing, 2009. [17] C. D. Manning, P. Raghavan, and H. Schtze. Introduction to Information Retrieval. Cambridge University Press, New York, NY, USA, 2008. [18] The Munin Monitoring Homepage, 2012. – http://muninmonitoring.org/. [19] A. N. Naeem, S. Ramadass, and C. Yong. Controlling Scale Sensor Networks Data Quality in the Ganglia Grid Monitoring Tool. Communication and Computer, 7(11):18–26, Nov. 2010. [20] G. Sanguinetti, J. Laidler, and N. Lawrence. Automatic determination of the number of clusters using spectral algorithms. In Machine Learning for Signal Processing, 2005 IEEE Workshop on, pages 55 –60, sept. 2005. [21] T. Setzer and A. Stage. Decision support for virtual machine reassignments in enterprise data centers. In Proc. of IEEE/IFIP Network Operations and Management Symposium Workshops (NOMS’10), Osaka, Japan, Apr. 2010. [22] T. Setzer and A. Stage. Filtering multivariate workload non-conformance in shared IT-infrastructures. In Proc. of
IFIP/IEEE International Symposium on Integrated Network Management (IM’11), Dublin, Ireland, may 2011. [23] R. Singh, P. J. Shenoy, M. Natu, V. P. Sadaphal, and H. M. Vin. Predico: A System for What-if Analysis in Complex Data Center Applications. In Proc. of 12th International Middleware Conference, Lisbon, Portugal, Dec. 2011. [24] J. Tan, P. Dube, X. Meng, and L. Zhang. Exploiting Resource Usage Patterns for Better Utilization Prediction. In Proc. of the 31st International Conference on Distributed Computing Systems Workshops (ICDCSW’11), Minneapolis, USA, Jun. 2011. [25] C. Tang, M. Steinder, M. Spreitzer, and G. Pacifici. A scalable application placement controller for enterprise data centers. In Proceedings of the 16th international conference on World Wide Web, WWW’07, Banff, Alberta, Canada, May 2007. [26] C.-Y. Tu, W.-C. Kuo, W.-H. Teng, Y.-T. Wang, and S. Shiau. A Power-Aware Cloud Architecture with Smart Metering. In Proc. of 39th International Conference on Parallel Processing Workshops (ICPPW’10), San Diego, CA, Sept. 2010. [27] T. Wood, P. Shenoy, A. Venkataramani, and M. Yousif. Black-box and gray-box strategies for virtual machine migration. In Proc. of the 4th USENIX Conference on Networked systems design and implementation, NSDI’07, Cambridge, MA, Apr. 2007.