IEEE TRANSACTIONS ON IMAGE PROCESSING
1
Automated counting of newborn cells during neurogenesis? Fabian J. Theis, Zacharias Kohl, Christian Guggenberger, Georg Kuhn and Elmar W. Lang
Abstract— The genesis of new neurons in the adult human brain currently lies in the focus of many research groups. In order to quantify neurogenesis in animals, newborn cells are labelled with specific markers such as BrdU; in brain sections these can later be analyzed and counted through the use of a confocal microscope. However so far, this counting process has been performed manually. Here, an algorithm called ZANE to automatically identify cell components in digitalized section images is presented. First, a so-called cell classifier is trained with cell and non-cell patches using single- and multi-layer perceptrons as well as unsupervised independent component analysis with correlation comparison. The cell classifier can then be used in an arbitrary number of sections by scanning the section and choosing maxima of this classifier as cell center locations. ZANE is applied to measure neurogenesis in adult rodent brain sections. An experiment shows that the proliferation of neurons is substantially stronger (340%) in the dentate gyrus of an epileptic mouse than in a control group. The ZANE software is freely available for download. Index Terms— cell counting, image segmentation, image stitching, cell classification, neurogenesis, BrdU.
EDICS Category: 2-SEGM, 2-NEUR I. I NTRODUCTION The goal of this work is to automate the task of counting labelled cells, which is currently done manually in many laboratories. Our novel algorithm contributes to a substantial speed-up in experimental settings. Furthermore, when comparing manual counts, differences in the counts are often noticed; hence, with an automated counting algorithm we hope to achieve an objective counter with known error bounds. The paper is organized as follows: in the following section, we present the necessary neuro-biological background of the analyzed section images. We then give an overview of the ZANE cell counting algorithm, section III. The next section presents a simple algorithm for image stitching used in ZANE to allow for counting larger brain sections. The neural-network cell classifier is constructed in section V, which is then used to analyze cell images in section VI. Comparison with other methods are presented in section VII, and our main results are shown in section VIII, comparing ZANE with manually counted section images. We finish with a discussion of further applications and future work. ? Some preliminary results were reported in [1]. F. Theis, C. Guggenberger and E. Lang are with the Institute of Biophysics, Z. Kohl and H. Kuhn are with the Department of Neurology, both at the University of Regensburg in 93040 Regensburg, Germany (contact email:
[email protected]). F. Theis and E. Lang gratefully acknowledge financial support by the DFG (GRK 638) and the BMBF (project ‘ModKog’).
II. B IOLOGICAL BACKGROUND While many different tissues of the mammalian organism are capable of renewing themselves after damage, it was believed for long that the nervous system is not able to regenerate at all. Nevertheless, the first data showing that generating new nerve cells in the adult brain could happen were presented by Altman et al. in the 1960s. They published histological data showing new neurons in the brain of adult rats [2]. To identify those cells they used the audioradiographic method by labeling newly emerged cells with 3H-thymidine. As there had no good tool been established to proof that these cells were adult nerve cells, these findings remained relatively unnoticed over several years. In the early eighties F. Nottebohm et al. found developing new neurons in the dorsomedial striatum of adult song birds [3], [4]. But adult neurogenesis came into focus not until the 1990s [5], [6], where new techniques to analyze the newborn neurons were established. Especially the introduction of the thymidine-analogon bromodeoxyuridine (BrdU) as a non radioactive marker for dividing cells gave rise to many new studies concerning adult neurogenesis. On the other hand by establishing confocal microscopy it became possible to identify the characteristics of the newborn cells more clearly. After that it could be shown that adult neurogenesis occurred in rodents like rats and mice, but also was found in primates and even in human [5], [7], [8]. But neuroscientists also found that adult neurogenesis under physiological conditions is restricted to two brain regions: One is the lateral wall of the lateral ventricle, which is called the subventricular zone. The cells generated there migrate through the rostral migratory stream to the olfactory bulb, where they differentiate into mature neurons. The other ‘neurogenic’ region in the adult brain is the granular cell layer of the dentate gyrus in the hippocampal formation of the temporal lobe. There new cells are born in a thin zone right below the granular cell layer. During differentiation the cells integrate into the granule cell layer and become mature neurons with all functions of a granule cell [9]. It has to be mentioned that ‘neurogenesis’ does not mean proliferation of cells alone, these newborn cells have to differentiate into mature nerve cells and be integrated into the existing network of neurons. After these important findings much research was performed on the possible factors influencing adult neurogenesis. It could be shown that adult neurogenesis can be regulated by administering growth factors, neurotransmitters and several drugs. Further on pathological influences like ischemia, seizures or radiation affects the amount of newly generated nerve cells.
IEEE TRANSACTIONS ON IMAGE PROCESSING
2
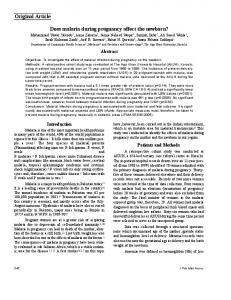
Fig. 1. Typical section image. The black scale bar is of length 50µm. Here, the number of counted cell within the boundary (region of interest) following the dentate gyrus is 84, the number of cells in the whole image is 116.
Also general effects like age, genetic modifications and the amount of physical activity influences neurogenesis (review in [10]). Animals living in an enriched environment compared to standard laboratory conditions showed an increase of neurogenesis under distinct conditions [11]. III. AUTOMATED COUNTING Figure 1 shows a brain section image of the dentate gyrus of a mouse, in which the cells are to be counted. Classical approaches such as thresholding and erosion after image normalization could not successfully count the cells, mainly because cell clusters in the image cannot be detected properly and counted using this method. In section VII we give a more detailed comparison with other methods. A. ZANE We propose the following adaptive counting algorithm, which we call ZANE (Zell1 Analysis and Evaluation). In the first step ZANE performs image stitching of the various microscope images and manual ROI selection to acquire the analysis image. The main counting step is based on a method proposed by Nattkemper et al. [12], [13] for evaluating fluorescence micrographs of lymphocytes invading human tissue; here however it is applied to light microscope images, and classifier preprocessing and training is different. The main idea is first to construct a function mapping an image patch to a confidence value in [0, 1], indicating how probable a cell lies in this patch or not — we call this function cell classifier. In the second step this function is applied as a local filter onto the whole image; its application gives a probability distribution over the whole image with local maxima at cell positions. Nattkemper et al. call this distribution confidence map. Maxima analysis of the confidence map reveals the number and the position of the cells. A flow chart of the ZANE-algorithm is shown in figure 2. 1 german
for cell
Fig. 2.
Flow chart of the main counting step during ZANE image analysis.
B. Regions of interest In practice, the cell counting is to be performed not within the whole image but only within a restricted region of the image called region of interest (ROI). For example in the presented experiments, we only want to count cells from the dentate gyrus in the hippocampal formation of the temporal lobe. So far, the selection of the ROI is done manually, but we hope to automate this process in the future, too. However, precise criteria for the ROI detection seem to be difficult to extract — we assume a joint criterion taking both shape and image background texture into account is needed. IV. I MAGE STITCHING Typically brain sections are too large in physical size to be digitalized as single image by the camera at fixed resolution. In this case, multiple pictures are taken of the section with horizontally and vertically translated origin. In a first preprocessing step, these translated image patches have to be stitched together. This task is denoted by image stitching and has already been widely studied in the image processing community, see for example [14]–[16] and references therein. Mathematical properties together with the more general geometric pattern matching problem are nicely discussed in [14]. With ZANE, we take a quite direct approach to the image stitching problem. First, we need to define a measure for comparing two image patches I1 , I2 ∈ Rh×w of size h × w. As mentioned in the previous section, we consider patches with marked regions of interest. For the sake of simplicity, we assume that the given image patch has pixel-entries only within a given interval C say [0, 255]. Pixels not belonging to the ROI are to be set to a fixed value outside of C, say -1 (in the figures however, we show those pixels as white). An
IEEE TRANSACTIONS ON IMAGE PROCESSING
3
image patch comparison measure can then simply be defined by 1/p X d¯p (I1 , I2 ) := |I1 (j) − I2 (j)|p j,I1 (j)6=−1 I2 (j)6=−1
with p > 0. This is obviously equivalent to taking the p-norm of the vector of pixels lying in both ROIs. Typical choices of p are p = 1, 2. In order to be able to compare image patches with a varying size of the ROI, we further normalize this measure (for images with non-empty ROI) as follows: dp (I1 , I2 ) :=
(a) Left image patch
(b) Right image patch
d¯p (I1 , I2 ) |{j|I1 (j) 6= −1 and I2 (j) 6= −1}|
Then dp (I1 , I2 ) ∈ C, so overlapping image patches of different sizes with different ROI-sizes can be compared. In practice, we set dp (I1 , I2 ) to some large value, if the overlap of the image patches and their ROIs is too small. Since we only have to consider translations (the scale as well as the rotation of the image patches can be assumed to be the same due to the experimental setup), image stitching of two patches I1 and I2 is performed by minimizing dp (I1 , τδ (I2 )), where τδ is a translation of the image patch interpreted as subset of R2 by the vector δ ∈ R2 :
(c) Stitched image Fig. 3. Image stitching: the two image patches (with marked regions of interest) are stitched together using translation of the two patches against each other.
δ 0 := argminδ dp (I1 , τδ (I2 )) Various minimization algorithms can be employed to find or approximate δ 0 . A simple solution is for example given by (discrete) gradient descent to determine local minima: the update rule is defined by δ new = δ old − η∇dp (I1 , τδ (I2 ))p where η denotes a fixed or adaptive learning rate and ∇ the (discretized) gradient of the cost function (taken to the power p to avoid roots) with respect to δ. The latter can easily be calculated as ¶ µ X τ(δ1 +1,δ2 ) (I2 )(j) − τδ (I2 )(j) p (τδ I2 (j)−I1 (j)) τ(δ1 ,δ2 +1) (I2 )(j) − τδ (I2 )(j) j,I1 (j)6=−1 τδ I2 (j)6=−1
In practice, we use a manually selected feature from each image to restrict the search space (δ), and then search for translations δ within this restricted region. Figure 3 shows an experiment, where two previously marked ROIs are stitched together using the above algorithm.
V. C ELL CLASSIFIER In this section, we will explain how to generate a cell classifier that is a function mapping image patches to cell confidence values. For this a sample set of cells and non-cells is generated; then an artificial neural network is trained using this sample set.
Fig. 4. Part of the training set: The first row consists of 20x20-pixel image patches that contain cells, the lower row consists of non-cell image patches.
A. Sample set After fixing the patch size — in the following we will use 20 by 20 pixel gray-level image patches — a training set of cell and non-cell patches has to be manually generated by the expert. The image set is enlarged by adding rotated flipped copies of the patches. The image patches are then to be classified by a neural network. Figure 4 shows some cell and non-cell patches. Interpreting each 20 by 20 image patch as a 400dimensional vector, we thus get a set of L training vectors T := {(x1 , t1 ), . . . , (xL , tL )} with xi ∈ Rn — here n = 202 — representing the image patch and ti ∈ {0, 1} either 0 or 1 depending on whether xi is a non-cell or a cell. Note that this can easily be generalized to classify different types of cells. The goal is to find a mapping correctly classifying this data set that is a mapping ζ : Rn → [0, 1] with ζ(xi ) = ti for i = 1, . . . , L. We call such a mapping cell classifier. Of course ζ is not uniquely defined by the above property, so some regularization has to be introduced. Any interpolation technique such as Fourier
IEEE TRANSACTIONS ON IMAGE PROCESSING
4
C. Neural network learning 1.5 1 0.5 0 −0.5 −1 −1.5 −2 4 4
2 3 2
0
1 0
−2
−1 −4
−2 −3
Fig. 5. Data set with 120 samples after 3-dimensional PCA projection (91% of the data was retained). The dots mark the 60 samples representing cells, the crosses mark the 60 non-cell data points. The two circles indicate clusters of a k-means application with a search for two clusters. Obviously, k-means nicely differentiates between the cell and the non-cell components.
or Tayler approximation can be used to find ζ; we will use single and multilayer perceptrons as explained in the following sections.
B. Preprocessing Before we apply neural network learning, we preprocess the data as follows: Denote X the underlying n-dimensional random vector, from which the samples x have been drawn. In a first normalization step, we scale and translate X such that the two density maxima of X — corresponding to the gray background and the dark cell color — are mapped onto two fixed values. Subtracting the mean X 7→ X − E(X) then ensures that the data set is centered. In order to reduce dimension as well as to decorrelate the data in a first separation step, we apply principal component analysis (PCA), a second-order statistical method that linearly transforms a random vector X in order to decorrelate it and also reduce its dimension by projecting along the largest eigenvectors (principal axes) of the correlation matrix of X. We refer to [17] for more details. When analyzing the eigenvalue structure of the training set covariance, we note that by only taking the first 5 eigenvalues, projection along those first 5 principal axes still retains 95% of the data. Thus, the 400 dimensional data space is reduced to a whitened 5-dimensional data set. A visualization of the 120-samples data set is given in figure 5, here after projection to 3 dimensions. One can easily see that the cell and noncell components can be linearly separated — thus using a perceptron, see next section, can indeed already learn the cell classifier. Furthermore, a k-means clustering algorithm has been applied with k = 2 in order to find the two data clusters. Those directly correspond to the cell/non-cell components, see figure 5.
Supervised learning algorithms try to approximate a given function f : Rn → A ⊂ Rm by using a number of given sample-observation pairs (xλ , f (xλ )) ∈ Rn × A. If A is finite, we speak of a classification problem. Typical examples of supervised learning algorithms consist of polynomial or spline interpolation or artificial neural network (ANN) learning. In many practical situations, ANNs have the advantage of higher generalization capability than other approximation algorithms, especially when only few samples are available. For more detail about ANNs we refer to one of the many available textbooks, for instance [18]. We will restrict ourselves to feed-forward layered neural networks; furthermore, we found that simple single-layered neural networks (perceptrons) in comparison to multi-layered networks (MLP) already sufficed to learn the data set well — and they have the advantage of easier rule extraction and interpretation. In order to learn the cell classifier, we use a single-unit perceptron with linear activation function to get a measure for the certainty of cell/non-cell classification. Application of the delta-learning rule to the 5-dimensional data set from above gives excellent performance after already 4 epochs of batch learning. The final performance error (variance of perceptron estimation error of the training set) after 55 epochs was 0.0038 which confirms the good performance as well as the linearity of the classification problem. This was confirmed by training a two-layered network with 5 hidden neurons in order to test for nonlinearities in the data set. Indeed the MLP could not significantly enhance the result: after only 10 epochs, the classification error was already very small (10−4 ), and it could finally be diminished to 3 · 10−19 ; the latter however did not enhance classification noticeably. D. Independent component analysis In figure 5 we noted that clusters in the training set could easily be detected by k-means, which indicated that also unsupervised learning algorithms could produce a meaningful cell classifier. In this section we will confirm this by successful application of independent component analysis (ICA). In ICA, given an (observed) random vector, the goal is to find its statistically independent components. This can be used to solve the blind source separation (BSS) problem which is, given only the mixtures of some underlying independent sources, to separate the mixed signals thus recovering the original sources. In contrast to correlation-based transformations such as PCA, ICA renders the output signals as statistically independent as possible by evaluating higher-order statistics. The idea of ICA was first expressed by Jutten and H´erault [19] while the term ICA was later coined by Comon in [20]. In the calculations we used the well-known FastICA algorithm [17] by Hyv¨arinen and Oja, which separates the signals using negentropy and therefore non-gaussianity as a measure of the signal separation quality. Figure 6 gives a plot of the linearly separated signals together with the cell/non-cell function for comparison. The fifth component is highly correlated (cc = 0.9) with the
IEEE TRANSACTIONS ON IMAGE PROCESSING
5
5 0 1
−5 0 5
20
40
60
80
100
0.5
120
0 0
0
5 10
−5 0 5
20
40
60
80
100
15
120
20 25
0
30 35
−5 0 5
20
40
60
80
100
40
120
45 50
0
5
10
15
20
25
30
35
40
45
50
0 −5 0 2
(a) source image 20
40
60
80
100
Fig. 7. The plot shows the confidence map (b) generated with grid value γ = 5 from the source image (a).
0 −2 0 2
(b) confidence map
120
20
40
60
80
100
120
20
40
60
80
100
120
0 −2
0
Fig. 6. The 5 independent components of the data set calculated using FastICA with deflation and pow3-nonlinearity after whitening and PCAdimension reduction to 5 dimensions. Below the 5 components, the cell/noncell function (−1 or 1) of the samples is plotted for comparison. The cross-covariances of each signal with this functions are −0.055, 0.11, 0.37, −0.081, 0.90, and already visual comparison confirms good correspondence of the fifth IC with the cell/non-cell function.
desired output function, so instead of using a linear perceptron, projection along the direction of the fifth IC together with a sign function can be used in order to separate between cells and non-cells. This is quite interesting because in comparison to the supervised perceptron learning approach from above, the ICA is completely unsupervised. Only later when comparing the ICs we use the prior information of cells and non-cells in order to differentiate between the source components. The fact that the data set contains a cell/non-cell independent component was already indicated by the k-means cluster analysis from figure 5, where we saw that the data set clusters into the cell and non-cell components. VI. C ONFIDENCE MAP A. Generation The cell classifier from above only has to be trained once. Given such a cell classifier, section pictures can now be analyzed as follows: A pixelwise scan of the image yields an image patch with center location at the scan point; onto this image patch the cell classifier is then applied in order to give a probability determining whether a cell is located at the given position or not. This yields a probability distribution over the whole image which is called confidence map. Each point of the confidence map is a value in [0, 1] stating how probable it is that a cell is depicted at the specified location. In practice a pixelwise scan can be too expensive in terms of calculation time, so a grid value γ can be introduced, and the picture is scanned only every γ-th pixel. This yields a rasterization of the original confidence map, which for small γ can still be fine enough to detect cells. Figure 7 shows the rasterized confidence map of a section part. The maxima of
the confidence map correspond to the cell locations; small but non-zero values in the confidence map typically depict misclassifications that can be avoided by thresholding. B. Evaluation After the confidence map has been generated, it can be evaluated by simple maxima analysis. However as seen in figure 7, due to noise and non-cell objects in the images, maxima do not always correspond to cell positions, so thresholding in the confidence map has to be applied first. Values of 0.5 to 0.8 yield good results in experiments. Furthermore, the cell classifier yields high values corresponding to a single cell when applied to image patches with large overlap. Therefore after a maximum has been detected, adjacent points in the confidence map are also set to zero within a given radius (15 to 18 were good values for 20 × 20 image patches). Iterative application of this algorithm then gives the final cell positions and hence the image segmentation and the cell count. VII. R ELATION TO OTHER METHODS Although feature counting per se has not been studied very intensely, see e.g. [12], [13], it can of course be interpreted as a secondary problem in the larger field of image segmentation. Its goal is to decompose one or multiple images into its ‘natural’ parts, those being specified by similarities such as color, shape, texture or some higher level semantic meaning. Our problem of cell counting can then be solved by simply counting those image segments that represent cells — in the case of a perfect segmentation these should consist of all components except for the large background component (which itself could contain multiple segments). Common algorithms for image segmentation nowadays, apart from neural-network based approaches as the above, include segmentation using morphological operations or linear decomposition algorithms such as non-negative matrix factorization [21]. A very common technique belonging to the first category is the so-called watershed transform. Its intuitive idea can be visualized in geographical terms: in a landscape flooded by water, watersheds divide the domains of attraction of rain falling over the region. If image properties are measured by a single variable specified at each pixel, the watershed algorithm finds connected components belonging to
IEEE TRANSACTIONS ON IMAGE PROCESSING
separate local minima. This algorithm was first proposed by Digabel and Lantu´ejoul [22] and later improved by Beucher and Lantu´ejoul [23]. A nice up-to-date overview can for example be found in [24]. More elaborate frameworks and extensions have been proposed such as the combination of watershedding with region merging in a hierarchical structure [25] or graph-theoretic segmentation denoted as the n-cut method [26]. An application of the watershed transform to cell image segmentation and recognition is presented in [27], however the cell images are acquired from bone marrow smear, which substantially reduces background noise. Furthermore no focusing problems are involved hence all cells are of similar shape, texture and especially size. We have also considered the use of these more classical approaches to cell counting, but apart from some computational issues (and choice of thresholding parameters), the main disadvantage in contrast to the proposed algorithm can be seen in the example in figure 8. We compare ZANE with the two most common methods by applying the watershed transform both to the confidence map and to a distance map (containing distance values of pixels to cell boundaries given by a threshold). In both cases the result of course strongly depends on image preprocessing and thresholding to avoid too many local minima. Apart from some misclassified regions due to thresholding problems, watershedding of the confidence map partially separates cell clusters, but also introduces additional segments at intersections. If applied to the distance map, cell clusters could not at all be separated. We believe that this is due to the somewhat problematic conditions of image acquisition using a confocal light microscope, which cannot give as clear cell boundaries as other experimental settings such as [27]. ZANE resolves this problem by using the previously learned shapes; the better counting performance can be observed in figure 8(c). Finally the advantage of ZANE lies in the fact that after training, image analysis is basically performed by a combination of filtering (to generate the confidence map) and maxima analysis, which is enough for counting but not for segmentation — hence ZANE can be expected to outperform the above methods.
6
10
20 0.65
10
30 0.6 20
40
0.55 30 0.5
50
40
60
70
0.45
50
0.4
60
0.35 0.3
70
80
0.25 80 0.2
90 90
100 10
20
30
40
50
60
70
80
90
100
0.15
100 10
20
(a) original image
30
40
50
60
70
80
90
100
(b) confidence map
10
10
20
20
30
30
40
40
50
50
60
60
70
70
80
80
90
90
100
100
10
20
30
40
50
60
70
80
90
10
100
(c) ZANE result
20
30
40
50
60
70
80
90
100
(d) watershed segmentation 10 11
10
10
20
9
30
8
20
30
7
40
40
50
6 50
60 5
60 4
70
70 3 80
80
2
90 90
1
100
100 10
20
30
40
50
60
70
80
90
(e) distance map
100
10
20
30
40
50
60
70
80
90
100
(f) watershed segmentation of (e)
Fig. 8. Section image segmentation using watershed transform. Using the cell-classifier ζ an example 100×100 section image (a) is transformed to give the confidence map (b). For comparison the ZANE counting/cell localization result is presented in (c). Direct application of the watershed transform (after thresholding) yields (d), whereas distance map generation of the thresholded source image (e) gives a different watershed result (f).
VIII. R ESULTS A. Brain section image acquisition
B. ZANE counting
The analyzed brain sections were taken from the dentate gyrus of mice. BrdU given systemically is integrated into the dividing DNA instead of thymidine during the S-phase of the mitosis [28]. Using a specific antibody against BrdU labelled cells can be detected by an immunohistochemical staining procedure. The nuclei of labelled cells on 40µm thick brain sections appear in dark brown or black dense color. To determine the amount of BrdU-positive cells in the granular cell layer of the dentate gyrus they were counted on a light microscope (Olympus IX 70; Hamburg, Germany) with a 20× objective. Digital images with a resolution of 1600 × 1200 pixels were taken by a colorvideo camera adapted to the analySIS-software system (Soft Imaging System, Mu¨ nster, Germany).
When training the cell-classifier in practice, we use perceptron learning after preprocessing with PCA and also ICA in order to increase the performance of the learning algorithm with linearly separated data. Using prior knowledge about the size of cells and the zoom-factor of the images, the patch size is chosen to be 20 × 20. Optimal values for threshold and cut-out radius have been obtained using optimization on the training images. A thresholding of 0.8 is applied in the confidence map and the cut-out radius for cell detection in the confidence map is chosen to be 18 pixels. In figure 1, an automatically segmented picture is shown. Figure 9 presents the segmentation of the stitched image from figure 3. Good performance of the counting algorithm can be observed A more detailed analysis of the ZANE cell counting algo-
IEEE TRANSACTIONS ON IMAGE PROCESSING
7 350
ZANE manual+focus
300 250 200 150 100 50 0 epileptic mice
control group
Fig. 11. Number of cells in brain sections of a epileptic mouse versus number of cells of a mouse in a control group (counted both manually and using ZANE). Fig. 9. Automatically segmented image from figure 3. Here, the number of counted cell (marked using a black box) is 281. The expert counted 267 cells (focusing through the section).
350
ZANE manual+focus manual
300 manual (counted cells/image)
1
2
3
4
250 200 150 100 50
5 0
0
50
100
150
(a) Comparison of counting methods
0
50
100 150 200 250 ZANE (counted cells/image)
300
350
(b) ZANE vs. manual counting
Fig. 10. Comparison of ZANE counting performance versus manual counting using a microscope (and changing the focus plane) respectively only counting cells in the digital image within one mouse (a),and comparison of ZANE versus manual microscope-based counting within various mice (b).
rithm is shown in figure 10. In the first figure, five stitched brain sections of a single mouse are counted using ZANE and manual counting. For this note that manual counting can either be performed by using the digital image only or by directly using the microscope (this is usually done in experiments) — then the counting person can change the focus plane and hence detect and count cells that lie below or above the fixed focus plane of the digital image (in the digital image those cells are visible only as slightly darker shadows). Comparing mean manual counts using focusing versus ZANE, we get a standard deviation of ±8.6 cells, and comparing it against the counts from the digital images, we get a deviation of ±4.9 cells. In both cases the deviations are acceptable, taking into account that counts of two experts often vary by 5 to 10 cells or even more. When comparing the manually segmented the digital images with the ZANE segmentations of the four images 2–5 from figure 10(a), we get the following average confusion matrix ¶ µ 90% ± 3.8% 4.1% ± 2.6% . 9.9% ± 3.8% This means that in the average ZANE correctly labelled 90% of all (manually detected) cells, additionally labelled 4.1% of all cells, and forgot to label 9.9% of all cells. Figure 10(b) shows a comparison of ZANE versus manual counting with varying focus for a larger data set (from two mice). The slope
Fig. 12. ZANE front-end. A plugin for the Java image editor ImageJ has been developed. It loads a perceptron text file and applies the ZANE image segmentation algorithm to give a segmented section as well as the cell count.
of the fitted line is about 0.9, which implies a counting error of around 10%. Finally we want to test ZANE on images with different amounts of labelled cells and to give some neuro-biologically interesting results. We therefore analyze neurogenesis in the dentate gyrus of mice, and compared a control group of animals with mice that had been treated with pilocarpin to induce a status epilepticus. It is known that this condition raises the number of proliferating cells in the hippocampus one week after the treatment, which can be shown by an increase of BrdU-labelled cells [29], [30]. Our experiment confirms these findings by showing that proliferation of cells in the dentate gyrus is 340% stronger in the epileptic mouse than in the control group, see figure 11. A visual front-end has been developed in order to simplify the use of ZANE in the laboratory. It has been realized as plugin for the Java image editor ‘ImageJ’. An arbitrary cell classifier can be specified by a text file. Then the ZANE image segmentation algorithm is applied to calculate a segmented section and the cell count. A screenshot is shown in figure 12. The software is freely available for download at http://homepages.uni-regensburg.de/ ∼thf11669/researchzane.html.
IEEE TRANSACTIONS ON IMAGE PROCESSING
IX. F URTHER APPLICATIONS The advantage of the presented method lies in the fact that it can be readily extended to the detection, localization and identification of other kinds of cells in microscopic images. For example images marked by multiple markers such as NeuN and BrdU allow the differentiation between different types of cells. By adapting the cell classifier we can identify the desired type of cell only, and multiple cell classifiers can then identify the various cell classes. In order to improve performance however, additional criteria from traditional image processing such as area, brightness etc. will have to be added in the neural network for classification. Another extension we are currently working on discusses the rotational symmetry of the classified cell images. In order to avoid too high symmetries a simple approach is to first orient the images along their main axis, detected for instance using the first principal component. This enables us to classify highly non-symmetric shapes. Applications are the detection of higher-order structures such as axon-dendrite networks of the neurons. X. C ONCLUSION We have presented a framework for brain section image segmentation and analysis. The feature detector, here cell classifier, was first trained onto a given sample set using neural networks or ICA. This detector was then applied onto the image to get a confidence map and maxima analysis yields the cell locations. Experiments show good performance of the classifier, and larger tests will have to be performed. In future work, the scanning performance could be increased for example by using some kind of hierarchical neural network like a cellular neural network, see [12]. Furthermore, in typical brain section images, some cells not directly lying in the focus plane occur in a blurred fashion. In order to count those without counting them twice in two section images with different focus planes, a three-dimensional cell classifier can be trained for fixed focus plane distances. A different approach for accounting for non-focused cells is to simply allow ‘overcounting’, and then to reduce doubles in the segmented images according to location. This seems suitable given the fact that cells do not vary greatly in size. We also plan on automating the ROI-selection in the future by classifying separating features of these regions. R EFERENCES [1] F. Theis, Z. Kohl, H. Kuhn, H. Stockmeier, and E. Lang, “Automated counting of labelled cells in rodent brain section images,” in Proc. BioMED 2004. Innsbruck, Austria: ACTA Press, Canada, 2004, pp. 209–212. [2] J. Altman and G. Das, “Autoradiographic and histological evidence of postnatal hippocampal neurogenesis in rats,” J. Comp. Neurol., vol. 124, no. 3, pp. 319–335, 1965. [3] S. Goldman and F. Nottebohm, “Neuronal production, migration, and differentiation in a vocal control nucleus of the adult female canary brain,” Proc. Natl. Acad. Sci. USA, vol. 80, no. 8, pp. 2390–2394, 1983. [4] A. Barnea and F. Nottebohm, “Seasonal recruitment of hippocampal neurons in adult free-ranging black-capped chickadees,” Proc. Natl. Acad. Sci. USA, vol. 91, no. 23, pp. 11 217–11 221, 1994. [5] H. Cameron, C. Woolley, B. McEwen, and E. Gould, “Differentiation of newly born neurons and glia in the dentate gyrus of the adult rat,” Neuroscience, vol. 56, no. 2, pp. 336–344, 1993.
8
[6] H. Kuhn, H. Dickinson-Anson, and F. Gage, “Neurogenesis in the dentate gyrus of the adult rat: age-related decrease of neuronal progenitor proliferation,” J. Neurosci., vol. 16, no. 6, pp. 2027–2033, 1996. [7] P. Eriksson, E. Perfilieva, T. Bjork-Eriksson, A. Alborn, C. Nordborg, D. Peterson, and F. Gage, “Neurogenesis in the adult human hippocampus,” Nat. Med., vol. 4, no. 11, pp. 1313–1317, 1998. [8] E. Gould and P. T. et al., “Proliferation of granule cell precursors in the dentate gyrus of adult monkeys is diminished by stress,” Proc. Natl. Acad. Sci. USA, vol. 95, no. 6, pp. 3168–3171, 1998. [9] H. van Praag, A. Schinder, B. Christie, N. Toni, T. Palmer, and F. Gage, “Functional neurogenesis in the adult hippocampus,” Nature, vol. 415, no. 6875, pp. 1030–1034, 2002. [10] H. Kuhn, T. Palmer, and E. Fuchs, “Adult neurogenesis: a compensatory mechanism for neuronal damage,” Eur. Arch. Psychiatry Clin. Neurosci., vol. 251, no. 4, pp. 152–158, 2001. [11] G. Kempermann, H. Kuhn, and F. Gage, “More hippocampal neurons in adult mice living in an enriched environment,” Nature, vol. 386, no. 6624, pp. 493–495, 1997. [12] T. Nattkemper, H. Ritter, and W. Schubert, “A neural classifier enabling high-throughput topological analysis of lymphocytes in tissue sections,” IEEE Trans. ITB, vol. 5, pp. 138–149, 2001. [13] T. Nattkemper, T. Twellmanna, H. Ritter, and W. Schubert, “Human vs. machine: evaluation of fluorescence micrographs,” Computers in Biology and Medicine, vol. 33, pp. 31–43, 2003. [14] M. Goodrich, J. Mitchell, and M. Orletsky, “Approximate geometric pattern matching under rigid motions,” IEEE Transactions on Pattern Analysis and Machine Intelligence, vol. 21, no. 4, pp. 371–379, 1999. [Online]. Available: citeseer.nj.nec.com/goodrich94approximate.html [15] M. Capek, R. Wegenkittl, and P. Felkel, “A fully automatic stitching of 2d medical datasets,” in BIOSIGNAL 2002, The 16th international EURASIP conference, J. Jan, J. Kozumplik, and I. Provaznik, Eds., vol. 16, Brno, Czech Republic, 2002, pp. 326–328. [16] A. Levin, A. Zomet, S. Peleg, and Y. Weiss, “Seamless image stitching in the gradient domain,” Leibniz Center, Hebrew University, Jerusalem, Israel, Tech. Rep. 2003-82, 2003. [17] A. Hyv¨arinen, J. Karhunen, and E. Oja, “Independent component analysis,” John Wiley & Sons, 2001. [18] S. Haykin, “Neural networks,” Macmillan College Publishing Company, 1994. [19] J. H´erault and C. Jutten, “Space or time adaptive signal processing by neural network models,” in Neural Networks for Computing. Proceedings of the AIP Conference, J. Denker, Ed. New York: American Institute of Physics, 1986, pp. 206–211. [20] P. Comon, “Independent component analysis - a new concept?” Signal Processing, vol. 36, pp. 287–314, 1994. [21] D. Lee and H. Seung, “Learning the parts of objects by non-negative matrix factorization,” Nature, vol. 40, pp. 788–791, 1999. [22] H. Digabel and C. Lantu´ejoul, “Iterative algorithms,” in Actes du Second Symposium Europ´een d’Analyse Quantitative des Microstructures en Sciences des Mat´eriaux, Biologie et M´edecine. Caen, France: Riederer Verlag, Stuttgart, 1977, pp. 85–99. [23] S. Beucher and C. Lantu´ejoul, “Use of watersheds in contour detection,” in International Workshop on Image Processing, Real-Time Edge and Motion Detection/Estimation, Rennes, France, 1979. [24] J. Roerdink and A. Meijster, “The watershed transform: Definitions, algorithms and parallelization strategies,” Fundamenta Informaticae, vol. 41, no. 1, pp. 187–228, 2001. [25] N. M. K. Haris, S. N. Efstratiadis and A. Katsaggelos, “Hybrid image segmentation using watershed and fast region merging,” IEEE Trans. Img. Proc., vol. 7, no. 12, pp. 1684–1699, 1998. [26] J. Shi and J. Malik, “Normalized cuts and image segmentation,” IEEE Trans. Pattern Anal. Machine Intell., vol. 22, no. 8, pp. 888–905, 2000. [27] S. Osowski, T. Markiewicz, B. Marianska, and L. Moszczyn˜ ski, “Feature generation for the cell image recognition of myelogenous leukemia,” in Proc. EUSICPO 2004, Vienna, Austria, 2004, pp. 753–756. [28] F. Dolbeare, “Bromodeoxyuridine: a diagnostic tool in biology and medicine, part i: Historical perspectives, histochemical methods and cell kinetics,” Histochem. J., vol. 27, no. 5, pp. 339–369, 1995. [29] J. Bengzon, Z. Kokaia, E. Elmer, A. Nanobashvili, M. Kokaia, and O. Lindvall, “Apoptosis and proliferation of dentate gyrus neurons after single and intermittent limbic seizures,” Proc. Natl. Acad. Sci. USA, vol. 94, pp. 10 432–10 437, 1997. [30] J. Parent, T. Yu, R. Leibowitz, D. Geschwind, R. Sloviter, and D. Lowenstein, “Dentate granule cell neurogenesis is increased by seizures and contributes to aberrant network reorganization in the adult rat hippocampus,” J. Neursci., vol. 17, pp. 3727–3738, 1997.