Automated Methods for Measuring DBH and Tree Heights with a Commercial Scanning Lidar Huabing Huang, Zhan Li, Peng Gong, Xiao Cheng, Nick Clinton, Chunxiang Cao, Wenjian Ni, and Lei Wang
Abstract
Introduction
Accurate forest structural parameters are crucial to forest inventory, and modeling of the carbon cycle and wildlife habitat. Lidar (Light Detection and Ranging) is particularly suitable to the measurement of forest structural parameters. In this paper, we describe a pilot study to extract forest structural parameters, such as tree height, diameter at breast height (DBH), and position of individual tree using a terrestrial lidar (LMS-Z360i; Riegel, Inc.). The lidar was operated to acquire both vertical and horizontal scanning in the field in order to obtain a point cloud of the whole scene. An Iterative Closet Point (ICP) algorithm was introduced to obtain the transformation matrix of each range image and to mosaic multiple range images together. Based on the mosaiced data set, a variable scale and threshold filtering method was used to separate ground from the vegetation. Meanwhile, a Digital Elevation Model (DEM) and a Canopy Height Model (CHM) were generated from the classified point cloud. A stem detection algorithm was used to extract the location of individual trees. A slice above 1.3 m from the ground was extracted and rasterized. A circle fitting algorithm combined with the Hough transform was used to retrieve the DBH based on the rasterized grid. Tree heights were calculated using the height difference between the minimum and maximum Z values within the position of each individual tree with a 1 m buffer. All of the 26 trees were detected correctly, tree height and DBH were determined with a precision of 0.76 m and 3.4 cm, respectively, comparing with those visually measured in the lidar data. Our methods and results confirm that terrestrial lidar can provide nondestructive, high-resolution, and automatic determination of parameters required in forest inventory.
Forest structural parameters, such as tree height, crown closure, and diameter at breast height (DBH) are essential data in forest inventory, and they are critical information to studies on the biomass, biogeochemical cycles, ecological functioning, exchange between mass and energy, water budgets, and radiation transfer in a forest ecosystem (García et al., 2010; Pu and Gong, 2004; Sheng et al., 2001; Solberg et al., 2009). Accurate forest inventory data that are crucial to forest resource management and wildlife habitat assessment are usually obtained from field survey and aerial photogrammetry (Gong et al., 1999; Gong et al., 2002). Since the advent of airborne laser scanners, several studies have been published, with varying degrees of success, on forest structural parameter extraction using airborne lidar data (Chen et al., 2006; Chen et al., 2007; Huang et al., 2009; Nelson, 1988; Nelson et al., 2007). Generally, there are two different methods to extract forest forestry structural parameters, named CHM-based and pointbased “distributional” approaches (Wynne, 2006). The accuracy of forest structural parameters depends on the level of details and accuracy of a canopy height model (CHM) when using the CHM-based method (Hyyppä et al., 2008). In fact, the CHM retrieved from airborne lidar is interpolated from discrete point clouds (Reitberger et al., 2008). Typically, the precision and accuracy of individual tree detection, tree height, and crown width is limited due to unavoidable smoothing effects of the interpolated surface and other additional factors, such as pulse density of lidar sensor and structural properties of the forest (Falkowski et al., 2008; Maltamo et al., 2004; Solberg et al., 2006). Terrestrial lidar with higher point cloud density can provide detailed 3D information on individual trees (Aschoff and Spiecker, 2004). Automatic data processing techniques are needed for extracting individual tree position, tree height, and DBH from lidar data (Maas et al., 2008). Many studies employing terrestrial lidar for forest parameter extraction have been reported. Some exploratory studies have been carried out to extract individual tree parameters or plot-level characters from multiple lidar scans. At the individual tree level, forest parameters were measured from five lidar scans based on a commercial software and visual analysis of the data, and the results were then compared against field measured data (Hopkinson et al., 2004). Multiscans data were also used through visual analysis to measure individual tree positions, DBH, and distribution of plant
Huabing Huang, Zhan Li, Nick Clinton, Chunxiang Cao, Wenjian Ni, and Lei Wang are with the State Key Laboratory of Remote Sensing Science, Jointly Sponsored by the Institute of Remote Sensing Applications of Chinese Academy of Sciences and Beijing Normal University, Beijing, 100101, China. Peng Gong is with the State Key Laboratory of Remote Sensing Science, Jointly Sponsored by the Institute of Remote Sensing Applications of Chinese Academy of Sciences and Beijing Normal University, Beijing, 100101, China, and the Division of Ecosystem Science, University of California, Berkeley, CA (
[email protected]). Xiao Cheng is with the State Key Laboratory of Remote Sensing Science, Jointly Sponsored by the Institute of Remote Sensing Applications of Chinese Academy of Sciences and Beijing Normal University, Beijing, 100101, China, and the College of Global Change and Earth System Science, Beijing Normal University, Beijing, 100101, China. PHOTOGRAMMETRIC ENGINEERING & REMOTE SENSING
Photogrammetric Engineering & Remote Sensing Vol. 77, No. 3, March 2011, pp. 219–227. 0099-1112/11/7703–0219/$3.00/0 © 2011 American Society for Photogrammetry and Remote Sensing March 2011
219
area index (PAI) and leaf area index (LAI) (Henning and Radtke, 2006). Other studies were devoted to develop automatic methods for tree position and DBH measurements. A 2D Hough transform was introduced to detect individual trees, and a circle approximation was used to determine DBH (Simonse et al., 2003). A point cluster search algorithm was used to detect trees based on an analysis of point density with a reliability factor introduced to eliminate over- and underestimated stem diameters (Bienert et al., 2006). Furthermore, a crescent moon method was developed to model tree stem and tree height based on a digital surface model (Kiraly and Brolly, 2007). Meanwhile, mathematical morphology and connectivity analysis were introduced to reconstruct individual skeletons in 3D voxel space (Gorte and Pfeifer, 2004). Recently, a single-scan mode for achieving plot level data using terrestrial lidar was proposed, and a trunk detection algorithm with noise elimination was developed to reduce the data processing time (Litkey et al., 2008). However, none of the above mentioned studies deals with multi-parameter extraction with automatic methods using multiple scans. An integrated approach that can automatically locate the position, extract the height and DBH of individual trees from multiple scans ground lidar data is highly desirable. In this paper, we develop an automatic method to detect and separate individual trees and calculate tree position, tree height, and DBH, and evaluate the quality and accuracy of this method based on terrestrial lidar data.
Methods Study Area The study area was selected in Culai Mountain National Forest in Shandong Province of China (117°16⬘ to 117°20⬘E, 36°02⬘ to 36°17⬘N). This site is approximately 7,164 hectares and covers nine different forest management units (Figure 1). A subset area (200 m ⫻ 40 m) in Taipingding was chosen to acquire lidar data, due to the relative flat terrain. The central position was about 117°18' 35.71"E, 36°01' 59.99"N. Major tree species in this subset are hardwood (Quercus liaotungensis and Robinia pseudoacacia L), and the understory vegetation is sparse weeds less than 30 cm in height.
Terrestrial Lidar Data Terrestrial lidar data were collected using a Riegl LMS360i with a data acquisition rate of 24,000 HZ. The scanner measures the distance based on time-of-fight measurement with a 360° horizontal scanning range and 90° vertical scanning range. The laser source is a Class I product, works in the near infrared wavelength, and has a range from 1 m to 200 m. The beam divergence is 0.25mrad. (http://www.riegl.com/nc/products/terrestrial-scanning/). The data were acquired in 15-19 October 2007. Multiple scans were chosen to acquire a large area of forest scene. The distance between each station was about 10 m. Vertical and tilted with 90° scans were combined to obtain the complete vertical information of the forest. The tilted scan was done three times with a 60° angular interval to achieve a complete circular scan at each station. A typical scene of 2.7 ⫻ 106 to 3.2 ⫻ 106 laser points with a 0.1° resolution can be acquired in 5 to 6 min. Figure 2 shows the position distribution of the lidar scanner; 16 scans were acquired in the deciduous forest. The geographic position of the scanner and azimuth were recorded by differential GPS and a compass to ensure that all scans could be aligned. Multi-scan Registration and Terrain Reduction A two-step registration procedure was carried out to align data from all scans. First, scan data from three different azimuth angles were adjusted to the vertical scan to finish alignment within each scan station. This procedure was named in-station registration (Figure 3a and 3c). Second, the adjacent in-station scan was aligned based on overlapping scan areas. This procedure was named between-station registration (Figure 3d). Data from all scans were aligned by this two-step registration procedure. Control points from common stems and branches visible in overlapping scans were manually selected by visual analysis. Alignment of data from all scans was carried out using the multi-stationadjustment module within the RiSCAN PRO software (http://www.riegl.com/download/). In order to calculate the height above ground for each lidar return, laser points need to be filtered before individual tree measurements can be done. The processing of the surface models was done based on data from all scans using a method developed in Huang et al., (2009). First, a grid was
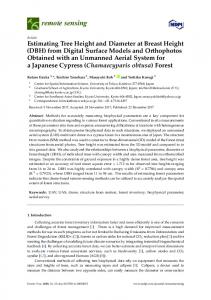
Figure 1. Location of Culai Mountain in Shandong Province, China.
220
March 2011
PHOTOGRAMMETRIC ENGINEERING & REMOTE SENSING
Figure 2. Distribution of the ground lidar scanner measurement station.
created to record the absolute minimum height within a cell, and the first triangulated irregular network (TIN) was created with those selected minimum heights. Then the distance between the remaining point clouds with the first coarse TIN was calculated and compared with an initialization threshold. A laser point would be determined as terrain when the distance is lower than the initialization threshold. An iterative procedure was used with different grid and initialization thresholds as presented in Huang et al., (2009) to accomplish terrain subtraction. Individual Tree Stem Detection and Classification The individual tree stem detection process is based on 3D voxel histogram techniques (Lefsky et al., 1999; Popescu and Zhao, 2008). A 3D voxel with a predefined horizontal grid and vertical thickness was introduced and points falling inside each voxel were recorded. Each voxel was labeled 1 if there is at least one point in the voxel and 0 if there is no point in the voxel. The values of each vertical column were evaluated and only the vertical column whose voxels are all coded by 1 was selected as a laser point from a stem. A range from minimum Z value to 20 percent of the maximum Z (0.2 ⫻ Zmax) was considered as a vertical column for evaluation in order to reduce influence of the branches and leaves. A clustering algorithm based on Euclidean distance was used to classify individual tree stems. Two laser points would be clustered into one tree stem when the distance between these two points is shorter than a predefined threshold (typically 1 m). All laser points from individual tree stems processed by the 3D voxel histogram techniques were iteratively calculated. Determination of Individual Tree Location, Tree Height, and DBH Two methods were used for DBH determination. The first method uses a circle fitting algorithm directly. A horizontal slice was intercepted 1.3 m above the minimum base height PHOTOGRAMMETRIC ENGINEERING & REMOTE SENSING
Figure 3. Flowchart of the two-step registration: (a) vertical scan, (b) horizontal scan with different azimuth angle, (c) results after in-station registration, and (d) results after between-station registration.
(Z0) of each classified tree with a predefined 10 cm thickness. A circle fitting algorithm was introduced to determinate the diameter and center of a circle using the points included in each slice (Henning and Radtke, 2006). In order to reduce points that come from branch and other tree stem surfaces, mean and standard deviation of the points along the X scan direction was calculated. Points that were 3 standard deviations away from the mean were excluded (Figure 4). A 2D grid for each slice with a predefined cell size of 3 cm was created. Point numbers included in each grid was calculated and those having less than a predefined threshold (typically 5 points) were not used for circle fitting. The center and diameter of the fitted circle were deemed to estimate individual tree position and DBH, respectively. The second method uses circle fitting combined with the Hough transform, which is a feature extraction technique to find imperfect instances of objects within a certain class of shapes by a voting procedure (Ioannou et al., 1999). Similarly, a horizontal slice was taken from the point cloud 1.25 to 1.35m above the minimum base height (Z0) and March 2011
221
Figure 4. Illustration of point removal: (a) all points in a section, and (b) point removal using mean and standard deviation.
rasterized. Details in this process were described as following (Figure 5) and a flowchart was also shown in Figure 6. 1. A least-squares method was used for circle fitting and the result was deemed as initial fitted circle center O(Xls,0,Yls,0) and radius (Rls,0). Other initial values are set as following: a. initial iteration count: k = 1, b. initial center and radius of the detected circle by Hough transform:
O(XHt,0,YHt,0) ⫽ O(Xls,0,Yls,0) and RHt,0 ⫽ ⫹ q respectively, c. sD,0 ⫽ 0 (its meaning is given in Step 3). 2. Hough transform was introduced to detect a circle in the image of rasterized point cloud using pixels within a circle with its center and radius being O(XHt,k⫺1,YHt,k⫺1) and RHt,k⫺1 ⫹ sD,k⫺1. The center and radius of the new circle detected by the Hough transform are denoted as O(XHt,k,YHt,k) and RHt,k, respectively. 3. The distance (DHt) between each pixel used in the Hough transform and the center O(XHt,k,YHt,k) was calculated and the standard deviation of the distances was denoted as sD,k. 4. The least square method was used to fit a circle using points with distance from O(XHt,k,YHt,k) in the range from RHt,k ⫺ sD,k to RHt,k ⫹ sD,k (Figure 5d). The center and radius of the newly fitted circle were denoted as O(Xls,k,Yls,k) and Rls,k. 5. The difference between Rls,k⫺1 and Rls,k and the distance between O(Xls,k⫺1,Yls,k⫺1) and O(Xls,k,Yls,k) were calculated. The center (O(Xls,k,Yls,k)) and radius (Rls,k) of the fitted circle were deemed to estimate individual tree position and DBH, respectively, if the difference and distance were less than 0.01 m. If not, increase k by 1, go back and repeat Step 2 to Step 5 until the difference and distance were less than 0.01m or k reached the maximum count (100 was chosen in our study).
A range within the position of an individual tree with a buffer of 1 m was used to choose laser points for tree height determination. The minimum and maximum Z values were calculated and their difference was deemed to the tree height. Reference Data As shown in previous research, the positioning precision under forest canopies is no better than 2 m even using a differential global positioning system (DGPS) (Sawaguchi et
222
March 2011
al., 2003). In order to overcome the inaccuracy in GPS positioning, reference data were developed by visual inspection based on the scan data, as did in Hopkinson et al. (2004) and Henning and Radtke (2006). First, individual trees were isolated and identified based on the assumption that each tree stem would be represented by a distinct arc or enclosed circle when viewed from the bottom. The stem distance was measured between adjacent tree stems, and the minimum distance was chosen as buffer range combined with the stem center to segment individual trees. Second, an arc (1.3 m above the ground) was chosen, and its diameter was measured from two orthogonal directions. The center of the chosen arc was deemed as the position of an individual tree. Finally, the maximum and minimum value along Z direction was calculated as tree height based on each isolated individual tree. All these visual inspection and measurement were done in the RiSCAN PRO software with a processing license.
Results Four sets of scan data named 6, 7, 10, and 11 in Figure 2 were chosen and aligned, because they were located in the middle of the whole scene and can cover most trees. Plate 1 shows the registration results. Each scan was illustrated with a particular color. Different side-surfaces from the same tree match well. In order to assess the matching accuracy, 552 point pairs were selected randomly, and the mean and variance computed from the point pairs is 0.6 cm and 0.73 cm, respectively, indicating an acceptable match. The whole scan scene (35 m ⫻ 35 m) mosaic is shown in Plate 2a after terrain subtraction from the corresponding DEM as shown in Plate 2b. Figure 7 shows the individual tree position automatically determined with two different methods and their comparison with tree locations visually interpreted. The 26 trees in the whole scan were manually identified by visual analysis. The comparison shows that all 26 trees have been identified by the circle fitting and the circle fitting combined with the Hough transform techniques. The algorithm determined position of each tree was paired with the corresponding visually interpreted tree position. 24 trees have algorithm determined tree position falling within half a DBH of the manually determined location, and two trees do not, when using the circle fitting algorithm. All trees identified PHOTOGRAMMETRIC ENGINEERING & REMOTE SENSING
Figure 5. DBH determination using circle fitting combined with Hough transform: (a) cross-section of 10 cm slice, (b) point rasterization, (c) noise removal and range determination using Hough transform, and (d) final circle after noise removal using the least-squares method.
by the circle fitting combined with the Hough transform fall within half a DBH of their manually determined locations. In order to assess the quality of DBH and tree height determination, a Pearson’s correlation analysis (R), RMSE and mean residual (MR; Equation 1) were performed to calculate the degree of correlation between predicted DBH with those determined with the two different methods and tree height with those manually found by visual analysis: MR ⫽ mean(Yj ⫺ Yi)
(1)
where Yj is the measurement from the lidar data, andYi is the manual measurement in lidar data. The results are listed in Table 1, Figure 8, and Figure 9. PHOTOGRAMMETRIC ENGINEERING & REMOTE SENSING
Lidar-derived DBH and direct manual measurements were highly correlated (r = 0.89). The RMSE are 3.74 cm and 3.40 cm for circle fitting algorithm (DBH1) and circle fitting combined with Hough transform (DBH2), respectively. The MR is ⫺1.17 cm and ⫺2.18 cm, respectively. Most DBHs measured from the lidar data are smaller than the ones manually measured in the lidar data. Comparing Figure 8 and Figure 9, we can see that the three DBH values that are far away from the one to one line in Figure 8 are relatively closer to the one to one line in Figure 9. This difference indicates that the circle fitting algorithm may cause a diameter underestimation when the surface laser point is sparse. Comparing MRs of the two different DBH determination methods, we can see that the circle fitting combined with Hough transform might cause March 2011
223
Figure 6. Flowchart of DBH determination using circle fitting combined with Hough transform.
slightly lower DBH estimation in general due to its rigorous noise removal. Although both methods underestimate DBHs by a certain amount, systematic correction should be possible by adding a bias to the lidar based measurements. The comparison of automatically extracted tree heights and their manual measurement counterparts is shown in Figure 10 and the correlation coefficient is listed in Table 1. The correlation coefficient, RMSE and MR are 0.95, 0.76 m, and ⫺0.26 m, respectively. These error levels are well below even manual measurement errors, and therefore they are quite acceptable. The correlation for tree height is greater than that of DBH. As the scatterplot shown in Figure 10, most extracted tree height is close to the one to one line. The tree height extracted automatically is slightly lower than those measured manually in lidar data (⫺0.26 m).
Discussion and Conclusions Airborne lidar can provide larger area coverage and be used widely for forest inventory, but the DBH from airborne lidar scanning is typically derived from empirical relationship with canopy height and crown width. Ground-based lidar can directly measure stem diameter, so it provides complementary sources of information to airborne lidar scanning. Therefore, 224
March 2011
forest structural parameters extracted using terrestrial lidar data can be regarded as a new field measurement technique for validation and forest management purposes. In this paper, we described a series of methods. First, algorithms for multi-scan data acquisition, multi-scan alignment, and terrain removal have been developed. Second, algorithms for individual tree stem detection and classification based on 3D voxel histogram techniques have led to acceptable results; all 26 trees were identified, indicating that the methods are effective. This method is suitable for individual trees detection in a relatively simple forest. More factors should be considered when the topography and forest structure is complex. Both branches and leaves could more easily block or reduce the level of energy in lidar pulses in a forest with more complex structure. Third, a circle fitting method and circle fitting combined with Hough transform method can both produce DBH measurements for individual trees with certain amount of underestimation of the actual DBH. The differences were 1.74 cm and 2.18 cm, respectively (Table 1), when comparing two automatic methods with the visual measurement. The underestimation using these automatic methods may be attributed to the assumption that stems could be approximately considered as a circle. In fact, most stems are not circular. An ellipse fitting PHOTOGRAMMETRIC ENGINEERING & REMOTE SENSING
Plate 1. Registration of scan data from four different positions of measurement stations shown with different color (Bright Green for station 6, Yellow for station 7, Fuchsia for station 10, and Orange for station 11).
Plate 2. The complete lidar scan data after (a) terrain reduction, and (b) corresponding DEM.
algorithm and its major/minor axis may be adopted as measures for DBH. Number and quality of points extracted from a slice above 1.3 m could cause the underestimation of DBH. The more points from stem surface could be recorded the closer the stem away from lidar scanner position. In our lidar scanner data, the scanning center in which the laser beams emitted is about 1.5 m above the ground with a 1.2 m tripod. So the points reflected from stem surface 1.35 m above ground were more than those points reflected from stem surface 1.25 m above ground. Generally, the stem 1.35 m high is thinner than that at 1.25 m high. This 10 cm PHOTOGRAMMETRIC ENGINEERING & REMOTE SENSING
thickness slice with uniform points would be another factor causing underestimation of DBH. This similar result was reported in Henning and Radtke (2006). However, there was no systematic tendency for terrestrial lidar to either under- or overestimate DBH according to Hopkinson et al., (2004). Fourth, tree heights determined with terrestrial lidar data are accurate enough when compared to manual measurement methods in lidar data (–0.26 m). This result is in agreement with the expected underestimation of tree height when using terrestrial lidar. It can be attributed to the low sample point density in the upper canopy. It is difficult to capture the March 2011
225
Figure 7. Comparison of tree position between the automatic and manual methods (Method 1 for circle fitting, Method 2 for circle fitting combined with Hough transform).
Figure 9. Scatter plot between automatically determined DBH using circle fitting combined with Hough transform and those measured manually.
TABLE 1. COMPARISON BETWEEN DBH AND TREE HEIGHTS BETWEEN MANUALLY MEASURED AND AUTOMATICALLY DETERMINED FROM LIDAR DATA Correlation coefficient
RMSE
0.89 0.89 0.95
3.74(cm) 3.40(cm) 0.76(m)
DBH1 DBH2 Tree height
Mean Residual ⫺1.17(cm) ⫺2.18(cm) ⫺0.26(m)
Mean* 22.87(cm) 21.86(cm) 11.00(m)
*: mean of those derived from automatic methods
Figure 10. Scatter plot between tree heights determined automatically and those measured manually.
Figure 8. Scatter plot between automatically determined DBH using circle fitting and those measured manually.
226
March 2011
treetop due to the occlusion caused by the lower canopy. This phenomenon was also observed in Hopkinson et al. (2004). The acquisition scheme should be improved to include more points reflected from upper canopy and treetop. A multiple and distant scan mode with increased vertical scan angle would improve the lidar data acquisition. A correlation coefficient of 0.95 for tree heights between the automatic and visual methods with lidar data is considered high enough indicating that the automatic algorithm for tree height determination is feasible and effective. If tree top returns can be acquired by future lidar measurement through better field sampling design or using a lidar with improved PHOTOGRAMMETRIC ENGINEERING & REMOTE SENSING
level of energy of its laser pulses, the automatic algorithm can be used to produce more accurate tree height measurements. As field estimation of tree heights can be difficult and notoriously inaccurate, tree height measured using terrestrial lidar has great potential to supersede field-based tree height measurement, especially for leaf-off forests. A previous study demonstrated that high density terrestrial lidar to be superior to hypsometric measurements (Litkey et al., 2008). From our results, we conclude that terrestrial lidar combined with automatic processing algorithms such as those studied in this research can provide accurate individual tree structural parameters. Although, data acquisition and collection using terrestrial lidar in forest is not quite satisfactory due to the limitation in scanning speed, mass weight (13 kg for the Riegl LMS-360i) and view angle (90°in vertical direction), it could be used as a validation tool for forest structural parameter extraction from airborne lidar and other remote sensing technologies as the development of lidar apparatus continues to improve.
Acknowledgments This research was funded by an NSFC (40901235), the National High Technology Research and Development Program of China (2008AA121702), and the Key Laboratory of Mapping from Space of State Bureau of Surveying and Mapping (2009-16).
References Aschoff, T., and H. Spiecker, 2004. Algorithms for the automatic detection of trees in laser scanner data, International Archives of Photogrammetry, Remote Sensing and Spatial Information Sciences, pp. 66-70. Bienert, A., S. Scheller, E. Keane, G. Mullooly, and F. Mohan, 2006. Application of terrestrial laser scanners for the determination of forest inventory parametrs, International Archives of Photogrammetry, Remote Sensing and Spatial Information Sciences, pp. Part 5. Chen, Q., D. Baldocchi, P. Gong, and M. Kelly, 2006. Isolating individual trees in a Savanna woodland using small footprint lidar data, Photogrammetric Engineering & Remote Sensing, 72(8):923-932. Chen, Q., P. Gong, D. Baldocchi, and Y.Q. Tian, 2007. Estimating basal area and stem volume for individual trees from lidar data, Photogrammetric Engineering & Remote Sensing, 73(12):1355-1365. Falkowski, M.J., A.M.S. Smith, P.E. Gessler, A.T. Hudak, L.A. Vierling, and J.S. Evans, 2008. The influence of conifer forest canopy cover on the accuracy of two individual tree measurement algorithms using lidar data, Canadian Journal of Remote Sensing, 34(2):S338-S350. García, M., D. Riaño, E. Chuvieco, and F.M. Danson, 2010. Estimating biomass carbon stocks for a Mediterranean forest in central Spain using LiDAR height and intensity data, Remote Sensing of Environment, 114(4):816-830. Gong, P., G.S. Biging, S.M. Lee, X. Mei, Y. Sheng, R. Pu, B. Xu, and K.-P. Schwarz., 1999. Photo-ecometrics for forest inventory, Geographic Information Sciences, 5(1):9-14. Gong, P., Y. Sheng, and G.S. Blging, 2002. 3D model-based tree measurement from high resolution aerial imagery, Photogrammetric Engineering & Remote Sensing, 68(11):1203-1212. Gorte, B., and N. Pfeifer, 2004. Structuring laser-scanned trees using 3D mathematical morphology, International Archives of Photogrammetry and Remote Sensing, Istanbul, Turkey, pp. 929-933. Henning, J.G., and P.J. Radtke, 2006. Ground-based laser imaging for assessing three-dimensional forest canopy structure, Photogrammetric Engineering & Remote Sensing, 72(12):1349-1358. Hopkinson, C., L. Chasmer, C. Young-Pow, and P. Treitz, 2004. Assessing forest metrics with a ground-based scanning lidar, Candian Journal of Forest Research, 34(3):573-583. PHOTOGRAMMETRIC ENGINEERING & REMOTE SENSING
Huang, H., P. Gong, X. Cheng, N. Clinton, and Z. Li, 2009. Improving measurement of forest structural parameters by co-registering of high resolution aerial imagery and low density LiDAR data, Sensors, 9(3):1541-1558. Hyyppä, J., H. Hyyppä, D. Leckie, F. Gougeon, X. Yu, and M. Maltamo, 2008. Review of methods of small-footprint airborne laser scanning for extracting forest inventory data in boreal forests, International Journal of Remote Sensing, 29(5):1339-1366. Ioannou, D., W. Huda, and A.F. Laine, 1999. Circle recognition through a 2D Hough Transform and radius histogramming, Image and Vision Computing, 17(1):15-26. Kiraly, G., and G. Brolly, 2007. Tree height estimation methods for terrestrial laser scanning in a forest reserve, ISPRS Workshop on Laser Scanning - Silvilaser 2007, Espoo,Finland, pp. 211-215. Lefsky, M.A., W.B. Cohen, S.A. Acker, G.G. Parker, T.A. Spies, and D. Harding, 1999. Lidar remote sensing of the canopy structure and biophysical properties of douglas-fir western hemlock forests, Remote Sensing of Environment, 70:339-361. Litkey, P., X. Liang, H. Kaartinen, J. Hyyppä, A. Kukko, and M. Holopainen, 2008. Single scan TLS methods for forest parameter retrieval, International Conference on LiDAR Applications in Forest Assessment and Inventory - SilviLaser 2008, Edinburgh, UK, pp. 295-304. Maas, H.G., A. Bienert, S. Scheller, and E. Keane, 2008. Automatic forest inventory parameter determination from terrestrial laser scanner data, International Journal of Remote Sensing, 29(5):1579-1593. Maltamo, M., K. Mustonen, J. Hyyppä, J. Pitkänen, and X. Yu, 2004. The accuracy of estimating individual tree variables with airborne laser scanning in a boreal nature reserve, Canadian Journal of Forest Research, 34(9):1791-1801. Nelson, R., 1988. Estimating forest biomass and volume using airborne laser data, Remote Sensing of Environment, 24:247-267. Nelson, R.F., P. Hyde, P. Johnson, B. Emessiene, M.L. Imhoff, R. Campbell, and W. Edwards, 2007. Investigating RaDARLiDAR synergy in a North Carolina pine forest, Remote Sensing of Environment, 110(1):98-108. Popescu, S.C., and K. Zhao, 2008. A voxel-based lidar method for estimating crown base height for deciduous and pine trees, Remote Sensing of Environment, 112(3):767-781. Pu, R., and P. Gong, 2004. Wavelet transform applied to EO-1 hyperspectral data for forest LAI and crown closure mapping, Remote Sensing of Environment, 91(2):212-224. Reitberger, J., C. Schnörr, M. Heurich, P. Krzystek, and U. Stilla, 2008. Towards 3D mapping of forests: A comparative study with first/last pulse and full waveform LiDAR data, International Archives of the Photogrammetry, Remote Sensing and Spatial Information Sciences, Beijing, pp. 1397-1403. Sawaguchi, I., K. Nishida, M. Shishiuchi, and S. Tatsukawa, 2003. Positioning precision and sampling number of DGPS under forest canopies, Journal of Forest Research, 8(2):0133-0137. Sheng, Y., P. Gong, and G.S. Biging, 2001. Model-based conifer crown surface reconstruction from high-resolution aerial images, Photogrammetric Engineering & Remote Sensing, 67(8):957-965. Simonse, M., T. Aschoff, H. Spiecker, and M. Thies, 2003. Automatic determination of forest inventory parameters using terrestrial laserscanning, Proceedings of the ScandLaser Scientific Workshop on Airborne Laser Scanning of Forests, Sweden, pp. 251-257. Solberg, S., A. Brunner, K.H. Hanssen, H. Lange, E. Næsset, M. Rautiainen, and P. Stenberg, 2009. Mapping LAI in a Norway spruce forest using airborne laser scanning, Remote Sensing of Environment, 113(11):2317-2327 Solberg, S., E. Naesset, and O.M. Bollandsas, 2006. Single tree segmentation using airborne laser scanner data in a structurally heterogeneous spruce forest, Photogrammetric Engineering & Remote Sensing, 72(12):1369-1378. Wynne, R.H., 2006. Lidar remote sensing of forest resources at the scale of management, Photogrammetric Engineering & Remote Sensing: 72(12):1310-1314. March 2011
227