Automated Simulation-Based Capacity Planning for Enterprise Data Fabrics Samuel Kounev, Konstantin Bender, ∗ Fabian Brosig and Nikolaus Huber
Russell Okamoto VMware, Inc. 1260 NW Waterhouse Ave., Suite 200 Beaverton, Oregon 97006
Karlsruhe Institute of Technology, 76131 Karlsruhe, Germany
{kounev,fabian.brosig,nikolaus.huber}@kit.edu ABSTRACT Enterprise data fabrics are gaining increasing attention in many industry domains including financial services, telecommunications, transportation and health care. Providing a distributed, operational data platform sitting between application infrastructures and back-end data sources, enterprise data fabrics are designed for high performance and scalability. However, given the dynamics of modern applications, system sizing and capacity planning need to be done continuously during operation to ensure adequate quality-ofservice and efficient resource utilization. While most products are shipped with performance monitoring and analysis tools, such tools are typically focused on low-level profiling and they lack support for performance prediction and capacity planning. In this paper, we present a novel case study of a representative enterprise data fabric, the GemFire EDF, presenting a simulation-based tool that we have developed for automated performance prediction and capacity planning. The tool, called Jewel, automates resource demand estimation, performance model generation, performance model analysis and results processing. We present an experimental evaluation of the tool demonstrating its effectiveness and practical applicability.
1.
INTRODUCTION
Enterprise data fabrics are becoming increasingly popular as an enabling technology for modern high-performance data intensive applications. Conceptually, an enterprise data fabric (EDF) represents a distributed enterprise middleware that leverages main memory and disk across multiple disparate hardware nodes to store, analyze, distribute, and replicate data. EDFs are relatively new type of enterprise middleware. Also referred to as “information fabrics” or “data grids”, EDFs can dramatically improve application performance and scalability. However, given the dynam9∗This work was partially funded by the German Research Foundation (DFG) under grant No. KO 3445/6-1.
Permission to make digital or hard copies of all or part of this work for personal or classroom use is granted without fee provided that copies are not made or distributed for profit or commercial advantage and that copies bear this notice and the full citation on the first page. To copy otherwise, to republish, to post on servers or to redistribute to lists, requires prior specific permission and/or a fee. Copyright 2010 ACM ...$10.00.
[email protected]
ics of modern applications, to ensure adequate quality-ofservice and efficient resource utilization, capacity planning needs to be done on a regular basis during operation. In today’s data centers, EDFs are typically hosted on dedicated server machines with over-provisioned capacity to guarantee adequate performance and availability at peak usage times. Servers in data centers nowadays typically have average utilization ranging from 5-20% [26, 29] which corresponds to their lowest energy-efficiency region [3]. To improve energy efficiency and reduce total-cost-of-ownership (TCO), capacity planning techniques are needed that help to estimate the amount of resources required for providing a given qualityof-service level at a reasonable cost. Such techniques should help to answer the following questions that arise frequently both at system deployment time and during operation: ◦ How many servers are needed to meet given response time and throughput service level agreements (SLAs)? ◦ How scalable is the EDF over N number of server nodes for a given workload type? ◦ What would be the average throughput and response time in steady state? What would be the utilization of the server nodes and of the network? ◦ What would be the performance bottleneck for a given scenario? ◦ How much would the system performance improve if the servers are upgraded? ◦ As the workload increases, how many additional servers would be needed? Answering such questions requires the ability to predict the system performance for a given workload scenario and capacity allocation. While many modeling and prediction techniques for distributed systems exist in the literature, most of them suffer from two significant drawbacks [17]. First, performance models are expensive to build and provide limited support for reusability and customization. Second, performance models are static and maintaining them manually during operation is prohibitively expensive. Unfortunately, building a predictive performance model manually requires a lot of time and effort. Current performance analysis tools used in industry mostly focus on profiling and monitoring transaction response times and resource consumption. Such tools often provide large amounts of lowlevel data while important information needed for building performance models is missing, e.g., service resource demands.
2.
GEMFIRE ENTERPRISE DATA FABRIC
GemFire [12] is an in-memory distributed data management platform from GemStone Systems which was recently acquired by VMware. It is implemented as a distributed hash table where data is scattered over a network of ma-
Data Each node holds a data portion
Machine 1
Machine 2 Application
Network
Machine 3
Machine 4
GemFire
Given the dynamics of modern EDFs, techniques for automated model extraction are highly desirable. Such techniques would enable proactive run-time resource management by making it possible to predict the system performance (e.g., response times and resource utilization) for anticipated workload and configuration scenarios. For example, if one observes a growing customer workload, a performance model can help to determine when the system would reach its saturation point. This way, system operators can react to the changing workload before the system has failed to meet its performance objectives, thus avoiding a violation of SLAs. Furthermore, performance models can be exploited to implement autonomic run-time performance and resource management [17, 22]. In this paper, we present a novel case study of a representative EDF, the GemFire Enterprise [12], presenting a simulation-based tool that we have developed for automated performance prediction and capacity planning. The tool automates resource demand estimation, performance Mittwoch, 16. Juni 2010 model generation, performance model analysis and results processing. Given a system configuration and a workload scenario, the tool generates a report showing the predicted system throughput, server and network utilization, and operation response times. Both, the modeling approach and the model extraction technique are evaluated to demonstrate their effectiveness and practical applicability. To the best of our knowledge, no performance modeling case studies of EDFs exist in the literature. The research value of the proposed modeling approach is that it presents a set of adequate abstractions for capturing the performancerelevant aspects of GemFire, as a representative EDF, that have been validated and shown to provide a good balance between modeling effort, analysis overhead and accuracy. Developing a simulation model using a general-purpose simulation language is a time-consuming and error-prone task, and there is no guarantee that the resulting model will provide the required accuracy at reasonable cost (simulation time). The abstractions we propose do not require any programming, they are compact yet expressive, and provide good accuracy at low cost. Furthermore, the proposed models can be generated automatically based on easily available monitoring data. In summary, the contributions of the paper are: i) a modeling approach for EDFs coupled with a technique for automatic model extraction based on monitoring data, ii) a simulation-based tool for automated performance prediction and capacity planning, iii) An experimental evaluation of the modeling and automation approach demonstrating its practical applicability. The rest of this paper is organized as follows: In Section 2, we present a brief introduction of the GemFire EDF. Following this, in Sections 3 and 4 , we present our modeling approach and capacity planning framework, respectively. In Section 5, we evaluate our approach by considering a case study. We discuss future work and planned enhancements of our tools in Section 6. Finally, we review related work in Section 7 and wrap up with some concluding remarks in Section 8.
Data Management Membership & Discovery
Distribution
Communication Host Network
9(a) Data Fabric
9(b) GemFire Architecture
Figure 1: GemStone Data Fabric chines connected in a peer-to-peer fashion as illustrated in Figure 1. GemFire is typically used to cache large amounts of operational data, not fitting into the memory of a single node. GemFire is implemented as a middleware library sitting between the application and a host network. It provides the three middle layers shown in Figure 1. The GemFire middleware connects each application process in a peer-topeer fashion and enables them to share data by putting key/value pairs into hierarchical regions which essentially are distributed hash tables. The following basic topologies are possible: i) peer-to-peer: application processes are connected in a peer-to-peer fashion storing application data in their heap memory, ii) client-server: two types of processes exist, application processes executing the application logic, and server processes storing the application data, iii) multisite: local peer-to-peer or client/server configurations are connected through a WAN. The basic building block of GemFire is a region: a distributed hash map holding key/value pairs. Regions have names and can be organized hierarchically. They are comparable to folders in a disk file system, where file names represent keys and file contents represent values. Regions can be local, distributed or partitioned. A local region is stored in the heap memory of the owning process and is not visible to other system nodes. A distributed region is also stored in the heap memory of the owning process, however, it is visible to all nodes. Finally, a partitioned region is a distributed region whose data is partitioned into buckets that are scattered over all nodes where every node holds a portion (one or more buckets) of the region’s data. GemFire provides a vast number of built-in statistics as well as a Statistics API for defining custom statistics [13]. In addition, a set of tools for monitoring, administration and statistics analysis are provided. The most important one is the Visual Statistics Display (VSD) - a GUI tool for analyzing statistics, recorded by GemFire during application execution.
3.
MODELING GEMFIRE
In this paper, we consider the most typical usage scenario for GemFire: partitioned data distributed over a set of servers in a client/server topology. Every server has one
or more clients, which send GET and PUT requests to the servers. The semantics of both operations are defined by the Java Map interface, which is essentially a hash table with two operations: get(key) and put(key, value). For every GET request, the server returns the corresponding VALUE. For every PUT request, the server returns an acknowledgement (ACK). Because data is partitioned and distributed over multiple servers, a particular key-value pair can either reside locally or on a remote server. If the key-value pair is stored locally, the server immediately returns the VALUE (or ACK). If the key-value pair is located on a different server, the server forwards the request to the remote server, and waits for the VALUE (or ACK) from the remote server, which it then forwards to the client. In other words, the server to which the client is connected acts as a proxy forwarding all requests for which the target data is not available locally to the corresponding servers. The server has two main thread pools: Client-Thread-Pool (CTP) and PeerThread-Pool (PTP). Requests coming from clients are processed by CTP-threads, while requests coming from servers (peers) are handled by PTP-threads. Each key is represented as a number of type long, wrapped in an object of type Key, while the value is represented by a byte array of configurable length, wrapped in an object of type Value. Physically, every GemFire server is deployed on a dedicated machine and the machines are connected by a Gigabit LAN. The main performance metrics of interest are: response time, throughput, CPU utilization and network traffic. Queue
Transition
o
Depository
Nested Montag, 21.QPN Juni 2010
Token
o o o Ordinary Place
o
o
o
o
Queueing Place
o
Subnet Place
Figure 2: QPN Notation
3.1
Generalized System Model
We now present our modeling approach which is based on Queueing Petri Nets (QPNs) [4]. QPNs can be seen as an extension of stochastic Petri nets that allow queues to be integrated into the places of a Petri net. A place that contains an integrated queue is called a queueing place and is normally used to model a system resource, e.g., CPU, disk drive or network link. Tokens in the Petri net are used to model requests or transactions processed by the system. Arriving tokens at a queueing place are first served at the queue and then they become available for firing of output transitions. When a transition fires it removes tokens from some places and creates tokens at others. Usually, tokens are moved between places representing the flow-of-control during request processing. QPNs also support so-called subnet places that contain nested QPNs. Figure 2 shows the notation used for ordinary places, queueing places and subnet places. For a detailed introduction to QPNs, the reader is referred to [16].
OTPi
ReturnThreadi
ClientOuti OperationEmitteri
OperationQueuei
NetworkIn
-/M/4/PS ClientCPUi
-/M/∞/IS
CreateOperationi
StartOperationi
NetworkOut ClientIni
9(a) Client Model ServerOuti NetworkIn -/M/4/PS
CTPi
PTPi
ServerCPUi
NetworkOut
ServerIni
9(b) Server Model
NetworkIn
-/M/!/IS
-/M/1/FCFS
NetworkDelay
NetworkTransfer
NetworkOut
9(c) Network Model Figure 3: Client, Server and Network Submodels
As demonstrated in [7], QPNs provide greater modeling power and expressiveness than conventional queueing network models and stochastic Petri nets. By supporting the integration of hardware and software aspects of system behavior [7, 16], QPNs allow us to easily model blocking effects resulting for example from thread contention. Both analytical and simulation techniques for solving QPN models exist including product-form solution techniques and approximation techniques [5, 6, 19]. For the tool presented in this paper, we used simulation since it is the least restrictive method in terms of scalability, however, given that service times in our models were all exponentially distributed, analytical techniques can be used for smaller scenarios. The advantage of using QPNs as opposed to a general-purpose simulation model is that highly optimized simulation techniques for QPNs exist that exploit the knowledge of their structure and behavior for fast and efficient simulation [19]. The QPN model we propose does not require any programming, it is compact yet expressive, and, as will be shown later, provides good accuracy at low cost. The model can be divided into three parts: the client, the network and the server. Every request or response goes through the network. Requests, responses and threads are modeled by tokens of different colors. Table 1 defines the token colors we use. The three submodels are shown in Figure 3. We now look at each of them in turn. Every client is represented in the model by a set of four places: OperationEmitter, OperationQueue, ClientCPU and OTP. The OperationEmitter generates GET and PUT requests at a given rate. These requests are placed in the OperationQueue where they wait for a thread. After acquiring a thread from the Operation-Thread-Pool (OTP), the GET or PUT requests consume some CPU time in the ClientCPU and are then placed into the NetworkIn place of the network submodel. The servers process the requests
OTP1
CTP1 PTP1 Operation Emitter1
Operation Queue1
-/M/∞/IS
Client CPU1
ServerCPU1 -/M/4/PS
-/M/4/PS
NetworkIn OTP2 CTP2 PTP2 NetworkDelay -/M/∞/IS
ServerCPU2 -/M/4/PS
Operation Emitter2
Operation Queue2
-/M/∞/IS
Client CPU2 -/M/4/PS
...
NetworkTransfer -/M/1/FCFS
... OTPn NetworkOut CTPn PTPn Operation Emittern
Operation Queuen
-/M/∞/IS
Client CPUn
ServerCPUn
-/M/4/PS
-/M/4/PS
Dienstag, 20. Juli 2010
Figure 4: QPN Model of the System
Table 1: Token Colors T Gi Pi Vi Ai gi,j pi,j vi,j ai,j
Thread GET request from client i to server i PUT request from client i to server i VALUE from server i to client i for a GET request ACK from server i to client i for a PUT request Forwarded GET request from server i to server j Forwarded PUT request from server i to server j VALUE from server i to server j for a forw. GET ACK from server i to server j for a forw. PUT
and send VALUE or ACK responses back over the network, where they become available to the client in the NetworkOut place. The VALUE and ACK responses are then fired into the ClientCPU, where they again consume some CPU time and are destroyed after releasing the OTP thread. The OTP and the OperationQueue are modeled with ordinary places, while the OperationEmitter and ClientCPU are modeled with queueing places. The OperationEmitter has an InfiniteServer (IS) queue with an initial population of one GET request and one PUT request token. The transition CreateToken is configured to fire those GET and PUT tokens into the OperationQueue while at the same time firing a GET or a PUT token back into the OperationEmitter. This is a common way to model a client that generates requests at a given rate [16]. Each server is modeled with a queueing place ServerCPU and two ordinary places CTP and PTP representing the client and peer thread pools, respectively. The logic lies in the transitions and handling of the token colors. The following four cases are distinguished: 1. The server receives a GET (or PUT) request from the client, data is available locally. In this case, the server acquires a thread from place CTP and sends a VALUE
(or ACK) response back to the client, releasing the CTPthread. 2. The server receives a GET (or PUT) request from the client, data is stored on another server. In this case, the server acquires a thread from place CTP and forwards the GET (or PUT) request to the corresponding server. 3. The server receives a VALUE (or ACK) response from another server for a previously forwarded GET (or PUT) request to that server. In this case, the server forwards the VALUE (or ACK) response back to the client, releasing the CTP-thread. 4. The server receives a GET (or PUT) request from any of the other servers. In this case, the data is always available locally, the server acquires a thread from the PTP and sends a VALUE (or ACK) response to the requesting server, releasing the PTP-thread. Finally, the network is modeled with four places NetworkIn, NetworkDelay, NetworkTransfer and NetworkOut. The ordinary places NetworkIn and NetworkOut serve as entry and exit points of the network. The queueing place NetworkDelay models the network delay using an integrated IS queue. The queueing place NetworkTransfer contains an integrated FCFS queue that models the network transfer time. The service time of the queue is dependent on the size of the message being transferred and is configured according to the network bandwidth. The overall system model for n servers obtained by combining the submodels from Figure 3 is shown in Figure 4.
3.2
Simplified System Model
The modeling approach described in the previous section allows to simulate any number of clients, where the load on the servers and other parameters, such as number of cores, resource demands can be configured for each client and server, individually. In many customer deployments, however, it is typical that identical hardware is used for the servers and GemFire tries to distribute the data evenly
OTP1 NetworkIn CTP1 PTP1 Operation Emitter1
Operation Queue1
-/M/∞/IS
Client CPU1
NetworkDelay
ServerCPU1
-/M/∞/IS
-/M/4/PS
-/M/4/PS
NetworkTransfer
OTPX
-/M/1/FCFS
CTPX PTPX Operation EmitterX
Operation QueueX
-/M/∞/IS
Client CPUX
NetworkOut ServerCPUX -/M/4/PS
-/M/4/PS
Figure 5: Simplified QPN Model of the System Dienstag, 20. Juli 2010
among the server nodes. Moreover, it can be assumed that clients are also evenly distributed among the servers. In such a scenario, the proposed model can be simplified significantly by considering the interaction of one client-server pair with the rest of the system which is modeled as one fat client/server pair configured to have the same processing power as all the other client/server pairs together. This allows the use of the same model structure for any number of client/server pairs. Figure 5 shows the simplified model. For the fat client/server pair X, three cases are distinguished when a GET or PUT request from client X arrives: i) data is stored locally, ii) data is stored on server 1, iii) data is stored on another server within X. Cases 1 and 2 are handled exactly in the same way as in the generalized system model. In case 3, however, server X forwards the request to itself (imaginary server Z), handles the forwarded request, returns a VALUE (or ACK) response to itself, and forwards the response back to client X. This workaround emulates the CPU and network usage for all cases, where any of the servers 2 . . . n forward GETs or PUTs to any of the other servers 2 . . . n.
Specify server configuration and target workload
Measure resource demands
Generate model skeleton
Analyze model using SimQPN
Generate model instance
Parameterize model
QoS requirements met? NO
Process results
Determine bottleneck resource
YES
Figure 6: Generic Capacity Planning Process
Client
Server A Operating System
Operating System Ruby
JavaVM SSH Server
JavaVM Switch
Jewel
4.
Increase capacity
GemFire
NTP GemFire
SimQPN
AUTOMATED PERFORMANCE PREDICTION AND CAPACITY PLANNING
To automate the process of performance prediction and capacity planning, we implemented a tool called Jewel that automates resource demand estimation, model generation, model analysis and results processing. Given a system configuration and a workload scenario, the tool generates a report showing the predicted system throughput, server utilization and operation response times. Jewel is a commandline tool written in Ruby. It uses the SimQPN simulation engine [19] for solving the generated QPN models. The only thing required to run Jewel is a Java Runtime Environment and a Ruby installation. For technical details on the tool, we refer the reader to [9]. A common use case for Jewel is a scenario where a GemStone customer would like to know how many servers and what bandwidth he would need in order to sustain a given workload while ensuring that performance requirements are satisfied. The client provides estimated workload data, such as number of key/value pairs, data type and size, and request arrival rates. As a first step, Jewel is used to estimate the resource demands for the specified data type and
Controller
Server B
Figure 7: Setup for Resource Demand Estimation
size. The resource demands are measured in a small testing environment comprising three nodes as depicted in Figure 7. Several experiments under different workload mixes are executed and GemFire’s internal statistics are used to estimate the resource demands. The whole process is completely automated and the only thing required is to provide the names of the machines where the measurement experiments should be executed. After the resource demands have been estimated, Jewel can be used to automatically generate an instance of the performance model presented in the previous section for a given number of servers and network bandwidth. The model is analyzed and used to predict the expected throughput, the server and network utilization, and the expected request response times. The process can be repeated multiple times for increasing number of servers
●
15
20
25
30
35
0.10
0.15
0.20 ●
Resource Demands [ms]
●
●
10
2.0
PC08
Legend
PC10
15
20
●
25
30
30
35
1.5
●
●
15
20
●
30
35
100% ●
●
75%
●
Legend ●
Uclient Userver Unetwork
● ● ●
50%
●
● ●
25%
Uclient Userver Unetwork
25
Throughput [1000 PUTs/sec]
●
10
Development Machine
25
●
●
10
Legend ●
50%
75%
100%
6 Servers
20
●
0%
6 Clients
15
1.0
35
●
25%
PC12
●
●
0.5
●
Throughput [1000 GETs/sec]
CPU/Network Utilization
PC06
●
0%
Gigabit LAN
10
PC11
●
0.0
●
Response Time [ms]
1.5 1.0
● ●
CPU/Network Utilization
PC04
●
Rput
0.0
Gigabit Switch
0.5
PC09
●
Legend
Rget
PC03
●
Throughput [1000 PUTs/sec]
2.0
Gigabit LAN
Throughput [1000 GETs/sec]
Response Time [ms]
Each machine equipped with Intel Core 2 Quad Q6600 2.4GHz, 8 GB RAM Ubuntu 8.04
●
Cput+ack Sput Sput+ack
0.00
PC07
PC05
●
Legend ●
0.05
0.20 0.15
●
10
PC02
Cget+value Sget Sget+value
0.00
PC01
Legend ●
0.10
EXPERIMENTAL EVALUATION
In this section, we present an experimental evaluation of our modeling approach. Our experimental environment consists of 12 machines connected by a Gigabit LAN as shown in Figure 8. Each machine has an Intel Core 2 Quad Q6600 CPU, 2.4 Ghz, 8 GB RAM and Ubuntu 8.04 installed. Experiments are initiated and controlled by an additional development machine.
0.05
5.
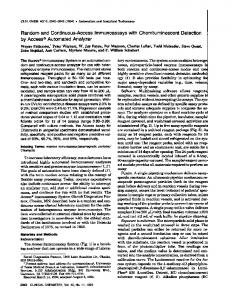
was varied between 5000 and 40000 requests/sec. The maximum throughput level reached was about 35000 requests/sec and the server CPU utilization did not exceed 80%. As we can see, although the extracted CPU resource demands under higher workload intensity are slightly lower, the difference is negligible. As a rule of thumb, we recommend extracting resource demands at moderate server utilization of 40%-60%. The resource demands used in the case study presented here were extracted under moderate workload intensity with server utilization around 50%.
Resource Demands [ms]
and/or network bandwidth until a point is reached where the predicted performance meets the customer requirements, e.g., network and CPU utilization are below 80% and the response time R < Rmax . The result of the analysis process is the required number of servers and network bandwidth as well as the expected throughput, server and network utilization, and the request response times. The process is illustrated in Figure 6.
15
20
25
30
35
Throughput [1000 GETs/sec]
10
15
20
25
30
35
Throughput [1000 PUTs/sec]
Figure 8: Experimental Environment In the following, we will be using the following notation: ◦ Client CPU demands Cget+value and Cput+ack in ms ◦ Server CPU demands Sget , Sput , sget+value , and sput+ack in ms ◦ Message sizes Mget/put/value/ack in Bytes ◦ Throughput Xget/put in requests/sec ◦ Response times Rget/put in ms ◦ CPU utilization Uclient/server in % ◦ Network utilization Unetwork in %
5.1
Resource Demand Estimation
We first analyze the effect of extracting resource demands under different workload intensities. The resource demands are extracted using Jewel in an environment with 1 client machine and 2 server machines. Figure 9 shows the results from a series of experiments where the workload intensity
Figure 9: Resource demand estimation under varying workload intensity.
5.2
Model Validation
We now consider several workload and configuration scenarios and compare performance predictions obtained with Jewel against measurements on the real system. The goal is to evaluate the effectiveness and accuracy of our performance modeling and prediction approach. We first consider a set of scenarios where we vary the number of client/server pairs, on the one hand, and the workload type, on the other hand. Configurations with 4 and 6 client-server pairs under two different workload mixes are analyzed. The ratio of GET vs. PUT operations is 50:50 in the first workload and 80:20 in the second. We consider two different workload intensities: moderate load and heavy load. The two sets of results are shown in Figure 10 and Figure 11, respectively. Note that the workload intensity is increased when increasing the number of servers in order to ensure that the system
Rget 6 pairs
100% 75% 50% Uclient 4 pairs
Userver 4 pairs
Unetw. 4 pairs
Uclient 6 pairs
Userver 6 pairs
Rput 6 pairs
Unetw. 6 pairs
measured predicted
1.5 Response Time [ms]
Rput 4 pairs
0.0
Rget 4 pairs
25%
CPU/Network Utilization
0%
Unetw. 6 pairs
1.0
75% 50%
Userver 6 pairs
Rget 4 pairs
Rput 4 pairs
Rget 6 pairs
Rput 6 pairs
Figure 11: Scenarios with 4 and 6 client/server pairs under two heavy workload mixes 50:50 (left) and 80:20 (right).
●
●
●
●
●
2
4
8
16
32
64
128 256
Number of client/server pairs
10000
●
6000
● ● ●
Analysis Time [sec]
Uclient (P) Userver (P)
●
2000
Legend ●
0
is reasonably loaded. As we can see, the model is very accurate in predicting the client, server and network utilization with modeling error below 10%. The response time predictions are slightly less accurate, however, still acceptable for capacity planning purposes. We now consider a scenario with 6 clients and 6 servers in which the workload intensity is increased from 12000 requests/sec to 72000 requests/sec. Again two workload mixes are analyzed, with a GET vs. PUT ratio of 50:50 and 80:20, respectively. The results are presented in Figure 12. We can see that the higher the workload intensity, the more accurate the predictions for server CPU utilization are. This is expected since, as discussed earlier, the resource demands slightly decrease when increasing the workload intensity. Given that we extracted resource demands under moderate workload conditions, the modeling error is much lower for moderate to high workload intensity (server utilization beyond 50%) which is the focus of our study. As previously, the predictions of client and network utilization are very accurate with modeling error below 10%. As to response times, the modeling error goes up to 36% when increasing the workload intensity, however, considered as an absolute value the difference is only 0,5ms in the worst case. In addition to the scenarios, presented in this paper, we studied a number of different scenarios varying the type of workload (type and size of stored data), the workload intensity, as well as the number of servers and network capacity. The results were of similar accuracy to the ones presented here. Overall, our experiments showed that predictions of network and server utilization were quite accurate independent of the load level, however, predictions of response times were reasonably accurate only in the cases where the average server utilization was lower than 75%. If the server is loaded beyond this level, response times grow faster than the model predictions although the predicted server utiliza-
Uclient 6 pairs
measured predicted
0.5
100%
Rput 6 pairs
Figure 10: Scenarios with 4 and 6 client/server pairs under two moderate workload mixes 50:50 (left) and 80:20 (right).
Unetw. 4 pairs
1.0
Response Time [ms]
0.0
Rget 6 pairs
Userver 4 pairs
measured predicted
100%
Rput 4 pairs
Uclient 4 pairs
1.5
measured predicted
Rget 4 pairs
25%
CPU/Network Utilization
0%
Unetw. 6 pairs
0.5
Userver 6 pairs
75%
100% 75% 50%
Uclient 6 pairs
50%
Rput 6 pairs
Unetw. 4 pairs
CPU Utilization
Rget 6 pairs
Userver 4 pairs
25%
Rput 4 pairs
25%
CPU/Network Utilization Response Time [ms]
1.0 Rget 4 pairs
Uclient 4 pairs
1.5
measured predicted
0.5 0.0
Response Time [ms]
Unetw. 6 pairs
measured predicted
0%
Userver 6 pairs
0%
Uclient 6 pairs
1.0
Unetw. 4 pairs
measured predicted
0.5
Userver 4 pairs
0.0
100% 75% 50% 25% Uclient 4 pairs
1.5
0%
CPU/Network Utilization
measured predicted
● ●
●
●
●
●
2
4
8
16
32
64
128 256
Number of client/server pairs
Figure 13: Analysis overhead for increasing number of client/server pairs.
tion is correct. This is due to synchronization effects inside the server which are not captured in the model. While it would be interesting to consider integrating these effects into the model, this would result in overly complex model dramatically increasing the overhead for the model analysis. Therefore, to keep the model compact, we refrained from doing this. Given that the model provides reliable predictions of server and network utilization, it can be used to estimate the amount of resources needed to ensure that the average server utilization does not exceed 75%. For these cases, measured response times never exceeded 2ms and the model predictions were reasonably accurate.
5.3
Analysis Overhead
To analyze the scalability of the proposed capacity planning framework, we evaluated the analysis overhead for scenarios with increasing number of client/server pairs. We scaled the number of client/server pairs from 1 to 256 while at the same time scaling the workload to ensure that the system is reasonably loaded. Each server was injected 6000 GET
● ●
●
●
● ●
100% 75%
● ●
● ●
50%
●
CPU/Network Utilization
50%
●
Legend Uclient (M) Uclient (P) Userver (M) Userver (P) Unetwork (M) Unetwork (P)
● ●
● ●
● ●
●
● ●
25%
100% 75%
●
●
25%
CPU/Network Utilization
Legend Uclient (M) Uclient (P) Userver (M) Userver (P) Unetwork (M) Unetwork (P)
●
● ●
0%
0%
●
12
24
36
48
60
72
12
24
36
48
60
72
Throughput (Xget+put) [1000 Requests/sec]
1.4
1.4
Throughput (Xget+put) [1000 Requests/sec]
●
●
0.6 0.4 ●
12
24
0.2 48
60
●
●
●
36
48
●
Legend
●
36
●
● ●
0.0
0.0
●
Rget (M) Rget (P) Rput (M) Rput (P)
●
1.0
●
0.8
● ●
●
0.6
●
Response Time [ms]
●
0.8
1.0
●
Legend
0.2
Response Time [ms]
● ● ●
1.2
●
0.4
1.2
● ●
72
●
12
Throughput (Xget+put) [1000 Requests/sec]
Rget (M) Rget (P) Rput (M) Rput (P) 24
60
72
Throughput (Xget+put) [1000 Requests/sec]
Figure 12: Scenarios with 6 client/server pairs under increasing workload intensity and two workload mixes 50:50 (left) and 80:20 (right). and 6000 PUT requests/sec. The results are shown in Figure 13. While the client utilization is constant, the server utilization increases slightly for up to 10 servers and stabilizes after that. The total time for the analysis was below 15 min for up to 64 servers and increased up to 160 minutes for 256 servers. Thus, the analysis overhead is acceptable for capacity planning purposes and the proposed approach can be applied for scenarios of reasonable size. We are currently working on further optimizing the analysis by parallelizing the simulation to take advantage of multi-core processors.
6.
FUTURE ENHANCEMENTS
As part of our future work, we plan to extend our approach to support advanced GemFire features such as redundancy, replication and publish/subscribe-based messaging. Furthermore, we plan to study virtualized execution environments and extend our models to allow modeling virtual resources and their mapping to physical resources. This will allow predictions for scenarios where GemFire servers are running on virtual machines, possibly migrating from one machine to another, depending on their load. In such a scenario, our performance prediction framework could be used to predict the effect of migrating a GemFire instance between physical machines and, for example, to determine which nodes to run on which machines and how much resources to allocate to virtual machines. To give an example, lets consider the scenario from Section 4 and assume that the service provider is running GemFire in a virtualized data center environment (e.g., private cloud). By means of our capacity planning framework, the
system resource requirements are analyzed and an initial sizing is determined. The initial deployment includes one JVM per machine and each JVM is running inside a virtual machine (VM) allowing VMs to be migrated from one physical machine to another. Now, while the system is running in production, the service provider observes a workload change. With the help of an automatically extracted performance model, he would be able to predict the effect of migrating and combining multiple underutilized VMs on one machine, while moving overloaded VMs to machines with more power. He could also be able to predict the effect of scaling the number of virtualized CPUs, CPU speed and network bandwidth. Figure 14 illustrates the described scenario. One VM, marked red, is overloaded and is migrated to another machine with sufficient processing power and capacity. Taking this one step further, an algorithm can be implemented that automates this process and automatically finds an optimal configuration ensuring both, satisfaction of customer SLAs and efficient resource utilization.
7.
RELATED WORK
EDFs are related to peer-to-peer systems for which there is plenty of literature, however, mostly focused on analyzing the performance and scalability of distributed hashing and routing algorithms (e.g., [1, 20, 25]). To the best of our knowledge, no techniques exist in the literature for automated model extraction of EDFs and we are not aware of any performance modeling case studies of EDFs. Regarding the use of QPNs for performance modeling of distributed systems, in [18] QPNs were used to model
Heterogeneous Server Cloud
Machine Z GemFire
GemFire
JVM
JVM
OS
OS
VM
VM
Hypervisor Hardware
VM Overloaded, Migrate & Resize Machine X GemFire
GemFire
GemFire
JVM
JVM
JVM
OS
OS
OS
VM
VM
VM
Hypervisor Hardware
Machine Y GemFire
GemFire
JVM
JVM
OS
OS
VM
VM
Hypervisor Hardware
Figure 14: GemFire running in a heterogeneous server cloud where one VM is overloaded and needs to be migrated to another machine.
parameters during operation whereas in our approach we extract resource demands offline. Techniques for the automated extraction of structural information of performance models are presented in [14, 15] and [10]. They are based on monitoring data that is gathered by instrumentation. While in [14, 15], layered queueing networks are extracted without providing resource consumption data, an end-to-end method for the semi-automated extraction of performance models from enterprise Java applications is presented in [10]. The method extracts instances of the Palladio Component Model (PCM) [8] based on trace data reflecting the observed call paths during execution, including resource demands that are quantified based on measured response times as well as throughput and resource utilization data. In [2], a different approach for the performance prediction of component-based software systems is proposed. Asymptotic bounds for system throughput and response time are derived from the software specification without deriving explicit performance models. However, only coarse-grained bounds can be calculated. For instance, concerning service response times in an open workload scenario, only lower bounds are provided.
8. a real-world distributed e-business application, the SPECjAppServer2002 benchmark. However, since the QPN model was too large to be analyzable using the tools available at that time, some simplifications had to be made reducing the model accuracy. Later in [16], a more complex and realistic model of the SPECjAppServer2004 benchmark was studied and analyzed by means of the SimQPN simulation engine which was introduced in [19]. In [22], automatically generated QPN models were used to provide online performance prediction capabilities for Grid middleware. The authors present a novel methodology for designing autonomic QoS-aware resource managers that have the capability to predict the performance of the Grid components which they manage, and allocate resources in such a way that SLAs are honored. However, the resource demands for the generated QPN models are simply approximated by measured service response times. In our approach, the resource demands are estimated based on measured resource utilization and throughput data with the Service Demand Law [11, 21]. Rolia et al. [28] and Pacific et al. [23, 24] characterize resource demands by formulating a multivariate linear regression problem. Average resource and throughput data, measured at different time intervals, serves as input for linear systems of equations, which are based on the Utilization Law. This allows estimating resource demands when different workload classes run concurrently. To overcome the problem of collinearity, i.e., a strong correlation between the regression variables making it difficult to estimate the individual regression coefficients reliably, a new technique for estimating resource demands was presented in [27]. The authors claim that “in contrast to regression, it does not suffer from the problem of multicollinearity, it provides more reliable aggregate resource demand and confidence interval predictions” [27]. However, such estimation techniques are not required in our approach, since resource demands are measured directly by running one workload class at a time. Another method to quantify resource demands based on Kalman filters is proposed in [30]. This approach estimates
CONCLUDING REMARKS
We presented a novel case study of a representative stateof-the-art EDF, the GemFire EDF, presenting a tool that we have developed for automated performance prediction and capacity planning. The tool, called Jewel, automates resource demand estimation, performance model generation, performance model analysis and results processing. Given a system configuration and a workload scenario, the tool generates a report showing the predicted system throughput, server and network utilization, and operation response times. Both, the modeling approach and the model extraction technique were evaluated to demonstrate their effectiveness and practical applicability. To the best of our knowledge, no performance prediction techniques for EDFs or case studies exist in the literature. The technique presented here provides a framework for performance prediction and capacity planning that can be used both at system deployment time and during operation to ensure that systems are allocated enough resources to meet their quality-of-service requirements.
9.
REFERENCES
[1] R. Baldoni, L. Querzoni, and A. Virgillito. Distributed event routing in publish/subscribe communication systems: a survey. Technical report, 2005. [2] S. Balsamo, M. Marzolla, and R. Mirandola. Efficient performance models in component-based software engineering. In EUROMICRO-SEAA, pages 64–71, 2006. [3] L. A. Barroso and U. H¨ olzle. The Case for Energy-Proportional Computing. IEEE Computer, 40(12):33–37, 2007. [4] F. Bause. Queueing Petri Nets˜- A formalism for the combined qualitative and quantitative analysis of systems. In Proceedings of the 5th International Workshop on Petri Nets and Performance Models, Toulouse, France, October 19-22, 1993. [5] F. Bause and P. Buchholz. Queueing Petri Nets with Product Form Solution. Performance Evaluation, 32(4):265–299, 1998. [6] F. Bause, P. Buchholz, and P. Kemper. QPN-Tool for the Specification and Analysis of Hierarchically Combined Queueing Petri Nets. In H. Beilner and F. Bause, editors, Quantitative Evaluation of Computing and Communication Systems, volume 977 of LNCS. Springer-Verlag, 1995. [7] F. Bause, P. Buchholz, and P. Kemper. Integrating Software and Hardware Performance Models Using Hierarchical Queueing Petri Nets. In Proc. of the 9. ITG / GI -
[8]
[9]
[10]
[11]
[12] [13] [14]
[15]
[16]
[17]
[18]
[19]
[20]
[21]
[22]
[23]
[24]
[25]
[26] [27]
Fachtagung Messung, Modellierung und Bewertung von Rechen- und Kommunikationssystemen, 1997. S. Becker, H. Koziolek, and R. Reussner. The palladio component model for model-driven performance prediction. Journal of Systems and Software, 82(1):3 – 22, 2009. Special Issue: Software Performance - Modeling and Analysis. K. Bender. Automated Performance Model Extraction of Enterprise Data Fabrics. Master’s thesis, Karlsruhe Institute of Technology, Karlsruhe, Germany, May 2010. F. Brosig, S. Kounev, and K. Krogmann. Automated Extraction of Palladio Component Models from Running Enterprise Java Applications. In Proceedings of the 1st International Workshop on Run-time mOdels for Self-managing Systems and Applications (ROSSA 2009). In conjunction with Fourth International Conference on Performance Evaluation Methodologies and Tools (VALUETOOLS 2009), Pisa, Italy, October 19, 2009., Oct. 2009. P. J. Denning and J. P. Buzen. The operational analysis of queueing network models. ACM Comput. Surv., 10(3):225–261, 1978. GemFire Homepage. http://www.gemstone.com/products/gemfire/. Gemstone Systems Inc. GemFire Enterprise - System Administrator’s Guide, version 6.0 edition, 2009. C. E. Hrischuk, C. M. Woodside, J. A. Rolia, and R. Iversen. Trace-based load characterization for generating performance software models. IEEE Trans. Softw. Eng., 25(1):122–135, 1999. T. A. Israr, D. H. Lau, G. Franks, and M. Woodside. Automatic generation of layered queueing software performance models from commonly available traces. In WOSP ’05: Proceedings of the 5th international workshop on Software and performance, pages 147–158, New York, NY, USA, 2005. ACM. S. Kounev. Performance Modeling and Evaluation of Distributed Component-Based Systems using Queueing Petri Nets. IEEE Transactions on Software Engineering, 32(7):486–502, July 2006. S. Kounev, F. Brosig, N. Huber, and R. Reussner. Towards self-aware performance and resource management in modern service-oriented systems. In Proceedings of the 7th IEEE International Conference on Services Computing (SCC 2010), July 5-10, Miami, Florida, USA. IEEE Computer Society, 2010. S. Kounev and A. Buchmann. Performance Modeling of Distributed E-Business Applications using Queueing Petri Nets. In Proceedings of the 2003 IEEE International Symposium on Performance Analysis of Systems and Software (ISPASS 2003), Austin, Texas, USA, March 6-8, 2003, pages 143–155, Washington, DC, USA, 2003. IEEE Computer Society. S. Kounev and A. Buchmann. SimQPN - a tool and methodology for analyzing queueing Petri net models by means of simulation. Performance Evaluation, 63(4-5):364–394, 2006. P. Kumar, G. Sridhar, and V. Sridhar. Bandwidth and latency model for dht based peer-to-peer networks under variable churn. In Systems Communications, 2005. Proceedings, pages 320–325, Aug. 2005. D. A. Menasc´ e, V. A. F. Almeida, and L. W. Dowdy. Capacity planning and performance modeling: from mainframes to client-server systems. Prentice-Hall, Inc., Upper Saddle River, NJ, USA, 1994. R. Nou, S. Kounev, F. Julia, and J. Torres. Autonomic QoS control in enterprise Grid environments using online simulation. Journal of Systems and Software, 82(3):486–502, Mar. 2009. G. Pacifici, W. Segmuller, M. Spreitzer, and A. Tantawi. Dynamic estimation of cpu demand of web traffic. In valuetools ’06: Proceedings of the 1st international conference on Performance evaluation methodolgies and tools, page 26, New York, NY, USA, 2006. ACM. G. Pacifici, W. Segmuller, M. Spreitzer, and A. Tantawi. Cpu demand for web serving: Measurement analysis and dynamic estimation. Perform. Eval., 65(6-7):531–553, 2008. I. Rai, A. Brampton, A. MacQuire, and L. Mathy. Performance modelling of peer-to-peer routing. In Parallel and Distributed Processing Symposium, 2007. IPDPS 2007. IEEE International, pages 1–8, March 2007. K. Rangan. The Cloud Wars: $100+ Billion at Stake. Tech. Rep., Merrill Lynch, May 2008. J. Rolia, A. Kalbasi, D. Krishnamurthy, and S. Dawson. Resource demand modeling for multi-tier services. In WOSP/SIPEW ’10: Proceedings of the first joint
WOSP/SIPEW international conference on Performance engineering, pages 207–216, New York, NY, USA, 2010. ACM. [28] J. Rolia and V. Vetland. Parameter estimation for performance models of distributed application systems. In CASCON ’95: Proceedings of the 1995 conference of the Centre for Advanced Studies on Collaborative research, page 54. IBM Press, 1995. [29] L. Siegele. Let It Rise: A Special Report on Corporate IT. The Economist, Oct. 2008. [30] T. Zheng, C. Woodside, and M. Litoiu. Performance model estimation and tracking using optimal filters. Software Engineering, IEEE Transactions on, 34(3):391–406, May-June 2008.