Automatic Detection of Intestinal Juices in Wireless Capsule Video Endoscopy F. Vilari˜no, P. Spyridonos, O. Pujol, J. Vitri`a and P. Radeva Conputer Vision Center Universitat Autonoma de Barcelona Bellaterra 08193, Barcelona, Spain F. de Iorio Hospital Vall d’Hebron, 08035 Barcelona, Spain.
[email protected]
Abstract Wireless capsule video endoscopy is a novel and challenging clinical technique, whose major reported drawback relates to the high amount of time needed for video visualization. In this paper, we propose a method for the rejection of the parts of the video resulting not valid for analysis by means of automatic detection of intestinal juices. We applied Gabor filters for the characterization of the bubble-like shape of intestinal juices in fasting patients. Our method achieves a significant reduction in visualization time, with no relevant loss of valid frames. The proposed approach is easily extensible to other image analysis scenarios where the described pattern of bubbles can be found.
1. Introduction Wireless Capsule Video Endoscopy is a novel and challenging endoscopy technique which has been recently applied in several scenarios, showing successful results [2, 7]. This technology consists of a micro-camera attached to a capsule which is ingested by the patient. The capsule contains a whole illumination set, a battery and a radiofrequency emitter which sends a video signal of its trip throughout the gut to an external device in a typical rate of two frames per second. Once the clinical analysis is finished, the registered video is downloaded into a workstation for its visualization by the specialists. One of the most positive features of this technique relates to the lack of need of any kind of hospitalization or specialized stuff, overcoming most of the main drawbacks related to classical endoscopy, since the patient can lead an ordinary life during the video registration [5]. On the other hand, the major weakness of capsule video endoscopy is reported to be linked to the
high amount of expert time needed for video visualization -typically about 1 − 2 hours-, driving this clinical routine not feasible for certain clinical scenarios [8]. In this sense, the detection of non-useful regions of the video, carrying no clinical information, arises as a helpful alternative. In this work we addressed a novel topic in clinical analysis: the automatic detection of video endoscopy sequences which contain intestinal juices. These sequences are characterized by the presence of a turbid liquid accompanied by bubbles and other artifacts related to the flux of the different secretions into the gut. From these sequences, we automatically labelled as non-valid for analysis those which hindered the right visualization of the gut by means of the total occlusion of the intestinal lumen. We used a bank of Gabor filters [3] for a very accurate characterization of turbid liquid, showing a very low rate of false positives detection. The final result is a relevant reduction of the visualization time by means of the automatic suppression of all non-valid sequences from the video. The explanation of our approach is deployed as follows: Section 2 shows a rapid description of the visual pattern of the intestinal juices which we tackled. Section 3 justifies the application of Gabor filters. Section 4 presents a qualitative and quantitative discussion of our results. Finally, we devote Section 5 to the exposition of our conclusions and future lines of research.
2. Intestinal Juices in Capsule Video Endoscopy In video capsule endoscopy, the good visibility of the intestinal lumen and wall is usually hindered by the presence of intestinal juices mixed up with the remains of food. These intestinal secretions are visualized as a semi-opaque turbid liquid accompanied by the presence of bubbles and other artifacts related to the flux of the different fluids into
the gut. As a result, this turbid liquid is interposed between the camera and the gut, obstructing its right visualization. It presents a wide range of colors from brown to yellow. Its most relevant trait, however, is the presence of a texture pattern consisting of little bubbles of different sizes and quasicircular shape. Figure 1 shows a set of different frames containing intestinal juices. In order to characterize the patterns shown in Figure 1, we tested several alternatives focusing on texture exclusively. Several works have tackled the problem of the characterization of different intestinal events in endoscopy using texture descriptors [4, 6], but as far as we know no previous work has been oriented to the specific issue dealt in this paper. It must be noticed that the size of the bubbles may widely vary inter- and intra-frame, so different strategies based on Laplacian of Gaussian, wavelet analysis, and the use of derivatives of Gaussians and Gabor banks of filters were tested, which have been reported to perform well in multi-scale and directional characterization applications [1]. Our final decision on Gabor filters was based on the better empirical results they presented in all preliminary tests performed over a selected set of frames containing intestinal juices.
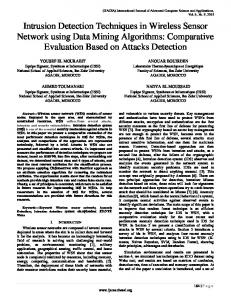
1 1 where σu = 2πσ and σv = 2πσ . In this sense, the Gax y bor function can be pictured as a Gaussian function shifted in frequency to position (u0 , v0 ) -referred to as the Gabor filter spatial central frequency- and at an orientation of tan−1 uv00 . The σx and σy parameters are the standard deviation of the Gaussian envelope along X and Y directions and determine the filter bandwidth. Thus, the set of parameters (u0 , v0 , σx , σy ) completely defines a Gabor filter which is to provide a high response in all those regions of the image showing their energies concentrated near the spatial frequency point (u0 , v0 ). Figure 2 shows the frequency response for 4 directions and 4 different scales for the Gabor filter.
Figure 2. A bank of Gabor filters with 4 different orientations (columns) and 4 different scales (rows) Figure 1. Different frames showing intestinal juices which occlude the visualization field
The different responses shown in Figure 2 present multiple orientations at 0o , 45o , 90o and 135o , which can be observed from left to right. Four different scales are shown from top to bottom.
3 Gabor Filters
4 Results
A Gabor filter can be viewed as a sinusoidal plane of particular frequency and orientation, modulated by a Gaussian envelope. These filters have been shown to possess good localization properties in both spatial and frequency domain and have been successfully applied in multiple tasks such as texture segmentation, edge detection, target detection, document analysis, retina identification, image coding, and image representation, among others [3, 9]. The filter response of a Gabor filter can be written as follows:
In order to test the performance of our Gabor approach in our video database, we used 10 videos from different studios of fasting patients, in which the presence of intestinal juices showing the bubble textured pattern is quite frequent. For the construction of the bank of filters, we used 4 different directions oriented at 0o , 45o , 90o and 135o , using 4 different sigma values of (1, 2, 4, and 8), with an overall result of 16 filters in the bank. The optimal number of directions and scales was obtained throughout an extensive empirical search. It must be noticed that an increase in the number of filters yields to a corresponding increase in the detection of false positives, namely, different structures present in the
H(u, v) =
(u−u0 ) 1 −1[ e 2 σu2 2πσu σv
2
+
(v−v0 )2 2 σv
]
(1)
endoscopic images which are not related to intestinal juices. On the other hand, a decrease in the number of filters yields to a loss in the sensitivity of the bubble detector, and some frames containing more subtle bubbles can be missed. Thus, the above mentioned parameter values are those which best match the bubble pattern in the provided images. Gathering all the single filter responses so as to obtain the global response of the bank of filters, we defined an overall In image as: In =
4 X 4 X
abs{Ini,j }
(a)
(b)
(c)
(d)
(2)
i=1 j=1
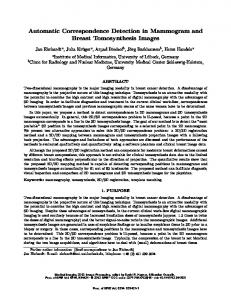
where Ini,j represents the resulting response image of applying the filter with orientation i and scale j over the frame n. Figure 3 renders the original image, the In filter response, and the segmented area of intestinal juices for 4 different sets of frames: a) showing the wrinkles and folds of the intestinal wall, but low presence of bubbles; b) showing intestinal juices covering about 50% of the visualization field; c) intestinal juices covering the whole visualization field, and d) sporadic single bubbles and rests of food. A high response can be observed in the area containing bubbles, independently of their size and distribution -even in the case of single bubbles (d)-. In contrast, those frames which do not show the bubble texture produce a low response image, even when some textural contain, such as wrinkles, or folds of the intestinal walls are present (a). Finally some little pieces of food can be detected by the filter as small single bubbles (see the the little spot on the top of the first frame of Figure 3(d)). The response images were cropped in a 7% using a circular mask which was applied so as to eliminate the typical high response of the filter at the boundary of the field of view. In order to characterize the filter output associated to the bubble pattern, the specialists selected a pool of 100 frames, where the area containing bubbles was delimited by hand, and a random set of 300 frames where no bubbles were present. We applied an exhaustive search over a threshold on In to obtain a binary image defining two exclusively complementary areas in the frame: the region with intestinal juices and the region with no evidence of intestinal juices. The final threshold was searched in an iteratively convergent algorithm which compared the areas obtained by the given threshold value with those described by the specialists. We applied an error function under the criterion of the maximization of the overlap of the region of bubbles defined by the procedure with the region of bubbles defined by the specialists, and the minimization of the area of the wrongly detected regions of bubbles. Finally, we considered as not valid for analysis those frames where the detected region of bubbles was greater than 50% of the useful visualization area, following the spe-
Figure 3. Original image, filter response and segmented area of intestinal juices for 4 different sets of frames (a, b, c and d)
cialists requirements. We run the described method over the testing pool of 10 videos, obtaining the non useful sequences for all of them. For the system validation, we randomly chose 200 frames categorized as valid and 200 frames categorized as non valid, and we provided them to the specialists for visual analysis. Our system obtained an overall result of 98% of agreement in the case of the non valid frames -only 8 out of 200 frames labelled as non valid were wrongly detected by the system- and a 95% of agreement in the case of valid frames -10 out of 200 valid frames were wrongly labelled as containing intestinal juices in shape of bubbles-. The main source of error was detected in one single video where the intestinal walls presented an unusual colored spot-like texture, which underwent a high response in the bank of filters, resulting in a mislabelling of these frames as non valid. Figure 4(a) shows an example of this kind of false positives. The spot-wise texture shown by the intestinal wall leaded the system to consequent mislabelling. Figure 4(b) shows another frame from the same video. In this case, the texture of the intestinal wall is slightly more striped, and the filter response is not high. The contour of the detected area of intestinal juices was over impressed on the original image for comparison purposes. The results on the reduction of the visualization time is shown in Table 1. It can be observed that an overall reduction in visualization time about 23% is achieved. Video5
peaks due to the strange texture present in the intestinal walls, yielding to the specific classification error previously described.This outcome let us develop a rapid visualization tool by means of a binary mosaic. We deployed all the video frames in a sequential way from left to right and top to bottom. Each pixel in the mosaic represented a frame in the video. We colored in dark all those pixels corresponding to non valid frames, rendering in clear pixels all those frames representing valid zones of the video. Thus, the specialist can direct its visualization analysis specifically to the region of valid frames, avoiding the analysis of video sequences with no information due to the presence of occluding intestinal juices. In addition to this, a clear representation of the intestinal juices distribution in video is provided and can be used for further clinical analysis.
(a)
(b)
Figure 4. Examples of (a) false positives and (b) true positives from the same video
Video Video1 Video2 Video3 Video4 Video5 Video6 Video7 Video8 Video9 Video10
Total Number of Frames 27176 28803 27816 38885 17619 27360 29444 12620 25994 27967
procedure was applied, but may be studied as a sound alternative for diverse areas where this type of bubble-shaped texture is to be segmented. One of the main results we present is the substantial reduction in visualization time achieved, which may help to solve one of the main drawbacks associated with capsule endoscopy, namely, the high amount of visualization time needed for each study, avoiding those parts which are not valid for analysis due to the presence of occluding intestinal juices. One of the natural lines of continuation of this work is oriented to the extension of the intestinal juices detector to postprandial cases. In these kind of studies, the presence of rests of food diversifies the typology of the intestinal juices, and their bubble texture evolves to more sophisticated patterns, where color and dynamic behavior get more relevance. Our group is currently working with our team of specialists in order to provide an accurate characterization in this challenging fieldwork, which will be the object of study in futures pieces of research.
Non-valid Frames 7881 3456 4172 9721 8105 5472 5889 3029 5979 4754
(%) Time Reduction 29% 12% 15% 25% 46% 20% 20% 24% 23% 17%
Table 1. Reduction on visualization time after the rejection of the non valid part of the video
5 Conclusion and Future Work In this work we introduced an application of a classic methodology based on the use of banks of Gabor filters for a novel clinical issue such as the automatic detection of intestinal juices in wireless capsule video endoscopy. We proved our strategy to perform well in the characterization of the bubble-shaped texture pattern which intestinal juices present in fasting patients videos. The relevance of this result is not restricted to the clinical environment where our
Acknowledgments This work was supported in part by a research grant from Given Imaging Ltd., Yoqneam Israel, Hospital Universitari Vall d’Hebron Barcelona, Spain, as well as the projects FIS-G03/1085, FIS-PI031488, TIC2003-00654 and MI1509/2005. The technology and methods embraced by this disclosure has been filed for patent protection.
References [1] W. T. Freeman and E. H. Adelson. The design and use of steerable filters. IEEE Trans. Pattern Analysis and Machine Intelligence, 13(9):891–906, 1991. [2] G. Iddan, G. Meron, et al. Wireless capsule endoscopy. Nature, 405:417, 2000. [3] A. Jain, N. Ratha, and S. Lakshmanan. Object detection using gabor filters. Pattern Recognition, 30:295–309, 1997. [4] S. A. Karkanis, D. K. Iakovidis, et al. Computer aided tumor detection in endoscopic video using color wavelet features. IEEE Transactions on Information Technology in Biomedicine, 7:141–152, 2003. [5] J. Kellow, M. Delvaux, F. Aspriroz, et al. Principles of applied neurogastroenterology: physiology motility-sensation. Gut, 45(2):1117–1124, 1999. [6] G. Magoulas, V. Plagianakos, et al. Neural network-based colonoscopic diagnosis using online learning and differential evolution. Applied Soft Computing, 4:369–379, 2004. [7] H. page. http://www.givenimaging.com/. given imaging, ltd. [8] F. Vilarino, L. Kuncheva, et al. Roc curves and video analysis optimization in intestinal capsule endoscopy. Pattern Recognition Letters, 27, 2006. [9] F. Vilarino and P. Radeva. Patch-optimized discriminant active contour for medical image segmentation. Iberoamerican Congess on Artifitial Intelligence 2002, pages 100–105, 2002.