Sep 18, 2009 - propose a menu customization system that ranks functions so as to .... 1) We define a feature vector for each function and propose an algorithm ...
Automatic Mobile Menu Customization Based on User Operation History Yusuke Fukazawa1, Mirai Hara1, Masashi Onogi1, Hidetoshi Ueno1 1
NTT DOCOMO, Inc. NTT DOCOMO R&D Center, 3-6 Hikari-no-oka, Yokosuka-shi, Kanagawa, 239-8536 JAPAN +81-46-840-3810
{fukazawayuu, haramir, onogi, uenohi}@nttdocomo.co.jp ABSTRACT Mobile devices are becoming more and more difficult to use due to the sheer number of functions now supported. In this paper, we propose a menu customization system that ranks functions so as to make interesting functions, both frequently used functions and rarely used functions, easy to access. Concretely, we define the features of phone functions by extracting keywords from the manufacturer's manual, and propose the method that ranks the functions based on user operation history by using Ranking SVM (Support Vector Machine). We conduct a home-use test for one week to evaluate the efficiency of customization and the usability of menu customization. The results show that the average rank of used functions on the last day of the test is half of that of first day and almost 70 % of the users are satisfied with the ranking provided by menu customization and the usability of menus. In addition, interviews show that automatic mobile menu customization is more appropriate for mobile phone beginner rather than the master users.
Categories and Subject Descriptors H.3.1 [Content Analysis and Indexing]: Indexing method; H.3.3[Information Search and Retrieval]: Information filtering;Relevance feedback; H.5.2 [User Interfaces]: Screen design.
General Terms Experimentation, human factors, performance.
Keywords Mobile menu, Personalization, Recommendation, SVM, Support Vector Machine
1. INTRODUCTION In recent years, mobile terminals have acquired many useful functions. For example, the user can access Internet information
via the 3G network, watch TV on one-segment broadcasting, access transaction services via RF-ID Tags: the mobile phone now occupies the central position in the ubiquitous society. Given the sheer number of functions, however, it has become hard to navigate using the standard menu. There are a couple of problems; one is that the user must enter multiple clicks even if the function desired is used frequently. The other is the difficulty of finding never or rarely used functions. There are several techniques that can make it easy to access frequently used functions such as short-cuts. The user can manually create shortcuts on the desktop to access the frequently used functions. This functionality can be found almost all phones sold by NTT DOCOMO, Inc. in 2008. Windows Mobile phones can create short-cuts to recent used functions automatically; they are placed on top of the famous start menu. Split Menus[1] improves the hit rate by dividing the menu into two sections and placing frequently used items at the top of the menu. There remains, unfortunately, little support to access rarely used functions or functions that have never been used. The following proposal is only tangentially related to the mobile phone menu, but Akinaga[2] proposed a method of recommending unknown software functions based on collaborative filtering. However, collaborative filtering raises privacy issues(details are described in 1.1). In addition, a recommendation menu has to be used in addition to the basic menu, which makes the user's task too difficult on mobile phone’s small display. In this paper, we propose an automatic menu customization system that allows users to access both frequently used functions and rarely used functions in one list of functions (menu). Concretely, we design a heuristic function that evaluates the importance, to the user, of used phone functions from the viewpoints of both frequency and how recently the functions were used. We then calculate the user’s preference vector which ranks used functions by their importance. Finally, we rank all functions using user’s preference vector. This ranking of functions can allow the user to access not only important functions but also functions that have not been used but have similar characteristics to the important used functions.
1.1. Approaches Copyright is held by the author/owner(s). MobileHCI09, September 15 - 18, 2009, Bonn, Germany. ACM 978-1-60558-281-8/09/09.
The collaborative filtering method proposed by Akinaga which is well known in the field of recommendation algorithms[3], can be adapted to output the functions that user can be assumed to be interesting to the user. Amazon.com is famous for its use of
collaborative filtering to create recommendations of items based on the items purchased, viewed, and/or commented on. However, collaborative filtering needs to use the histories of other users to estimate the prediction values of phone functions. This is a problem when we implement such an algorithm in a mobile phone from the view point of the privacy issue. That is because we have to upload user histories from the phones to a third party’s server to generate recommendations. In addition, collaborative filtering has cold-start problem, and lots of user’s history is needed to produce high quality of recommendations. Therefore, we do not adopt collaborative filtering. We take the approach of the content-based recommendation method. In this approach, we first define a feature vector for each function, and then calculate, by using a machine learning technique, the user’s feature vector based on the functions employed by the user. This paper makes three major contributions: 1) We define a feature vector for each function and propose an algorithm based on Ranking SVM to rank phone functions. 2) We design three menu prototypes that well present ranked functions. 3) We conduct a home use test to investigate the usability of automatic menu customization. In the next section, we define the feature vector and then describe the method of ranking functions. In Section 3, we describe menu designs. In the Section 4, we describe the results of the home use test.
2. Ranking method of mobile functions
Feature Vector call
access send
save
TV
Videophone
1
0
0
0
1
Mobile TV
0
1
0
0
1
functions Bookmark
0
1
0
1
0
Message
0
0
1
0
0
Text memo
0
0
1
1
0
2.2. Ranking Functions using Ranking SVM This section describes how we rank the functions according to the user’s operation history. First, we design a heuristic function that evaluates the importance, to the user, of used phone functions from the viewpoints of frequency and how recently they were used as follows: 1 ( RankbByRecencyi + RankByFrequencyi ) (2) 2 where RankByRecencyi and RankByFrequencyi represent the rank of function i in recency order and the rank of function i in frequency order among all functions the user has used. If there is a tied rank, Midrank[8] is used to calculate RankByRecencyi or RankByFrequencyi. Midrank is given by the average rank of the set of functions that have the same value, RankByRecencyi or RankByFrequencyi, as function i. We rank the functions by Hi in ascending order. This rank represents the user’s preference for functions, which can be represented as follows. Hi =
P = {x1 ,..., x k } | k ≤ n
2.1. Definition of feature vector for each function In this section, we define the feature vector used to assess each function. We first extract descriptions about each function from the phone manual, and then transform the extracted descriptions into a representation suitable for the learning algorithm (feature vector). In this paper, we represent feature vector xi of function i as follows:
x i = ( xi ,1 , " xi , j " , xi ,m ) | i = 1, ⋅⋅⋅, n
Table 1 Feature vector example of functions
(1)
where m and n represent the number of elements of the feature vector and the number of functions, respectively. Feature vectors in the field of text categorization are usually based on a set of nouns extracted from texts or documents; examples include Web Mining[5] . In the case of phone functions, each function has fewer descriptions and there are insufficient feature nouns to clearly differentiate the functions. For example, the functions “Phone call” “Redial” “Contact List” have similar feature words such as “contact”, “phone”, etc. As functions have different goals, we base the feature vectors of functions on verbs in addition to nouns extracted from descriptions. This approach can better represent the features of functions. For example, the differences among the functions “Phone call”, “Redial”, and “Contact List”, are well represented by verbs like “call”, “search”, “register”. From the manual of a Windows Mobile phone, we extracted the descriptions of 100 functions. From these descriptions we extracted 428 nouns and 74 verbs. Table 1 shows typical feature vectors.
(3)
where k represents the rank of functions in the user’s preference list P. Consider the following example; the user browsed the Internet from bookmarks twice at 9:00 and 10:00, sent a message at 8:00AM and watched TV on her mobile once at 11:00AM, all on the same day. The heuristic function becomes Hbookmark=(2+1)/2=1.5, Hmessage=(3+2.5)/2=2.75 and Hmobiletv=(1+2.5)/2=1.75. Therefore, the user’s preference list, P, can be represented as follows, see Table 1. P = {bookmark , mobileTV , message}
= {( 0,1, 0,1, 0 ) , ( 0,1, 0, 0,1) , ( 0, 0,1, 0, 0 )}
(4)
Next, we use the Ranking SVM (Support Vector Machine)[6] to calculate the user’s preference vector which satisfies the ranking given by P. The solution of the Ranking SVM can be described as the solution of the following optimization problem. 1 minimize: V (w, ξ ) = w ⋅ w + C ∑ ξi 2 subject to:
w ⋅ x1 ≥ w ⋅ x 2 + 1 − ξ1 ⋅⋅⋅ w ⋅ x k −1 ≥ w ⋅ x k + 1 − ξ k
(5)
∀i : ξi ≥ 0 where ξi is the slack variable; it represents a penalty weight when the inequality between function j and function j-1 (j≤k) is not satisfied. This optimization problem can be converted into an ordinary SVM (Support Vector Machine) [7] problem by replacing w*yj by w*xj-1 – w*xj.
Next, we obtain the ranking of functions based on the calculated user preference vector w. We calculate the product S(xi,w) of the preference vector and the feature vector for all functions. (6)
S (xi , w ) = xi ⋅ w The product values are then ranked in descending order .
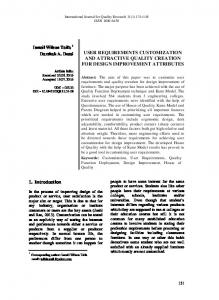
Here, if w is calculated to be (0,1,0.3,0.8,0.5), the S for each function become as follows: Videophone:0.5, Mobile TV:1.5, Bookmark:1.8, Message:0.3, Text memo:1.1. The ranking of functions becomes Bookmark, Mobile TV, Text memo, Videophone and Message. Figure 1 illustrates the concept of the 2.Calculate user preference vector above flow.
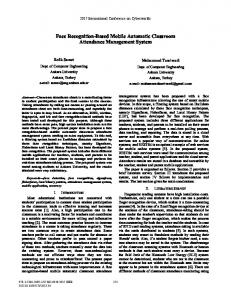
4.1. System architecture We show the system architecture of menu customization in Figure 3. This application consists of the user interface and ranking engine. User interface requests menus to ranking engine by sending the operation history. The ranking engine responds with the ranked menus as described in Chapter 2. The request of the menu occurs once a day in nighttime (2:00 – 3:00 AM). That is, menu customization is occurred once a day and user cannot feel different in a day time. Ranking Engine
using ranking SVM
8:00
Message
9:00
Bookmark
10:00
Bookmark
11:00
mobileTV
Bookmark
SVM Engine
mobileTV History Data
1.Rank functions in history
Get History
Text memo
Bookmark Message
Text Memo Video phone
Used Unevaluated
3.Rank functions using user preference vector using Ranking SVM
Message
Figure 1 Flow of ranking of functions
3. Menu Design We have designed three types of menu that well express the ranking of functions. In the first type, we list the functions according to their rank as shown in Figure 2(Type1). In this case, the list is “Mail”, “video phone”, “Comm Manager” etc. In the second and third type, we represent the rank of functions twodimensionally. In the second type, rank is represented by clickable button size. The higher the rank of the function, the more hexagons are used to represent it as shown in Figure 2(Type2). In the third type, we represent the rank by the depth of the button. The higher the rank of the function, the more the button comes to the front as shown in Figure 2(Type3).
Type1
type2
Menu Update
Figure 3 Architecture of menu customization system
VideoPhone
Mobile TV
User Interface
Build Menu
Function Feature Data
JG w
Menu Data
Type3
Figure 2 Three menu designs
4. Evaluation We conducted a home-use test to evaluate the efficiency of mobile menu customization. This chapter outlines the user test, its results, and our analysis of the results.
4.2. Outline of Home Use test
We conducted a home use test from 2009/Jan./10th to 2009/Jan/16th. The test involved a total of 20 people ranging in age from 20 to 30; 10 were male and 10 were female. All were using a Windows Mobile phone on a daily basis. We implemented mobile menu customization on Windows Mobile 6.1, the terminals were HT-01A and HT-02A, which are NTT DOCOMO’s brand new mobile phones. We requested each subject to use both our implemented prototype and their own phone on a daily basis. We evaluated the following four points in this user test; 1) How many interesting functions, which were unknown before the test, could be found during the test. 2)How well did the ranking of the menu suited the user? 3) What types of users would like to use mobile menu customization? 4) Which menu design well suits the automatic menu customization system?
4.2.1. Log analysis As for evaluation points 1) and 2), we analyzed the user’s usage log data. As for evaluation point 1), we counted the number of newly used functions. We define the functions that were firstly used during the test as newly used functions. Figure 4 shows the transition in the number of newly used functions. As can be seen from the figure, the average user could find 3 to 4 new functions between 10/Jan. and 15/Jan. These results show that the proposed customized menu makes it easier for users to access both frequently used functions and rarely used functions, which may be interesting. The reason why the number of newly used functions decreased after 16/Jan. is that the menu had become fully customized and there were few opportunities to find unknown functions at the top of the menu after 16/Jan. As for 2), we calculated the average rank of functions used each day by the 20 users. This value shows the difference between the user’s ideal ranking and current ranking. The smaller the value becomes, the closer the proposed ranking is to the ideal ranking. Figure 4 shows the transition in average ranking of functions used during the test. As can be seen from Figure 4, the average decreased over the period of the test. The average rank at the last
day is half of that of the first day. This means that the proposed ranking of functions works well and that the user did not need to go to the bottom of the menu to find the function desired. 12.0
Total Num of newly used functions
10.0
Average rank of used functions
16 14 12 10
Type1
8
Type2
6
Type3
4
8.0
2 0
6.0
Friendly
Good Impression
4.0
Good design
Easy to operate
Total
Figure 6 Comparison of menu designs
2.0
5. Conclusion 16
15 20
09
/1 /
/1 /
14
20 09
/1 / 20 09
/1 /1 3 20 09
/1 2
/1 1
20 09 /1
/1 09 /1 20
20 09 /1
0
0.0
Figure 4 Transition in average rank of used functions and number of newly used functions
4.2.2. User interview As described in the previous section, we confirmed that the proposal menus are well personalized to the users. However, we are anxious that changing menu dynamically sometimes make user confused. To confirm if the changes made to the menu confused the user, we interviewed the test users. As can be seen from Figure 5, almost 70 % of the users were satisfied with menu customization and the usability of the menus. 1
2 4
3
1
4
Excellent Good Adequate
4
1
Poor Unacceptable
9
Do you feel mobile menu are customized to fit you during the home use test?
11
How was the usability of automatic menu customization?
Figure 5 User interviews about menu customization Remaining 30% of users who scored the menu poor or unacceptable pointed out that they were used to making shortcuts by themselves and did not want the menu to be automatically optimized. These users had already mastered Windows Mobile phones, and want to customize the phone by themselves. Considering these interview results, this automatic customization service should target the beginner users, i.e. those not accustomed to using Windows Mobile phone.
4.2.3. Comparison of menu design Figure 6 shows the comparison of menu types proposed in Chapter3. Type 1 is similar to the ordinary phone sold by NTT DOCOMO; it was rated by the subjects as friendly and easy to operate. On the other hand, the subjects preferred Type2 and Type3 from the view point of impression and design. Some subjects commented that they felt Type 2 was like a game and it was fun to find which functions covered the biggest area through customization. This suggests that the metaphor approach may work well in allowing some users to get used to automatic menu customization.
In this paper, we proposed an automatic menu customization system that automatically ranks functions based on the user’s operation history. We conducted a home use test for one week to evaluate the efficiency of customization and the usability of menu customization. The results show that the average rank at the last day is half that of the first day (menu quality was improved), and almost 70 % of the subjects were satisfied with the rankings provided by menu customization and the usability of the menus. From interviews, we found that automatic mobile menu customization is most appropriate for mobile phone novices rather than masters who have been using the mobile phone for a long time. The next prototype will target automatic menu customization based on not only operation history but also the user’s situation.
References [1] A. Sears, B. Shneiderman, Split Menus: Effectively Using Selection Frequency to Organize Menus, ACM Trans. on Computer-Human Interaction, Vol. 1, No. 1, pp.27-51, 1994. [2] T. Akinaga, N. Ohsugi, T. Kakimoto, M. Tsunoda, A. Monden, K. Matsumoto, Recommendation of Software Technologies Based on Collaborative Filtering, In Proc. of the 12th Asia-Pacific Software Engineering Conference, 2005. [3] B. M. Sarwar, G. Karypis, J. A. Konstan, and J. Riedl, Itembased collaborative filtering recommendation algorithms, In Proc. of the 10th International World Wide Web Conference, 2001. [4] M.F. Caropreso, S. Matwin, F. Sebastiani, A learnerindependent evaluation of the usefulness of statistical phrases for automated text categorization, Text Databases and Document Management: Theory and Practice, 2001. [5] M. Perkowitz, M. Philipose, K. Fishkin, and D.J. Patterson, Mining models of human activities from the web, In Proc. of the 13th International World Wide Web Conference, 2004. [6] T. Joachims, Optimizing Search Engines Using Clickthrough Data, In Proc. of International Conf. Knowledge Discovery and Data Mining, ACM Press, pp.132-142, 2002. [7] V. Vapnik, Stastical Learning Theory, Jon Wiley & Sons, 1998. [8] J. I. Marden: Analyzing and Modeling Rank Data, Vol. 64 of Monographs on Statistics and Applied Probability, Chapman & Hall, 1995.