Sameer Raj Maskey, Julia Hirschberg. Department of Computer .... the importance of the segment we can have a bin of size (max - min) = 5. 3.1.2. Length.
Automatic Summarization of Broadcast News using Structural Features Sameer Raj Maskey, Julia Hirschberg Department of Computer Science 450 Computer Science Building Columbia University New York, NY, 10027 {smaskey,julia}@cs.columbia.edu
Abstract We present a method for summarizing broadcast news that is not affected by word errors in an automatic speech recognition transcription, using information about the structure of the news program. We construct a directed graphical model to represent the probability distribution and dependencies among the structural features which we train by finding the values of parameters of the conditional probability tables. We then rank segments of the test set and extract the highest ranked ones as a summary. We present the procedure and preliminary test results.
1. Introduction Most recent research on speech summarization [1, 3, 4] has assumed an automatically recognized transcript, on which a variety of text summarization techniques are then employed. For example, [1] has used statistical methods to extracts words to include in the summary, based upon linguistic features of the transcribed text, while [3] has used lexical extraction methods to hypothesize headlines for news programs. However, such methods are necessarily limited by the quality of the speech transcription itself. In this paper, we propose an alternative approach to speech summarization which relies instead upon structural information about the speech ‘document’, expanding upon the domaindependent summarization proposal of [2]. Our proposed method relies not upon the lexical content of a transcript, but rather upon structural features of the audio document itself, and thus can handle transcripts with a high word error rate, which would be problematic for methods relying upon linguistic features. An additional advantage of our method is that it permits the construction of spoken summaries, from portions of the original speech. In Section 2 we briefly describe the news corpus we train and test on. In Section 3 we present an overview of our system. In Section 3.1 we describe the features we currently use. In Section 3.2 we describe the graphical model we train on these features. In Section 4 we describe some preliminary testing and its results. We conclude in Section 5 and describe future research directions.
2. The Corpus The corpus used in the current study is drawn from the NIST TREC–7 SDR corpus, a subset of the DARPA HUB-4 Broadcast News corpus, and includes twelve news broadcasts from the program “All Things Considered.” Each broadcast is approximately 30 minutes long, and has been hand-segmented into
speaker turns. We manually annotated these broadcasts, marking segments we thought should appear in summaries. While speaker turn segmentation is non-trivial, considerable research in this area suggests that it is reasonable to assume a reasonably accurate automatic segmentation will be available for Broadcast News [5, 6, 7]. We divided the data into six training and six test programs.
3. System Overview 3.1. Structural Features Our motivation in using structural features to identify segments important to include in a summary follows [2]’s intuition that, in domains like Broadcast News, the material to be summarized exhibits fairly regular patterns from one speech document to another. For example, news broadcasts generally open with a news anchor’s introduction of the major news stories to be presented in the broadcast, followed by the actual presentation of those stories by anchor, reporters, and possibly interviewees. Broadcasts are usually concluded in a fairly conventionalized manner, depending upon the conventions of the particular news program. [2] took advantage of the fact that there is a reliable correspondence between these structural aspects of news broadcasts and the type of the speaker in different segments, i.e., anchor, reporter, or interviewee. Their goal was to provide an overall outline of the broadcast by identifying such speaker types, so that the program as a whole could be browsed effectively. They found that lexical as well as structural characteristics of news transcripts (both hand transcriptions and speech recognition output) provided useful predictors for classifying speaker type. The structural information we use in our current model, however, does not depend upon the identification of speaker type explicitly, but takes advantage of the fact that structural information about the length, position, and overall distribution of speakers’ turns — speech segments containing input from a single speaker — can be used directly to select likely candidates for inclusion in a summary of the newscast. The structural information we currently make use of includes the length of each speaker turn or segment, the position of the segment in the overall broadcast, and a calculation of speaker type based upon the distribution and length of all of a given speakers’ turns in the broadcast. Note that, unlike [2], we do not need to identify ’type’ in terms of the role a speaker plays in the broadcast, i.e. anchor or reporter or interviewee. Thus we do not rely upon the lexical cues which [2] has found important in signaling turns of these different classes of speaker. Instead, we assume that we can extract speaker information from the corpus using tech-
niques such as those developed by [5, 6, 7]. We extract values for the following features for each segment: 3.1.1. Position The feature ’segment position’ (pos) identifies the location of the segment in the overall news broadcast. The motivation for this feature is the observation that, in the first few segments of a broadcast, an anchor generally summarizes what will be discussed in detail in the program. To accommodate our graphical model, described in Section 3.2, we must discretize our positional feature. We assign ranges of values of the distribution in a particular bin. For example, if we have 100 segments in the broadcast news, for the position values of segments 0 to 5 of the broadcast we assign them to a bin 0-5%, that is first 5. We can increase or decrease the minimum and maximum of each bin as we need. For example, if we think there isn’t much difference in importance of news in segments occurring at 50 and 65 then we can have a bin of (max - min) = 15. But for the beginning of news where we think even a slight variation in position might effect the importance of the segment we can have a bin of size (max min) = 5. 3.1.2. Length The feature ’segment length’ (len) represents the length in seconds of the segment. Our motivation in including this feature is twofold: On the one hand, very long segments will probably not be useful to include in a summary, simply for concerns about providing over-long summaries. On the other hand, very short segments are perhaps less likely to contain useful information for the summary. 3.1.3. Speaker The feature ’segment speaker’ (spkr) does not represent the actual identity of the segment’s speaker, as noted above, but rather represents a measure of the overall contribution of the speaker to the broadcast. For each speaker in a given broadcast we calculate the frequency of occurrence of speaker segments and the deviation of this number from the mean for all speakers in the broadcast. We then rank speakers according to the sum of the frequency and the deviation. Our intuition for constructing this metric is that, following [2], we note also that anchors generally contribute most segments distributed evenly through the broadcast, with individual reporters ranking next, and interviewees contributing less. We hypothesize that segments of those who are thus more ’important’ to a broadcast may very likely be more important to include in a summary. 3.1.4. Previous and Next Speaker The features ’previous speaker’ (pspkr) and ’next speaker’ (nspkr) are motivated by our observation of common interactions in news broadcasts that appear important to model in selecting good segments for a summary. For example, we note that, when an anchor introduces a news stories, that introductory segment is generally followed by a segment spoken by a reporter. The introductory segment thus may serve effectively to summarize the subsequent news. Modeling the sequence of segments in terms of our measure of the overall ’importance’ of the speaker thus can capture such information.
3.1.5. Length of Previous and Next Segment The features ’length of previous segment’ (plen) and ’length of next segment’ (nlen) help us differentiate between planned, unplanned, formal and informal speech in news broadcasts. For example, dialogs between anchor and reporter or reporters’ interviews are generally signaled by a sequence of short segments. These features thus allow us to give less weight to such dialogs, since they seem less likely to contain vital information for summarization. These features thus capture the structure of the broadcast in terms of the length, position, and distribution of different speakers’ segments in the program. Additional structural information might be found by looking at typical musical themes played to introduce different parts of the broadcast or commercials. 3.2. Bayesian Network 3.2.1. Representation Given our training data annotated for likely segments to include in a summary and our set of structural features, we want to build a graphical model that will allow us to rank segments in any news broadcast according to their importance for inclusion in a summary. For this purpose we have chosen to use Bayesian Networks (BN). Bayesian Networks are directed acyclic graph where nodes represent random variables and the absence of arcs represents conditional independence, i.e., that a node is independent of its non-descendants, given its parents. Bayesian Networks can also be viewed as representing a factorization of joint probability into the product of a set of conditional probabilities. Given a BN G = {X, E} where X = {x1 , x2 , ..., xn } are nodes and E = {(xi , xj ) : i 6= j} are arcs, we can factorize the joint distribution over all the variables into the product of local terms as follows: n
P (x1 , x2 , ..., xn ) =
P (xi |πxi )
(1)
i=1
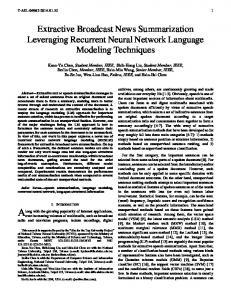
where πxi are parents of node xi and P (xi |πxi ) is the conditional distribution of xi , given its parents πxi . Nodes in BN can be continuous or discrete values. Since we discretized the values for our features we get Conditional Probability Tables (CPTs) at each node which lists the probabilities that a child node takes on each of its possible (multinomial) values, given the combinations of values of its parents. The associated tables for the nodes without parents gives the prior probabilities instead of the conditional ones. For our summarizer we implemented a BN whose structure is shown in Figure 1. We have seven nodes for our seven different features, as discussed in Section 3.1. The (in)dependencies included in the network, represented as x–y, where y is a parent of x, are as follows : position(x1 ), speaker(x3 ) – turn length(x2 ); position – speaker; speaker – previous speaker(x6 ); speaker – next speaker(x7 ); turn length, previous speaker – previous turn length(x4 ); turn length, next speaker – next turn length(x5 ). 3.2.2. Learning and Inference We can learn both the graph topology (structure) and the parameters for each CPT from the given data. In our case we learn the parameters of the CPT and manually find the graph topology, as there are only seven nodes. Given the topology shown in Figure 1, we only need to find values of the parameters of the CPT.
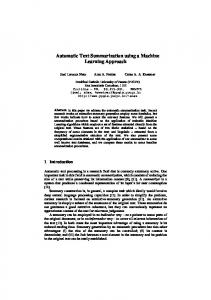
extracted the top 10%. Similarly, we manually extracted segments from broadcast news that represented best summary of the broadcast news of our test news broadcast. Again, we limited ourselves to 10% of all the segments of the news. Then we calculated the number of overlaps between the segments extracted by the summarizer and the segments extracted manually. We found that overlap varied between 25% to 80% of segments. These results are presented in Figure 2.
plen
len
nlen
pos
pspk spk nspk
Extracted Segments and its Overlap with Manual Segments 12 Automatic Extraction Manual Extraction
Figure 1: Bayesian Network for Automatic Summarizer
10
θ(xi , πxi ) =
m(xi , πxi ) m(πxi )
(2)
where m(xi , πxi ) represents the number of times the node and its parents are jointly in a particular configuration and m(πxi ) represents the number of times the parents are in that configuration. Such counts are sufficient for our purpose because our nodes are multinomial variables. For our summarizer we computed CPTs for each node in Figure 1, yielding total table entries of 3∗(4∗72 )+2∗(42 )+7+ 7 ∗ 4 = 655 — since four features can take one of seven values and three can take on one of four values. A simple probability table for the model with each feature represented as a separate dimension would have produced a 153664-cell table (74 ∗ 43 = 153664) and would have been very hard to estimate. Given xi as defined in Section 3.2.1, the joint probability distribution for our broadcast news summarizer is computed by Equation 3. P (x1 , ..., x7 )
=
P (x1 )P (x3 |x1 )P (x2 |x1 , x3 )P (x6 |x3 ) P (x7 |x3 )P (x4 |x2 , x6 )P (x5 |x2 , x7 ) (3)
We can now compute the probability of how ’good’ a segment in our news corpus is for inclusion in the summary by using Equation 3 to score each segment according to the particular values it has for each of our features. We use the resulting score to rank each segment in the newscast and then extract the highest N% to be included in the summary, depending upon our target compression ratio.
4. Evaluation and Results Using this procedure, we trained our model on the six manually summarized news broadcasts, as described in Section 2. In each broadcast, we had identified 10% of the total number of segments to include in a summary, resulting in about 70 segments which represented “good” segments for summary inclusion. For these 70, we extracted values for each of our feature from each of the segment. We built the probability table for each node of our network to obtain the model. We tested the model with on six broadcasts of our test set. For each trial we ranked segments using our summarizer and
8 Number of Segments
This makes our problem one of the learning cases of BNs — Known Structure with Full Observability. For such cases, we can estimate the parameters of the CPT by finding Maximum Likelihood Estimates (MLE). If we let θi be a parameter vector for the CPT of node xi and define θ(xi , πxi ) = P (xi |πxi , θi ) then we find parameter values using MLE as follows:
6
4
2
0
1
2
3
4
5
6
Trials
Figure 2: Results - Overlap in segments extracted manually and automatically. We also evaluated our model by measuring the amount of overlap in the number of topics (stories) covered by the segments extracted manually and by our automatic summarizer. In many cases, there are segments in the news that appear to represent a particular topic for the summary equally well, but which are different from the ones chosen manually. Hence, if our summarizer picks a segment which represents the summary of broadcast news but does not overlap with the exact manually extracted segment describing the same topic, a more generous evaluation metric would not penalize the summarizer for selecting what might seem an equivalent choice. Hence, for testing purposes, we manually labeled each “good” segment with the “topic” areas (stories) to which topic it belonged. So, we were able to measure the number of topics that overlapped in segments obtained manually and automatically. The results for topic overlap is shown in Figure 3. To obtain a combined measure of the overall accuracy of the summarizer, we combined the metrics described above for exact and topic only overlap in the following equation. Score = w1
T opicOverlap SegmentOverlap + w2 (4) T otalSegments T otalSegments
This metric takes into account the fact that extracted segments which might have no segment overlap might still represent a good summary if they cover the topics included in the manually chosen segments. By this measure, if the automatically extracted segments are identical to the manually chosen segments, segment overlap is 0.5 and topic overlap 0.5, yielding 100% accuracy. If there is no segment overlap, the equation still gives the summarizer some credit for identifying segments from the correct topics in the overall score. And if none of the segments
Topic Overlap with Manual Segments’ Topic 10 Automatic Extraction Manual Extraction 9
8
“goodness”. Such features, as well as acoustic features, may permit us to develop separate statistical models to use in cotraining our summarizer to provide additional, automatically labeled data, or to employ a voting mechanism among the three models.
Number of Segments
7
6. Acknowledgments
6
We would like to thanks Tony Jebara for useful discussions. The work reported here was supported in part by the Defense Advanced Research Projects Agency under TIDES grant NUU0100-1-8919. Any opinions, findings, or recommendations are those of the authors and do not necessarily reflect the views of the funding agencies.
5
4
3
2
1
0
7. References [1]
Figure 3: Overlap in topics (stories) in the segments extracted manually and automatically.
Hori, C., Furui, S., Malkin, R., Yu, H. and Waibel, A. ”Automatic Speech Summarization Applied to English Broadcast News”, HLT2002 Conference, March 2002, p 241
[2]
Barzilay, R., Collins, M., Hirschberg, J., and Whittaker, S., ”The Rules Behind Roles: Identifying Speaker Role in Radio Broadcasts”, AAAI/IAAI 2000: 679-684
Table 1: Overall score for trials obtained from Equation 4.
[3]
Jin, R., Hauptmann, A., “Title Generation for Spoken Broadcast News using a Training Corpus”, ICSLP 2000 - 6th International Conference of Spoken Language Processing (Interspeech 2000),Beijing, China, October 1620, 2000
[4]
Koumpis, K., Renals, S., “Transcription and Summarization of Voicemail Speech”, Proc. ICSLP 2000, Beijing, vol. 2, pp 688-891 (2000).
[5]
Huang, Q. Liu, Z., Rosenberg, A., Gibbon, D., and Shahraray, B., “Automated generation of new content hierarchy by integrating audio, video, and text information”, Proceedings of ICASSP-1999, 1999.
[6]
Couvreur, L., and Boite, J.-M., “Speaker tracking in broadcast audio material in the framework of the THISL Project,” Proceedings of the ESCA ETRW Workshop Accessing Information in Spoken Audio, 1999.
[7]
Chen, S., and Gopalakrishnan, P., “Speaker, environment and change detection and clustering via the Bayesian information criterion,” Proceedings of the DARPA Broadcast News Transcription and Understanding Workshop, 1998.
1
2
3
4
5
6
Trials
Trial 1 2 3 4 5 6
Overall Score 0.2679 0.8000 0.6250 0.2679 0.4375 0.6000
or topics overlap, then the overall score is 0. Table 1 shows the results we obtained by measuring our results by this method. Table 1 shows that our overall score is somewhat higher than one obtained by measuring simple segment overlap. Also, the average of the overall score is 0.4997 which represents the “accuracy” of our summarizer in terms of required topic coverage and segment overlap.
5. Conclusions and Future Research This paper has presented an alternative approach to speech summarization of broadcast news, using structural features that have not been explored before in the context of broadcast news speech summarization. Our probabilistic approach using structural features helps to make our summarizer robust to recognition errors that would be found in an automatic speech recognition transcript. All that our method requires is the segmentation of programs into speaker turns; techniques for this have been developed previously in research on speaker segmentation. As yet, we have only modest success in predicting useful components of a summary. However, more data we believe will improve our performance. Since the output of our summarizer will be concatenated segments of the original speech itself, however, we will need to be concerned with how to concatenate segments from very different portions of a broadcast, and segments from different speakers, to form a coherent summary. This will be part of our continuing research. Other aspects of future research include exploring additional features, possibly orthogonal to our structural features, such as lexical and linguistic cues to segment