I want to thank John Mellor-Crummey for bringing me to Rice and for always being available, even when it meant giving feedback on a paper or writing a rebuttal.
RICE UNIVERSITY
Automatic Tuning of Scientific Applications by Apan Qasem A Thesis Submitted in Partial Fulfillment of the Requirements for the Degree Doctor of Philosophy Approved, Thesis Committee:
Keith D. Cooper, Chair Professor and Chair, Computer Science
Kenneth W. Kennedy, Director Ann and John Doerr University Professor, Computer Science Deceased
John Mellor-Crummey Associate Professor, Computer Science
Matteo Pasquali Associate Professor, Chemical and Biomolecular Engineering
Mike Fagan Research Scientist, Computer Science
Houston, Texas July, 2007
Automatic Tuning of Scientific Applications Apan Qasem
Abstract Over the last several decades we have witnessed tremendous change in the landscape of computer architecture. New architectures have emerged at a rapid pace with computing capabilities that have often exceeded our expectations. However, the rapid rate of architectural innovations has also been a source of major concern for the highperformance computing community. Each new architecture or even a new model of a given architecture has brought with it new features that have added to the complexity of the target platform. As a result, it has become increasingly difficult to exploit the full potential of modern architectures for complex scientific applications. The gap between the theoretical peak and the actual achievable performance has increased with every step of architectural innovation. As multi-core platforms become more pervasive, this performance gap is likely to increase. To deal with the changing nature of computer architecture and its ever increasing complexity, application developers laboriously retarget code, by hand, which often costs many person-months even for a single application. To address this problem, we developed a software-based strategy that can automatically tune applications to different architectures to deliver portable high-performance. This dissertation describes our automatic tuning strategy. Our strategy combines architecture-aware cost models with heuristic search to find the most suitable optimization parameters for the target platform. The key contribution of this work is a novel strategy for pruning the search space of transformation parameters. By focusing on architecture-dependent model parameters instead of transformation parameters themselves, we show that we can dramatically reduce the size of the search
iii space and yet still achieve most of the benefits of the best tuning possible with exhaustive search. We present an evaluation of our strategy on a set of scientific applications and kernels on several different platforms. The experimental results presented in this dissertation suggest that our approach can produce significant performance improvement on a range of architectures at a cost that is not overly demanding.
iv
Acknowledgements
“We are here to help each other get through this thing, whatever it is” - Mark Vonnegut It has been a long journey and there are many people to thank. I am deeply indebted to Ken Kennedy who had been my mentor in my academic life, and on occasion, in my personal life. Ken was a remarkable man of extra-ordinary vision and it was a privilege for me to have known him. As an advisor, he had that rare quality of getting his students to do their best without ever being demanding. This dissertation would not have been possible without his support (financial and otherwise) and guidance. I want to thank John Mellor-Crummey for bringing me to Rice and for always being available, even when it meant giving feedback on a paper or writing a rebuttal at three in the morning on a weekend. John’s work ethic and enthusiasm for the field has been a source of constant inspiration and that is something that will stay with me for years to come. I have been fortunate to have many great teachers and mentors during my undergraduate and graduate years. I want to thank David Whalley at Florida State for encouraging me to pursue a Ph.D. and Alan Zaring at Ohio Wesleyan for discouraging me. I want to thank Keith Cooper for being supportive and providing some much-needed reassurance at a very difficult time towards the end of my degree. My committee members, Matteo Pasquali and Mike Fagan gave valuable suggestions for improving my thesis. Rice has been a wonderful place to pursue my Ph.D. Graudate students and research staff in the compilers group provided a stimulating and congenial work en-
v vironment. I am grateful to Daniel Chavarr´ıa-Miranda, Yuan Zhao, Cristian Coarfa, Yuri Dotsenko, Gabriel Marin, Cheryl McCosh, Arun Chauhan, Tim Harvey, Anirban Mandal, Nathan Tallent, Jason Eckhart and Gouhua Jin for helping me with my research at various stages. The support staff in the Computer Science department have been extremely helpful. I want to thank Penny Anderson for helping me with conference travels and always finding me a slot in Ken’s busy schedule. Darnell Price, Iva Jean Jorgensen, BJ Smith and Bel Martinez have helped with numerous administrative matters. I am grateful to my parents who taught me to appreciate the importance of education and academic achievement. I want to thank my brother Abir for being my role-model and my sister-in-law Tanya for believing in me more than I believe in myself. Finally, I want to thank my wife Rudeyna for her love and understanding, for her patience and interest in my work, and for her largeness of heart.
Contents
List of Illustrations
x
List of Tables
xiii
1 Introduction
1
1.1
Motivation . . . . . . . . . . . . . . . . . . . . . . . . . . . . . . . . .
1
1.2
Thesis . . . . . . . . . . . . . . . . . . . . . . . . . . . . . . . . . . .
2
1.3
Organization
3
. . . . . . . . . . . . . . . . . . . . . . . . . . . . . . .
2 Background
5
2.1
Memory Model . . . . . . . . . . . . . . . . . . . . . . . . . . . . . .
5
2.2
Program Model . . . . . . . . . . . . . . . . . . . . . . . . . . . . . .
5
2.3
Reuse Analysis . . . . . . . . . . . . . . . . . . . . . . . . . . . . . .
6
3 Related Work 3.1
3.2
3.3
8
Optimizations for the Memory Hierarchy . . . . . . . . . . . . . . . .
8
3.1.1
Loop Fusion . . . . . . . . . . . . . . . . . . . . . . . . . . . .
9
3.1.2
Tiling . . . . . . . . . . . . . . . . . . . . . . . . . . . . . . .
10
3.1.3
Array Padding and Data Copy
. . . . . . . . . . . . . . . . .
11
3.1.4
Combined Loop Transformations . . . . . . . . . . . . . . . .
12
Empirical Tuning . . . . . . . . . . . . . . . . . . . . . . . . . . . . .
13
3.2.1
Self-tuned Libraries . . . . . . . . . . . . . . . . . . . . . . . .
14
3.2.2
Whole Application Tuning . . . . . . . . . . . . . . . . . . . .
15
Limitations of Related Work . . . . . . . . . . . . . . . . . . . . . . .
21
3.3.1
21
Target Application . . . . . . . . . . . . . . . . . . . . . . . .
vii 3.3.2
Search Strategy . . . . . . . . . . . . . . . . . . . . . . . . . .
22
3.3.3
Search Space Pruning . . . . . . . . . . . . . . . . . . . . . . .
25
3.3.4
Feedback Metric
26
. . . . . . . . . . . . . . . . . . . . . . . . .
4 A Framework for Automatic Tuning
28
4.1
Overview . . . . . . . . . . . . . . . . . . . . . . . . . . . . . . . . . .
28
4.2
Transformation Tool . . . . . . . . . . . . . . . . . . . . . . . . . . .
30
4.3
Performance Measurement Tools . . . . . . . . . . . . . . . . . . . . .
32
4.4
Search Module
. . . . . . . . . . . . . . . . . . . . . . . . . . . . . .
33
4.5
Benchmarks . . . . . . . . . . . . . . . . . . . . . . . . . . . . . . . .
35
4.6
Platforms . . . . . . . . . . . . . . . . . . . . . . . . . . . . . . . . .
36
5 Search Space Exploration
38
5.1
Introduction . . . . . . . . . . . . . . . . . . . . . . . . . . . . . . . .
38
5.2
Direct Search . . . . . . . . . . . . . . . . . . . . . . . . . . . . . . .
39
5.2.1
Why Direct Search?
. . . . . . . . . . . . . . . . . . . . . . .
40
5.2.2
The Algorithm . . . . . . . . . . . . . . . . . . . . . . . . . .
42
Evaluation . . . . . . . . . . . . . . . . . . . . . . . . . . . . . . . . .
44
5.3.1
Experimental Setup . . . . . . . . . . . . . . . . . . . . . . . .
44
5.3.2
Performance Across Architectures . . . . . . . . . . . . . . . .
46
5.3.3
Direct Search Performance . . . . . . . . . . . . . . . . . . . .
48
5.3.4
Comparison with Heuristic Search Strategies . . . . . . . . . .
50
Summary . . . . . . . . . . . . . . . . . . . . . . . . . . . . . . . . .
52
5.3
5.4
6 Model-guided Automatic Tuning of Loop Fusion
53
6.1
Introduction . . . . . . . . . . . . . . . . . . . . . . . . . . . . . . . .
53
6.2
Cost Model . . . . . . . . . . . . . . . . . . . . . . . . . . . . . . . .
56
6.2.1
Quantifying Reuse in Fusible Loops . . . . . . . . . . . . . . .
56
6.2.2
Accounting for Conflict Misses using Effective Cache Capacity
60
viii 6.2.3
Estimating Profitability . . . . . . . . . . . . . . . . . . . . .
62
6.2.4
Resource Constraints . . . . . . . . . . . . . . . . . . . . . . .
63
6.2.5
Using the Model with a Greedy Fusion Algorithm . . . . . . .
65
6.3
Empirical Search . . . . . . . . . . . . . . . . . . . . . . . . . . . . .
66
6.4
Evaluation . . . . . . . . . . . . . . . . . . . . . . . . . . . . . . . . .
70
6.4.1
Accuracy of the Effective Cache Capacity Model . . . . . . . .
70
6.4.2
Comparing Different Search Spaces . . . . . . . . . . . . . . .
76
6.4.3
Tuning Strategy Performance . . . . . . . . . . . . . . . . . .
80
6.4.4
Summary . . . . . . . . . . . . . . . . . . . . . . . . . . . . .
97
7 Pruning the Fusion-Tiling Search Space
99
7.1
Introduction . . . . . . . . . . . . . . . . . . . . . . . . . . . . . . . .
99
7.2
Fusion-Tiling Interaction . . . . . . . . . . . . . . . . . . . . . . . . . 103
7.3
Cost Model . . . . . . . . . . . . . . . . . . . . . . . . . . . . . . . . 106 7.3.1
Modeling Fusion-Tiling Interaction . . . . . . . . . . . . . . . 106
7.3.2
Combined Fuse-Tile Algorithm . . . . . . . . . . . . . . . . . 111
7.4
Empirical Search . . . . . . . . . . . . . . . . . . . . . . . . . . . . . 113
7.5
Comparison with Other Model-guided Tuning Strategies . . . . . . . 115
7.6
Evaluation . . . . . . . . . . . . . . . . . . . . . . . . . . . . . . . . . 117
7.7
7.6.1
Experimental Setup . . . . . . . . . . . . . . . . . . . . . . . . 118
7.6.2
Tuning Strategy Performance . . . . . . . . . . . . . . . . . . 118
7.6.3
Comparison with Direct Search . . . . . . . . . . . . . . . . . 128
Summary . . . . . . . . . . . . . . . . . . . . . . . . . . . . . . . . . 135
8 Model-guided Tuning of Array Padding Factors
136
8.1
Introduction . . . . . . . . . . . . . . . . . . . . . . . . . . . . . . . . 136
8.2
An Example . . . . . . . . . . . . . . . . . . . . . . . . . . . . . . . . 137 8.2.1
Global Array Padding . . . . . . . . . . . . . . . . . . . . . . 138
8.2.2
Padding-Tiling Interaction . . . . . . . . . . . . . . . . . . . . 140
ix 8.2.3 8.3
8.4
Padding-Fusion Interaction . . . . . . . . . . . . . . . . . . . . 144
Background . . . . . . . . . . . . . . . . . . . . . . . . . . . . . . . . 145 8.3.1
Program Model . . . . . . . . . . . . . . . . . . . . . . . . . . 145
8.3.2
Notation and Terminology . . . . . . . . . . . . . . . . . . . . 145
Cost Model . . . . . . . . . . . . . . . . . . . . . . . . . . . . . . . . 146 8.4.1
Fusing Loops and Selecting Tile Sizes . . . . . . . . . . . . . . 147
8.4.2
Building the Interference Graph . . . . . . . . . . . . . . . . . 148
8.4.3
Coloring the Interference Graph . . . . . . . . . . . . . . . . . 151
8.4.4
Computing Padding Factors . . . . . . . . . . . . . . . . . . . 153
8.5
Search Strategy . . . . . . . . . . . . . . . . . . . . . . . . . . . . . . 154
8.6
Preliminary Evaluation . . . . . . . . . . . . . . . . . . . . . . . . . . 154
8.7
Summary . . . . . . . . . . . . . . . . . . . . . . . . . . . . . . . . . 157
9 Conclusions
158
9.1
Contributions . . . . . . . . . . . . . . . . . . . . . . . . . . . . . . . 158
9.2
Future Work . . . . . . . . . . . . . . . . . . . . . . . . . . . . . . . . 160
Bibliography
163
Illustrations
4.1
Overview of autotuning framework. . . . . . . . . . . . . . . . . . . .
29
4.2
Source code directives used in LoopTool. . . . . . . . . . . . . . . . .
30
5.1
Performance comparison of different search strategies. . . . . . . . . .
51
6.1
Example of un-profitable fusion. . . . . . . . . . . . . . . . . . . . . .
54
6.2
Multiple loop-crossing dependences in fusible loops. . . . . . . . . . .
58
6.3
Algorithm for empirical search of fusion configurations. . . . . . . . .
68
6.4
Accuracy of cache miss model on randaccess. . . . . . . . . . . . . .
72
6.5
Accuracy of cache miss model on erle. . . . . . . . . . . . . . . . . .
73
6.6
Accuracy of cache miss model on arraysweep. . . . . . . . . . . . . .
74
6.7
Performance curve for fusion configuration search space on Opteron (advect3d). . . . . . . . . . . . . . . . . . . . . . . . . . . . . . . . .
6.8
Performance curve for effective register set search space on Opteron (advect3d). . . . . . . . . . . . . . . . . . . . . . . . . . . . . . . . .
6.9
77
77
Performance curve for fusion configuration search space on Pentium 4 (advect3d). . . . . . . . . . . . . . . . . . . . . . . . . . . . . . . . .
79
6.10 Performance curve for effective register set search space on Pentium 4 (advect3d). . . . . . . . . . . . . . . . . . . . . . . . . . . . . . . . .
80
6.11 Memory performance on MIPS. . . . . . . . . . . . . . . . . . . . . .
82
6.12 Performance improvement on MIPS. . . . . . . . . . . . . . . . . . .
83
6.13 Memory performance on Itanium. . . . . . . . . . . . . . . . . . . . .
85
xi 6.14 Performance improvement on Itanium. . . . . . . . . . . . . . . . . .
86
6.15 Memory performance on Alpha. . . . . . . . . . . . . . . . . . . . . .
88
6.16 Performance improvement on Alpha. . . . . . . . . . . . . . . . . . .
89
6.17 Memory performance on PowerPC. . . . . . . . . . . . . . . . . . . .
90
6.18 Performance improvement on PowerPC.
. . . . . . . . . . . . . . . .
91
6.19 Memory performance on Opteron. . . . . . . . . . . . . . . . . . . . .
92
6.20 Performance improvement on Opteron. . . . . . . . . . . . . . . . . .
93
6.21 Memory performance on Pentium 4. . . . . . . . . . . . . . . . . . . .
94
6.22 Performance improvement on Pentium 4. . . . . . . . . . . . . . . . .
95
6.23 Memory performance on Pentium III. . . . . . . . . . . . . . . . . . .
96
6.24 Performance improvement on Pentium III. . . . . . . . . . . . . . . .
97
6.25 Mean performance across platforms. . . . . . . . . . . . . . . . . . . .
98
7.1
Effects of fusion and tiling on L2 Cache Misses. . . . . . . . . . . . . 101
7.2
Effects of fusion and tiling on TLB Misses. . . . . . . . . . . . . . . . 101
7.3
Effects of fusion and tiling on reuse. . . . . . . . . . . . . . . . . . . . 104
7.4
Algorithm for applying loop fusion and tiling. . . . . . . . . . . . . . 112
7.5
Mapping of tolerance values to transformation parameters. . . . . . . 113
7.6
Memory performance on MIPS. . . . . . . . . . . . . . . . . . . . . . 119
7.7
Performance improvement summary on MIPS. . . . . . . . . . . . . . 120
7.8
Memory performance on Itanium. . . . . . . . . . . . . . . . . . . . . 121
7.9
Performance improvement summary on Itanium. . . . . . . . . . . . . 122
7.10 Performance improvement summary on Alpha. . . . . . . . . . . . . . 123 7.11 Performance improvement summary on PowerPC. . . . . . . . . . . . 124 7.12 Performance improvement summary on Opteron.
. . . . . . . . . . . 125
7.13 Performance improvement summary on Pentium 4. . . . . . . . . . . 126 7.14 Performance improvement summary on Pentium III. . . . . . . . . . . 127 7.15 Mean performance across platforms. . . . . . . . . . . . . . . . . . . . 127
xii 7.16 Fusion configuration search space for advect3d on Opteron. . . . . . 129 7.17 Tile size search space for best fusion configuration for advect3d on Opteron. . . . . . . . . . . . . . . . . . . . . . . . . . . . . . . . . . . 130 7.18 Search space for effective cache capacity for advect3d on Opteron. . . 131 7.19 Performance comparison between model-based and direct on Opteron.132 7.20 Performance comparison between model-based and direct on MIPS. 133 7.21 Tuning time comparison between model-based and direct on Opteron.133 7.22 Tuning time comparison between model-based and direct on MIPS.
134
8.1
Example code before transformations. . . . . . . . . . . . . . . . . . . 138
8.2
Cache conflicts arising when padding arrays in local scope. . . . . . . 139
8.3
Fewer cache conflicts when padding arrays in global scope. . . . . . . 140
8.4
Example code with fusion and tiling. . . . . . . . . . . . . . . . . . . 141
8.5
Optimal allocation with reduced tile sizes. . . . . . . . . . . . . . . . 142
8.6
Conflicts in cache when padding arrays in fused loop nest. . . . . . . 144
8.7
Algorithm for computing array section. . . . . . . . . . . . . . . . . . 149
8.8
Algorithm for coloring a vertex. . . . . . . . . . . . . . . . . . . . . . 152
8.9
Comparison of L1 cache miss rates for different padding strategies on Pentium4. . . . . . . . . . . . . . . . . . . . . . . . . . . . . . . . . . 155
8.10 Comparison of L1 cache miss rates for different padding strategies on Opteron. . . . . . . . . . . . . . . . . . . . . . . . . . . . . . . . . . . 155
Tables
4.1
Benchmarks . . . . . . . . . . . . . . . . . . . . . . . . . . . . . . . .
35
4.2
Platforms . . . . . . . . . . . . . . . . . . . . . . . . . . . . . . . . .
37
5.1
Search space properties . . . . . . . . . . . . . . . . . . . . . . . . . .
44
5.2
Performance improvement and tuning time on Itanium using direct search . . . . . . . . . . . . . . . . . . . . . . . . . . . . . . . . . . .
46
5.3
Performance improvement and tuning time on MIPS using direct search 46
5.4
Performance improvement and tuning time on Alpha using direct search 47
5.5
Performance improvement and tuning time on Pentium 4 using direct search . . . . . . . . . . . . . . . . . . . . . . . . . . . . . . . . . . .
5.6
Performance comparison between direct search and exhaustive search on Itanium . . . . . . . . . . . . . . . . . . . . . . . . . . . . . . . . .
5.7
48
49
Tuning time comparison between direct search and exhaustive search on Itanium . . . . . . . . . . . . . . . . . . . . . . . . . . . . . . . . .
49
6.1
Compiler flags used on different platforms . . . . . . . . . . . . . . .
81
7.1
Best tiling parameters . . . . . . . . . . . . . . . . . . . . . . . . . . 135
1
Chapter 1 Introduction 1.1
Motivation
Over the last several decades we have witnessed tremendous change in the landscape of computer architecture. New architectures have emerged at a rapid pace and at the same time, the complexity of microprocessor architecture has grown consistently. The changing nature of the processor architecture and its ever increasing complexity has made retargeting of applications a major concern for high-performance computing. The advent of each new architecture and even a new implementation of a given architecture has required retargeting and retuning of applications at considerable cost. Manual tuning of programs is time consuming, tedious and error prone, not to mention that repeated manual transformation of the code makes it unmaintainable. In recent years, a novel alternative to manual tuning has been the the use of empirically tuned libraries. In an empirical compilation system, the parameters for program transformations are not chosen using static models. Instead, programs with different optimization parameters are executed on the target machine and the program variant that gives the best performance is selected. Empirically tuned libraries such as ATLAS [78], are known to produce better code than native compilers across a range of modern architectures and are recognized as practical alternatives to handtransformation of code in their respective domains. In spite of the success of empirically tuned libraries, to date there has been no general-purpose tool for automatically tuning whole programs using empirical methods. The principal bottleneck in this regard, has been the enormous time spent evaluating the large number of alternate program variants. Over the years, compiler writers
2 have developed a rich array of code improving transformations. However, determining good heuristics for applying these transformations across different architectures has always been a major challenge. The profitability of program transformations is sensitive not only to the input program but also, to a great degree, to certain architectural parameters. Thus, applying transformations profitably often requires detailed knowledge of the underlying architecture. Moreover, many program transformations interact with each other in different ways, and much of this interaction is still not fully understood by the compiler community. Any strategy for tuning scientific applications to different architectures needs to consider all these inter-related factors, which gives rise to a large and complex multi-dimensional search space. Researchers have approached the problem of this prohibitively large search space from two different angles. One approach has been to develop efficient search strategies that are able to find suitable transformation parameters by exploring only a small fraction of the search space. Recent research by several research groups has progressed in this direction [15, 44, 61, 27]. The other approach, which is complementary to finding a good search strategy, is the the use of analytical models to prune the search space to manageable proportions. Most recently, Yotov et al. [86] and Chen et al. [12] have advocated this model-guided approach of empirical tuning. However, as we shall discuss in Chapter 3, many of these recent research efforts have limitations that have prevented the empirical approach from gaining wide acceptance as a viable strategy for tuning scientific applications to different architectures.
1.2
Thesis
My thesis is that by combining architecture-aware cost models with heuristic search, we can automatically pretune multi-loop computational kernels to different architectures to obtain improved performance at a reasonable cost. To support this thesis, we designed and implemented a framework for automatic tuning of applications, conducted an experimental study evaluating different heuristic
3 search strategies, and implemented a novel strategy for pruning the search space of transformation parameters. In our pruning strategy, we move away from the search space of parameterized transformations and instead focus on the search space of architecture-dependent parameters embedded within the cost models. As we know, the profitability of many program transformations are sensitive to certain machine parameters. For example, tile sizes are constrained by the capacity of the target cache. Compiler cost models use these architectural parameters as a means for picking the best transformation parameters. However, in most cases these parameters are difficult to determine accurately. For example, the fraction of cache that a code can exploit depends on the size and associativity of the cache, the number of different arrays it accesses in the program and, also, the size of each of those arrays. A static model that attempts to capture all these parameters is unlikely to be totally accurate for all architectures. The goal of our tuning strategy is to correct for these inaccuracies in the cost model. We use empirical search to find the best estimates of the machine parameters, which in turn deliver the best set of transformation parameters. Our pruning strategy reduces the size of the search space in two ways. First, we can use a single parameter to capture the effects of multiple transformations which reduces search space dimensionality. For example, we can use the estimate of the cache size parameter to tune both loop fusion and tiling parameters. Second, for transformations that can have different parameters for different loops (i.e., tiling), we can again use just a single parameter to tune each of the loops in the program. Thus, the search space we explore does not grow with program size. For large applications with many loop nests, this property can be very effective in limiting the size of the search space.
1.3
Organization
This dissertation is organized as follows. In Chapter 2, we present background material for the heuristic cost models described in this dissertation. Chapter 3 discusses related work and their limitations. Chapter 4 presents an overview of our automatic
4 tuning framework. We discuss results of an experimental study with heuristic search strategies in Chapter 5. In Chapter 6, we describe a strategy for automatically tuning loop fusion parameters using estimates of machine parameters. This chapter also introduces the model for effective cache capacity. In Chapter 7, we present a strategy for pruning the fusion-tiling search space. Chapter 8 describes a global array padding strategy that also incorporates fusion and tiling decisions. Evaluation of each of these strategies is presented in the respective chapters. Finally, in Chapter 9 we outline the major contributions of this work and discuss future work.
5
Chapter 2 Background This chapter reviews some of the fundamental concepts in memory hierarchy transformations. Dependence theory and reuse analysis provide the foundations for the compiler-based cost models described in this dissertation. The purpose of this chapter is to re-acquaint readers with some of the fundamental ideas to help better understand the models presented in later chapters.
2.1
Memory Model
We assume the standard hierarchical memory model found in almost all modern microprocessor based systems. Memory is divided into multiple levels with each level farther away from the processor having a larger capacity and slower access time. The register set - the level of memory closest to the processor - is considered as the 0th level of memory. Caches reside between the register set and the main memory and have different degrees of associativity and different block sizes. In this document, we define the capacity of a cache at some level k in terms of the number of cache blocks at level k. We assume a least-recently-used (LRU) replacement policy for all caches. All information regarding the memory model is obtained prior to compilation and is used as input to our cost models.
2.2
Program Model
In our framework, a program is a collection of statements each enclosed by one or more loops. Loops are perfectly nested and loop bounds are affine expressions of loop iterators. All array references are uniformly generated, that is, the index expressions
6 of all arrays references differ only in the constant term [25]. Without loss of generality, we assume that arrays are aligned at cache line boundaries and they are stored in column-major order. We also assume that fusible loops have already been aligned with respect to each other.
2.3
Reuse Analysis
We use the notion of reuse as presented by Wolf and Lam [81]. Data reuse occurs in a program, whenever the same data (or data residing in the same cache line) is accessed multiple times. Reuse is generally classified into two categories: temporal and spatial. When references access the same memory location multiple times, it is said to exhibit temporal reuse. On the other hand, if references access multiple data items within the same cache block it exhibits spatial reuse. Spatial and temporal reuse is further classified into four classes based on the number of references that are involved in the reuse behavior. When a single reference accesses the same memory location at different times during the execution of the program that reference is said to have self-temporal reuse. If a single reference accesses the same cache line it is said to have self-spatial reuse. If a collection of references access the same memory location, we say they have group temporal reuse and if they access the same cache line, we say they have group spatial reuse. Our cost models for memory hierarchy transformations consider all levels of the memory hierarchy simultaneously. Hence, we make a further classification of temporal reuse based on the memory level at which the reuse is exploited. We use the notion of reuse distance of memory references to make this classification. Reuse distance is defined as the number of distinct cache lines accessed between references to the same memory location [4]. We use the ideas described by Ding and Zhong [21] as the basis for computing reuse distances between references. In the general case, reuse distance of a static reference with self-temporal reuse or two static references with group temporal reuse constitutes a set where each element of the set refers to the reuse
7 distance between two dynamic invocations of the static reference. However, under the assumption of uniformly generated references, reuse distance of a static reference remains constant through all its dynamic invocations. Hence, in our model we are able to treat reuse distance as a single value rather than a set of values. We should point out that the assumption of uniformly generated references in reuse distance analysis can be overly simplistic in some cases [50]. If the same memory location is accessed with varying reuse distances, then under the assumption of uniformly generated references, only the most frequent reuse distance will be accounted for. Omission of other reuse distances in the analysis may cause performance problems for some applications. Our approach is to make the frequent case fast. For reuse distance analysis, we assume loop bounds are known at compile time. Although this is not a realistic assumption for many applications, making such an assumption is not a problem in general. The issue of unknown loop bounds can be handled in several different ways. One approach is to simply assume loop bounds are large enough so that we get no reuse at any of the outer levels. Another approach is to use tiling to get manageable reuse distance when we do not know the loop upper bounds.
8
Chapter 3 Related Work We divide the discussion of related work into two parts. The first section of this chapter reviews related work in memory hierarchy optimizations. The second section surveys the literature on empirical tuning. The concluding section summarizes the limitations of related work in automatic tuning.
3.1
Optimizations for the Memory Hierarchy
Memory hierarchy optimizations are an important class of program transformations in high-performance computing. As the gap between processor and memory speed continues to widen, the impact of memory hierarchy transformations in improving application performance becomes even more critical. Because of this, over the years, memory hierarchy transformations have received a lot of attention from the compiler research community. Compiler researchers have developed a large number of program transformations that attack the memory hierarchy problem form different angles. Transformations such as tiling [81], data shackling [43] and loop interchange [45, 82] attempt to improve cache locality in programs, whereas unroll-and-jam [8], loop distribution [1] and loop fusion [29] are primarily designed to improve register reuse. Software prefetching [7] hides latency for compulsory cache misses, while data-layout transformations such as array padding [65] and data copy [85] aim to reduce cache conflict misses. To improve the overall memory hierarchy performance of a a particular program, one needs to carefully apply some or all of the transformations mentioned above. A complete survey of all memory hierarchy transformations is beyond the scope of this thesis. Therefore, we limit our discussion to three key optimization
9 strategies. The three transformation strategies discussed in this section, are the ones that are the primary focus of our research. Each transformation attempts to exploit locality within the program in different ways and can have very different effects on program performance. All three transformations depend on the underlying architectural parameters for profitability and also interact with each other in complex ways. Thus, this set of three optimization strategies form a good basis for evaluating our automatic tuning strategy. 3.1.1
Loop Fusion
Fusion has been studied in the literature both as a tool for improving data locality and increasing the granularity of parallelism [36, 46]. In this work, we look at fusion in the context of improving data locality only. Fusion improves data locality by merging loops and exploiting cross-loop reuse. In its general form the task of finding the optimal fusion solution has been shown to be NP-complete [18]. Several published algorithms use heuristics to find good fusion solutions in reasonable time. Lim and Lam use affine transformations to apply fusion [49]. Gao et al. use a max-flow-min-cut algorithm to partition loop nests into fusible clusters [26]. Kennedy describes a fast greedy weighted fusion algorithm that runs in polynomial time [35]. In our work, we are less interested in specific algorithms for performing loop fusion than we are in establishing suitable profitability constraints for legally fusible loops. Many researchers have proposed models for performing loop fusion to improve memory performance. Ding and Kennedy have looked at reducing effective bandwidth through loop fusion [20]. Verdoolaege et al. [75] describe a greedy fusion algorithm for incremental loop fusion at multiple levels. However, their locality models do not consider input dependences or the costs associated with cache misses. Many scientific applications are written in a way where data from a main array is read in multiple loop nests to compute values for several auxiliary arrays. For such applications,
10 considering input dependences becomes critical for improving performance through loop fusion. 3.1.2
Tiling
Tiling has also been studied extensively as a way to improve memory hierarchy performance of scientific computations [81, 9, 23, 10, 14, 11, 53]. Tiling reshapes an iteration space over a data domain by partitioning it into tiles that fit comfortably into cache. The idea of using blocked computations for matrix operations was presented by McKellar and Coffman back in 1969 [51]. Wolfe proposed the first algorithm for restructuring a loop nest to achieve the effect of tiled computations [83]. Although a very useful transformation for improving memory performance of scientific kernels, finding suitable tile sizes to get the desired effect has proven to be a challenging task. For this reason, much of the work in tiling over the past two decades has focused on finding suitable tile sizes rather than improving existing algorithms for tiling a loop nest. Wolf and Lam [81] propose a tile size selection heuristic based on reuse vector analysis. They use their model to predict the amount of self-interference in a given loop nest and then select a small enough tile size that avoids interference. Although their strategy achieves good performance, in many instances they choose very small tile sizes that result in underutilization of the cache. Esseghir [23] describes an algorithm for tile size selection where tile sizes are selected based on the maximum number of rows of an array that fit into cache. His approach also eliminates selfinterference misses but suffers from underutilization of the cache in some cases. Coleman and McKinley [14] present a working set based algorithm for tile size selection that eliminates self-interference misses and also minimizes cross-interference misses. However, their algorithm is most effective for loop nests where locality is dominated by a single array. Chame and Moon [11] describe a tile size selection algorithm that
11 eliminates self-interference misses and also minimizes cross-interference and capacity misses. They present experimental results comparing their strategy with the three strategies described above. Their experimental results show that their strategy is able to outperform each of the three strategies for three computational kernels including matrix multiply. Mitchell et al. [53] propose a tiling algorithm that considers multiple levels of the cache. They also describe a strategy for tiling that minimizes TLB misses. Goto and van de Geijn have described a specialized tiling algorithm for the matrix-multiply kernel that can effectively reduce TLB misses on a number of different architectures [30]. However, their strategy does not have widespread application beyond matrix-matrix multiplication. 3.1.3
Array Padding and Data Copy
The goal of data-layout transformations is to exploit locality by reorganizing the data in the input program. Data-layout transformations are fundamentally different from transformations such as loop fusion and tiling because they do not attempt to reorder any computation within the program. These strategies are particularly useful for eliminating conflict misses in cache. In many cases, conflicts in cache can be eliminated only through reorganization of the program data. Thus, transformations that do not touch the data layout are inherently limited in their ability to eliminate conflicts in cache. In this section, we review related work in array padding and data copy, two strategies from the family of data-layout transformations. Array padding usually involves inserting dummy elements between variables (or within a single variable, in case of multi-dimensional arrays) to align them in a way such that they do not conflict in cache. Array copy involves copying segments of array variables into non-conflicting locations in memory. Rivera and Tseng [65] approach the problem by manipulating the base addresses
12 of array variables. They set the base addresses of array variables a fixed number of cache lines apart. They use a heuristic to determine the optimal number of lines between base addresses that avoids conflicts in cache. They mainly handle severe conflict misses (i.e., conflict misses that occur in every iteration of a loop). They also use intra-variable padding to avoid self-interference misses. In a later paper they extend their model to handle multi-level caches [66]. Their model however, does not take associativity into account when padding. Panda et al. [58] developed an array padding strategy that takes tiling into account. They first select the tile size to make the working set fit into cache. Once the tile size is selected, they use intra-variable padding for each array to eliminate self-interference within a tile. They then separate the base address for each array using a heuristic to eliminate cross-interference. Vera et al. [74] use genetic algorithms to search for pad factors. A sequence in the GA is a padding configuration for all arrays in the program. They use cache miss equations to evaluate the objective function. Their strategy considers cache associativity and is not limited to uniformly generated sets. Temam et al. [69] present a strategy for selective copying. Three types of interference groups are identified for the references. For each group the cost and benefits of copying the arrays are evaluated. Copying is only done if the benefits outweigh the costs (hence, selective). Their strategy is mainly focused on tiled loops. Yi [85] presents a general algorithm for applying data copy. Her algorithm works for nonaffine array index expressions and considers whole program locality. Her algorithm is more general in the sense that copy operations can be inserted anywhere not just at the beginning or end of a computation loop. Profitability is based on the number of copies, size of the local buffer, location of copy operation, and reuse of references. 3.1.4
Combined Loop Transformations
Several researchers have looked at combining transformations for improved profitability. Song et al. [67] present a model that combines loop fusion, loop alignment and
13 array contraction. In their model, the primary goal is reducing bandwidth requirements by reducing the size of arrays. Although they apply conditions to check for excessive register pressure and cache capacity they do not address the issue of conflict misses. Wolf et al. [80] describe a strategy that combines loop distribution, loop fusion, tiling and unrolling. Although they look at a larger class of transformations their model does not capture all of the interactions between loop fusion and tiling. In their model, the tiling decisions are made after the optimal loop structure has been determined through fusion and distribution. Moreover, their cost model is based solely on static estimators. No mechanism is provided for empirically tuning the model for different architectures. Lim et al. [48] have looked at combining tiling with array contraction using affine partitioning. They demonstrate the effectiveness of their approach through experimental results on a number of benchmarks. Pike and Hilfinger [60] explore the problem of combining tiling with loop fusion and array contraction. They do not employ any analytic modeling in combining these transformations. Instead the parameters are searched using a user-specified fitness criterion. Vera et al. [72] describe a strategy for the combined application of tiling and array padding. They use a cost model based on cache miss equations (CMEs) [28] that describes misses across different levels of the memory hierarchy. A genetic algorithm is used to find fast solutions to CMEs.
3.2
Empirical Tuning
The idea of feedback directed optimization can be traced back to Knuth’s 1971 study of Fortran programs [42]. The proliferation of new architectural models has rekindled interest in this area. Work in empirical tuning can be broadly classified into two categories based on their scope: strategies that work on domain specific kernels and those that attempt to tune whole applications.
14 3.2.1
Self-tuned Libraries
A number of empirically-tuned library-generators have been quite successful in delivering high performance on a range of architectures. ATLAS [78] produces highly optimized BLAS routines by probing the underlying hardware for platform-specific information and using a global search to find the best transformation parameters, searching for these parameters one transformation at a time. The transformations considered by ATLAS include multi-level tiling, unroll-and-jam and pipeline scheduling. Because of its ability to automatically generate hand-tuned quality code for many modern architectures, ATLAS has become the de facto standard for evaluating many of the other empirical tuning systems. PhiPAC [5] generates empirically optimized matrix multiply code that is able to achieve close to peak performance on a wide range of systems. The system includes a parameterized code generator that generates portable C code and is able to perform optimizations such as tiling when supplied with the parameters. PhiPAC uses a simple sequential search strategy for finding the best tiling factors for matrices of different sizes. Architectural parameters such as cache size and number of registers are taken into account. These values are used to limit the search space of tile sizes. One of the earliest efforts of domain specific empirical optimization was the Extent programming environment [17]. In Extent, block recursive algorithms, such as FFT and matrix multiply, are represented using tensor products. These tensor product formulas are then translated into optimized parallel and/or vector code. The system contains a performance monitor module that collects performance data for each run and presents them to the user. These results are then used by the user to manually tune the performance of the program. Frigo et al. developed FFTW [24], a library for computing discrete Fourier transforms which outperforms vendor libraries on most machines. The critical code in this library is generated by the special purpose code generator called genfft. genfft generates highly optimized codelets each of which computes a part of the Fourier trans-
15 form. genfft employs both general (e.g. algebraic transformations, CSE) and DFTspecific optimizations (e.g. converting negative FP constants to positive, scheduling to minimize register spills). Once a suitable set of codelets has been generated, they are combined by the executor and run on the target machine. The running time of the code is measured and is used by the executor to select the next combination of codelets. The process continues until the fastest combination of codelets have been discovered for the target machine. SPIRAL [62] is another self-tuning library that uses iterative techniques and the mathematical properties of signal processing algorithms to choose an optimal algorithm for implementation on the target architecture. SPIRAL is more general than FFTW in that it is not specific to FFT. It can generate optimized code for a large class of signal transforms such as the Walsh-Hadmard transform and the discrete cosine transform. Algorithms are expressed by mathematical formulas using a special purpose language [84] and a suitable implementation is chosen based on matrix factorization calculations and a simple sequential search. Execution time measurements are used to choose the best implementation from all the versions generated by the compiler. Sparsity [34] is an automatically tuned library designed for sparse matrix computations. Sparsity uses some of the same optimization techniques used for dense-matrix computations, such as tiling and unroll-and-jam. However, tuning sparse-matrix kernels becomes more difficult because of irregular memory access patterns and the non-zero structure of the matrices. Because of this, Sparsity uses a combination of data reorganization strategies with conventional tiling to achieve higher performance for sparse-matrix kernels on different high-performance architectures. 3.2.2
Whole Application Tuning
The success of automatically-tuned domain specific libraries has lead to considerable interest in applying empirical methods for tuning whole applications. In this
16 section, we cover related work in whole application tuning. The research efforts in whole application tuning can be broadly classified into two categories based on the parameter search space on which they operate. Several ongoing research projects tackle the phase-ordering problem using empirical methods. That is, they aim to find the best sequence of transformations that minimizes some objective function such as execution time or power. On the other hand, some of the other work in automatic tuning concentrates on finding the best parameter values for transformations that use numerical parameters. Although both these approaches deal with very large search spaces, characteristics of these two search spaces can be quite different. Thus, strategies used in exploring these two types of search spaces are also somewhat different. In the remainder of this chapter, we first summarize work on empirical tuning of compilation sequences and then look at work related to empirical tuning of numerical parameters. Optimization Phase Ordering Cooper et al. [15] use a genetic algorithm (GA) to find the best sequence of compiler phases. A sequence of transformations is represented as a chromosome in the context of a genetic algorithm. Each transformation corresponds to a particular gene within the chromosome. The GA is seeded with an initial random sequence and the fitness value of the sequence is recorded. Then at each step, a genetic operation such as crossover or mutation is performed on the sequence. The search converges after a pre-specified number of steps. At convergence, the initial sequence evolves into the fittest, and hence the best optimization sequence for the given program. Their work targets embedded system architectures and hence they use dynamic instruction count as their primary objective function. Their experiments show that GA is able to dramatically reduce the static code size for several benchmark programs. In many cases, the dynamic instruction count and also the performance of the program is greatly improved. However, in terms of tuning time their algorithm proved costly,
17 requiring as many 1000 program evaluations in finding the best optimization sequence. Almagor et al. [3] have extended this work to include other search strategies such as stochastic hill climbers and greedy constructive algorithms. They conduct extensive experimental work in which they enumerate the search spaces of several benchmarks. They use the results of the experiments to characterize the search space of optimization sequences. They use this insight to improve their search algorithms. The experiments with different search strategies show that GA is able to find marginally better sequences at considerably higher cost (4,550 program evaluations). The hill climber finds good values in least time. However, even for that search strategy the tuning process requires as many as 600 program evaluations. The OSE compiler [71] presents a practical approach to adopting empirical techniques for a general-purpose compiler. OSE uses static models available in Intel’s high-level optimizer to prune the search space of optimization sequences. In addition to finding the best optimization sequence they also perform search for a small set of unroll factors. The OSE framework is able to tune applications both at program level and individual function level. They use a static performance estimator to select only the best program variants for runtime evaluation. They use no special strategy for searching the optimization space. They perform an exhaustive search on the pruned search space. They present experimental results for the SPEC95 and SPEC2000 benchmarks on an Itanium workstation. Their results show, on average a five percent performance improvement over the best optimization heuristic chosen by the native compiler, when optimizing at program level granularity. Tuning applications at the function level yields a much higher performance improvement. Of course, these performance improvements come at a cost of increased tuning time (a factor of three when not using static performance estimators for pruning). Nevertheless, the tuning time is much less than the tuning time required by some of the other empirical strategies. This suggests that OSE does an effective job in pruning the search space of compilation sequences. A key result of this work is the additional speedup obtained
18 by tuning applications at a finer granularity. We examine this issue in Chapter 4 and discuss how we apply this result in our research. Kulkarni et al. [44] describe efficient ways of reducing the running time of genetic algorithms when searching for the best optimization sequence. They use techniques such as detecting redundant sequences and identifying equivalent code to cut down the number of program evaluations. Kulkarni et al. also describe ways to modify the search so that fewer generations are required to achieve comparable performance. These techniques prove to be extremely effective, reducing the number of program evaluations in the search phase by as much 68%. These results advocate the use of empirical search as a viable option for general application tuning. Pinkers et al. [61] use a statistical method based on orthogonal arrays to choose the optimal sequence of transformations. They set up a fractional factorial design experiment using an N × M orthogonal array in which each column represents a compiler option and each row represents a particular configuration for the set of options. A program is compiled and run with each row configuration and the relative effects of the options are computed. Each option is set or unset based on its effects of the previous run. The process stops when all options have been set. This approach works fairly well for the set of benchmarks used in their experiments. However, they provide no measurements of tuning time. Thus, it is hard to evaluate the effectiveness of their approach. Pan and Eigenmann [57] have developed an algorithm for orchestrating a large set of compiler optimizations. The main idea in their approach is to identify transformations that degrade performance for a particular application and eliminate them from the set of transformations that are to be applied. The elimination of candidate transformations happen both in batches or through an iterative process. Their experimental results show that they are often able to identify the transformations that cause the most performance degradation. In terms of tuning time, their strategy outperforms both the OSE compiler and the statistical selection method proposed by
19 Pinkers et al. On the other hand, they achieve comparable performance improvement for most applications. However, one limitation of their approach is that all of the tuning takes place offline. Adopting their strategy for online tuning is part of their future plans. Numerical Parameters Kisuki et al. are among the first to address the issue of automatic tuning of numerical optimization parameters [38, 40, 27, 41]. In their initial study [38], they examine the combined search space of tile sizes and unroll factors. To explore this search space, they use a variety of search techniques including genetic algorithm, simulated annealing, pyramid search and random search. The parameter values required for these search strategies are obtained experimentally. They compare their empirical strategy with two well-known static techniques for selecting tile sizes. The experimental results show that the empirical approach significantly outperforms both static techniques on two matrix computation kernels. However, since their approach does not use any analytic modeling to guide the exploratory search, the tuning time required to find the optimal values is rather high. In some cases, they require as many as 400 program evaluations to find the best variant. A somewhat interesting and surprising result of this work (and some of their latter work [40]) is that none of the search strategies used in their system has a clear advantage over the others. In fact, in most cases, random search performs just as well as some of the other more sophisticated search techniques. This implies that either the search strategies are ineffective in this context or the initial search space (including the parameters for the search strategies themselves) needs to be set up more carefully using analytical models. We revisit this issue in Chapter 5. In subsequent work, Knijnenburg et al. [41] have examined the effects of cache models on empirically tuning tiling and unrolling factors. They use static models in combination with a cache simulator to filter out bad candidates with high cache
20 miss rates from the parameter search space. Their results show that the use of cache models can indeed speedup the tuning process significantly without a high sacrifice in performance. However, in their experiments they only combine the cache models with random search. Hence, no conclusions can be drawn about the effects of pruning the search space for intelligent search methods. An interesting and important aspect of this work is the use of slack factors to estimate the capacity of set-associative caches. The slack factors are determined experimentally and incorporated into the cost models. We believe, this is a very useful feature for an automatic tuning framework. However, the slack factors can be better utilized if they are integrated into the tuning system. Chapters 6 and 7 examine this issue in detail. Fursin et al. [27] extend the search space of tiling and unrolling to include array padding factors. Their experiments with three SPEC benchmarks show that they significantly outperform native compilers on a variety of platforms. Their strategy however does not use any intelligent search methods in exploring the search space. Use of analytical models to prune the search space is also not considered. Thus, the tuning time required to achieve the improved performance is considerably high. Waterman [77] explores the parameterized search space of procedure inlining. In his work, inlining directives are represented using bit strings at the command-line level. An exhaustive search is used to determine the best inlining options. Chen et al. [12] combines analytical models with empirical search to automatically tune dense matrix computations to two different architectures. They cover a larger set of transformations than any of the previous work. Loop interchange, unroll-andjam, tiling and software prefetching are among the transformations considered for tuning. For each transformation, they use static models to generate a parameter search space that is likely to contain the optimal parameter value. A binary search is used to search the tile size search space. For each of the other transformations a simple sequential search is used. A major strength of their approach is that their cost models consider the trade-offs between different levels of the memory hierarchy.
21 By combining their cache-conscious models with empirical search, they are able to achieve performance comparable to that of ATLAS on the matrix multiply kernel. The search process is about 2-4 times faster than that of ATLAS. Although they conduct experiments only on dense matrix computations, the strategies described in their work are much more general and can be applied to a general automatic tuning tool. One weakness of this approach is that their cost models do not consider the interaction between transformations and their search strategy - except for the tiling search space - is unidimensional. There has been some work in using statistical models to explore the search space of optimization parameters. Vuduc et al. [76] establish an early stopping criteria for search strategies based on an empirical cumulative distribution function (ecdf). They also present a classifier system that uses regression analysis to select a nearoptimal program variant from a large collection of implementations. They validate their models on the register-tile search space for the dense matrix multiply kernel. Although the experimental results are limited to matrix multiply the authors claim that these statistical methods can be used as complementary techniques for a general automatic tuning system.
3.3 3.3.1
Limitations of Related Work Target Application
Much of the work on automatic tuning has concentrated on optimizing kernels as opposed to whole applications. Moreover, most of the kernels come from the domain of linear algebra subroutines (in fact, some of the work focuses exclusively on optimizing the matrix multiply kernel). It is important to focus on smaller problems to develop a better understanding of the the problem domain as a whole. However, there are several issues that come up when dealing with whole applications that are difficult to address with techniques derived from optimizing individual kernels. First, the number of transformations that constitute the search space, grows dra-
22 matically for whole applications. For many kernels, it is usually known exactly which optimizations will be beneficial (i.e. tiling for matrix multiply). Even if this information is not known, the number of transformations that can be applied to a specific kernel is usually limited. For whole applications, on the other hand, it is difficult to determine a priori, exactly which transformations might be helpful. As a result, the compiler may have to explore several different transformations, before deeming them ineffective for a particular application and eliminating them from the search space. Furthermore, if the execution time for an application is dominated by several loop nests, then each individual loop nest can potentially have their own search space, each with a different set of transformations and a different range of parameter values. Thus, the search spaces used for tuning whole applications can be potentially much larger than those of kernels. The second major issue is the type of transformations that require tuning for whole applications. When we move away from kernels, we cannot limit ourselves to just single-loop transformations. For whole applications, it is important to look at optimizations that have more of a global impact on performance. In particular, multiloop transformations such as loop fusion and global data-layout strategies are critical in improving application performance. The search space representation for many of these transformations is not as straightforward as those of single-loop transformations such as tiling and unrolling (as we will discuss in Chapter 6). Thus, inclusion of multiloop and data-layout transformations can make the optimization search space even more complex. 3.3.2
Search Strategy
As discussed in the previous chapter, many of the empirical tuning systems employ a search strategy that is unidimensional in nature. That is, they search for the best parameters one transformation at a time. When performing search in one dimension, reference values are used for other dimensions. Although this strategy has worked
23 reasonably well for ATLAS and some of the other empirical tuning systems, it has one major limitation. And that is, the search strategy does not account for interaction between transformations. It is well established that many transformations interact with each other in complex ways and this complex interaction can have significant impact on program performance. This is especially true for loop transformations targeting the memory hierarchy. Thus, when searching for the best parameter values for multiple transformations it is imperative that the search used is multi-dimensional in nature. Genetic algorithms are another search mechanism that have been used in several empirical tuning systems. Although the search usually takes a relatively long time to converge, experimental results have shown that they are effective in finding good optimization sequences. However, their applicability in finding suitable numerical parameters is somewhat limited. To employ GAs in the context of empirical search we need to develop a representation for the search space that resembles the key GA components: genes, chromosomes and individuals. This can be done in a straightforward manner when the search space in question is a sequence of transformations. In such situations, a sequence of transformations can be represented as a string of bits where each bit corresponds to a particular transformation. Each bit string can be thought of as a chromosome while the individual bits can be thought of as genes in the context of the genetic algorithm. In this representation, a GA operation such as mutation implies enabling or disabling a particular transformation. When working with numerical parameters however, the representation is not as simple. Since we are not dealing just with binary decisions, we need to use multiple bits to represent a single parameter value. Consequently, each transformation parameter is represented using multiple genes. The main problem with this approach is that the basic GA operations no longer make intuitive sense. In this set-up, a mutation operation which involves flipping one of the genes in the chromosome, will change the value of the transformation parameter, essentially, in a non-deterministic way. Thus, for numeri-
24 cal parameters, using a GA is not too different from using a random search. Previous research has shown that the search space for optimization parameters is neither smooth nor continuous [15]. Thus, search strategies that depend on computing derivatives for gradient descent are ill-suited for exploring the search space of optimization parameters. Furthermore, it is very difficult to accurately model the search space, since the characteristics of the search space may vary from platform to platform, from program to program and even from one input set to another. Thus, strategies that depend on some form of modeling of the search space are also not well-suited for exploring the search space of optimization parameters. The notion that model dependent search strategies are not as effective has been experimentally verified by Knijnenburg et al. [40]. As discussed in Section 3.2.2, Knijnenburg et al., conducted an experiment where they explored the search space of tiling sizes and unroll factors for matrix-multiply using several different search techniques. The search methods included simulated annealing, pyramid search, window search and a random search. An interesting and somewhat surprising result of that experiment was that random search performed as well (and in some cases even better than) the other more sophisticated methods. The explanation for this is that all the other search techniques assume certain properties to hold for the space that is being explored. For example, simulated annealing uses a pre-computed value called temperature when exploring the search space. At any time during the search, the decision to move to a new point is based not only on the current function value but also on the value of the temperature parameter. However, if the current temperature is computed without detailed knowledge about the search space then it may not be useful in guiding the search in the best direction. Similarly, both pyramid search and window search depend on certain properties of the search space. These results emphasize the need for using a search strategy that relies solely on function evaluations.
25 3.3.3
Search Space Pruning
Most of the work in empirical tuning is centered around improving the search strategy for optimization space exploration. Relatively few have addressed the issue of using analytical models to prune the search space [71, 12, 41]. There are two major limitations in the way analytical models have been used in empirical tuning systems. The first issue is that the models used to guide empirical search do not take the interaction of transformations into account. Since we explore a multi-dimensional search space, the analytical models that generate the search space also need to consider the complex trade-offs among multiple transformations. Although there are several such models in the literature, none of them have been used in the context of empirical tuning. The second major issue regarding search space pruning has to do with finding a suitable representation for the search space. For some optimizations, such as tiling and unrolling the search space representation is obvious. The effect of these transformations on a loop can be captured by a single numerical parameter. However, when considering multi-loop transformations such as fusion, or data-layout transformations such as padding, the search space representation becomes less obvious. Zhao et al. [88] propose using all combination of loops in a program as a potential search space for loop fusion. However, they also show that with this representation, the search space for fusing n statements into m loops without any reordering can be as � n−1 large as m−1 . Clearly, exploring such a large search space is infeasible for a general purpose compiler. The main problem with this representation, however, is not that it
is extremely large, but the fact that the search space will grow both as a function of the number of transformations and the number of loops in the program. For example, if we include tiling, then for each fusion configuration we can potentially have a range of tiling factors that corresponds to a valid point within the search space. Similarly, the more loops we have in the program the larger the search space gets. This property is likely to hold for any search space representation using parameterized transforma-
26 tions. Thus, this approach can be a major impediment to tuning large applications with many transformations in the search space. To make empirical tuning practical for whole applications we need a mechanism to represent a search space that both captures the interaction of different transformations and at the same time does not increase with program size. We investigate this issue in Chapter 7. 3.3.4
Feedback Metric
With the exception of the OSE compiler, almost all work in automatic tuning uses whole program performance as the feedback metric. Collecting performance measurements at the program level is usually sufficient when tackling small kernels, where one loop nest dominates the entire execution. However, for larger applications in which execution time is distributed over several loop nests, whole program granularity is no longer sufficient. This is particularly true when dealing with loop transformations. Loop transformations such as tiling, if applied to multiple loop nests within a program, can have widely varying effects on each of those nests. Thus, to accurately determine the effects of changing loop transformation parameters, we need feedback information at a finer granularity. In particular, we need to know how transformation T affects loop nest L. Relying on whole program feedback can potentially lead to longer search times. Using whole program execution time as the only feedback metric has another potential drawback. Basing all decisions in the search step solely on execution time, may sometime camouflage the effects of certain transformations on the input program. Although loop transformations will usually have some impact on program execution time, often they will have a more conspicuous effect on some other performance metric. For example, unroll-and-jam is a transformation that can improve register reuse and cache locality by exploiting outer-loop reuse. However, unrolling too much may cause excessive register pressure that may lead to register spills. The occurrence of register spills may not be obvious if we one just looks at the total execution time,
27 since the negative effects of register spills is likely to be somewhat ameliorated by improved locality. Hence, in such situations it is useful to observe other performance metrics (i.e, number of loads) to better discern the impact of unroll-and-jam on the input program.
28
Chapter 4 A Framework for Automatic Tuning This chapter presents an overview of our automatic tuning framework. In building our framework we have addressed several issues for making automatic tuning more efficient. We discuss some of these issues as we describe the key components of our framework.
4.1
Overview
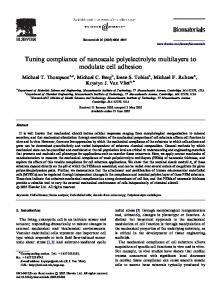
Figure 4.1 gives an overview of our automatic tuning framework. The major components of the framework include a source-to-source transformer (LoopTool), a set of performance measurement tools, and a search module that uses the measurements to guide selection of program transformations. At each step in the tuning process, the search module generates a set of transformation parameters that are applied to the input program by LoopTool. The program is then compiled using the native compiler and run on the target machine. During program execution, performance measurement tools collect a variety performance measurements to feed to the search module. The search module uses these metrics in combination with results from previous passes to generate the next set of tuning parameters. This process continues until some pre-specified optimization time limit is reached or the search algorithm converges to a local minima. Although the structure of our autotuning framework is not dramatically different from that of other systems, there are several key ideas that make our framework unique. Unlike most other automatic tuning systems, our framework uses a fullscale dependence-based transformation tool which enables us to verify the legality of
29
Architectural Specs F77 Source
LoopTool Next Iteration
Parameters
bloop
hpcrun
Program Structure
Profile Information
Transformed Source
Vendor Compiler Parameterized Search Engine
Binary
Search Space
hpcview
Feedback
Figure 4.1 : Overview of autotuning framework.
30
cdir$ fuse 1 cdir$ uj 4 do j = 1, N cdir$ block 16 do i = 1, M cdir$ block 16 do k = 1, L a(k, i, j) = b(j, i) + 17 enddo enddo enddo cdir$ fuse 1 do j = 1, N do i = 1, M do k = 1, L c(k, i, j) = a(k, i, j) + 13 enddo enddo enddo Figure 4.2 : Source code directives used in LoopTool.
complex loop transformations. Another unique feature of our system is the use of loop-level performance measurements and the application of transformations at looplevel granularity. In addition, the search module can operate on both the search space of parameterized transformations and the search space of architectural parameters. The ability to search through the space of architectural parameters can be of great advantage for automatic tuning, as we discuss later in Chapter 6. The rest of this section discusses the core components of our framework in some detail.
4.2
Transformation Tool
We implemented a source-to-source transformation tool (LoopTool) [63] that is capable of performing a large class of high-level transformations. The transformations supported by LoopTool include tiling, unroll-and-jam, loop fusion, array contraction,
31 and iteration space splicing. The key feature in LoopTool that makes it a suitable tool for use in an empirical tuning system, is its ability to provide fine-grain control over transformation parameters. LoopTool provides this capability through the use of source level directives. Fig. 4.2 shows example directives embedded in a sample Fortran code. A directive is simply a comment line that specifies a particular transformation and an optional parameter value. These directives can be associated with any loop in the program. LoopTool processes these directives and applies the transformations accordingly, thus, providing loop-level control over transformations. In Fig. 4.2, the fuse directives associated with the outermost loops in each loop nest implies that the two loop nests should be fused only at the outermost level. The parameter value for the fuse directive specifies the fusion group of a particular loop. All loops in the same fusion group are fused together. The uj directive in Fig. 4.2 says that the outermost loop in the first loop nest should be unrolled four times. Note, since the two loop nests will be fused at the outermost level, the uj directive indicates unrolling of the fused loop body. Finally, the block directives in Fig. 4.2 specify the blocking (or tiling) factors for the two inner loops in the first loop nest. As we can see from this example code, the use of directives allows us to specify transformations and transformation parameters for each individual loop in a program. This level of fine-grain control over transformations is usually not available in commercial compilers. For example, MIPSPro allows a user-specified tile size, but applies it to every loop nest in the compilation unit. Loop-level optimization parameters cannot be specified at the command-line in any useful way. To specify an unroll factor for a particular loop at the command-line, the user would need to specify the index of the loop in lexical order and also its nesting depth. Specifying unique parameters for multiple optimizations and multiple loops would require the user to input a long complicated string that the compiler would then need to parse. Thus, the use of source directives in LoopTool provides a novel and useful way of specifying optimization parameters at loop-level granularity.
32 Function-level control over transformations is usually acceptable for optimizing compilers. However, as Waterman and Cooper argue, in the context of automatic tuning, it is important to have finer control over transformation parameters that are being tuned. There are multiple advantages to having loop-level control over transformations. This feature allows us to specify separate tiling and unrolling factors for each loop in the program. This enables application tuning at a finer granularity. Having this feature also allows us to decouple the search process from the actual application of the transformations. Moreover, it gives us the ability to construct multiple search spaces within a single program. This feature can be exploited by running multiple instances of a search on different code regions simultaneously and thus speeding up the overall tuning process.
4.3
Performance Measurement Tools
We use tools from the HPCToolkit performance analysis toolkit [52] to gather looplevel performance metrics to guide tuning. HPCToolkit collects metrics using hardware performance counters during a program’s execution and then computes aggregate metrics for each loop in the program. HPCToolkit aggregates metrics at the loop level by analyzing an application’s executable, recovering the control flow graphs (CFGs) for its procedures, applying interval analysis to recover information about loops in each CFG, and using symbol table information to determine the statements within each loop. This information is then delivered to the search engine for analysis. There are two reasons for choosing HPCToolkit over a simpler performance measurement tool that measures total execution time. First, we wanted the ability to measure performance at the loop level. For most numerical applications, execution time is concentrated around a few core loop nests. To get best results each loop nest needs to be tuned individually using different sets of transformation parameters. In many cases, these loop nests are independent from each other in the sense that the effect of applying the transformations can be evaluated on a loop-nest-by-loop-nest
33 basis. Loop-level performance measurements collected by HPCToolkit give us the ability to treat each loop individually and tailor the transformation parameters accordingly. The second reason for using HPCToolkit in our framework is the ability to collect performance metrics other than total running time. For instance, performance metrics such as cache misses and pipeline stalls indicate causes of inefficiency; for this reason, they may be better metrics than running time to use for guiding the search. We use these performance metrics as part of a composite objective function to to help guide our search strategies.
4.4
Search Module
At the heart of our framework is the search engine which integrates all of the components. We have implemented a number of search algorithms within the search module. These include pattern-based direct search [33], simulated annealing [37], window search and random search. We provide brief descriptions of these search algorithms below: Direct Search There are two main flavors of direct search that have been used for exploring the optimization search space. The simplex method is usually applied for a continuous search space, whereas the pattern-based method is used for discrete search spaces. Since the search space of transformation parameters is discrete we, implemented the pattern-based direct search method in our framework. This algorithm is described in more detail in Chapter 5. Simulated Annealing Initially a random point is selected in the search space and its neighboring points are explored. At each step, the search moves to a point with the lowest value or depending
34 on the current temperature, to a point with a higher value. The temperature is decreased over time and the search converges when no further moves are possible. Window Search In a window search, initially a window is defined over the entire search space. Then at each subsequent step the window is shrunk until it converges to a single point. At each step a sample of points is inspected in the current window and stored in a priority queue. The next smaller window is defined around the best sample points. Window search resembles the simplex search method used in exploring continuous search spaces. Random Search A random search picks random points within the search space and keeps track of the best value found at every step. Unlike the other search strategies described above, random search does not use any heuristics and it does not have any convergence criteria. The search is terminated after a pre-specified number of evaluations. We have also implemented a simple sequential search that explores the search space of architectural parameters. The search module reads in a configuration file that describes the search space and the target machine. The search space can be described either in terms of transformation parameters or architectural parameters. Description of the target machine includes the size of the register set and the capacity, associativity and line size of different levels of cache and TLB. After reading in the configuration file the search module generates an initial set of transformation parameters. The input program is compiled and run with this initial configuration. Then at each step of the tuning process, the search module uses the configuration from the previous run and the performance measurements from HPCToolkit, to generate the next set of parameters. This process continues until the search converges to a local minima or when a pre-specified tuning time has been reached.
35 Table 4.1 : Benchmarks Program advect3d erle liv18 lud mm mgrid swim vpenta
4.5
Description 3D advection for weather modeling Differential equation solver 2D Explicit hydrodynamics fragment LU decomposition (matrix-vector multiply) N x M matrix multiply Multi-grid solver Shallow water weather prediction 3D pentadiagonal inversion
Source NCOMMAS [79]
LOC 403
T. Eidson [22] 686 Livermore Loops 130 Netlib [56]
131
textbook SPEC FP 2000 SPEC FP 2000 NAS kernel
35 344 282 145
Benchmarks
Our experimental testbed includes eight programs collected from various sources. Table 4.1 displays a brief description, the source and the number of lines for each program. The test suite includes both small kernels (e.g., mm) and medium-sized applications (e.g., erle). The benchmarks also exhibit different reuse patterns with opportunities for applying a number of memory hierarchy transformations. During the course of our work on automatic tuning, we have examined several other applications including: sweep3d - a neutron transport application, CF2 - an application for analyzing free-surface liquid flows and s3d - a massively parallel solver for full compressible Navier-Stokes equations that describe the conservation of mass, momentum, and energy, and laws of gas behavior while simultaneously tracking the evolution of reactive species on a rectangular mesh [54]. We did not include any experimental results from these applications in this thesis. There are two reason for this omission. One reason is that in order to improve application performance we used techniques
36 that are beyond the scope of this dissertation. For example, we used loop unswitching and unroll-and-jam for improving s3d performance. Another reason we did not include some experimental results is because we realized that our strategy is not applicable to a particular type of application. This was the case with CF2, where the main computational loop uses a sparse matrix. As mentioned in the thesis statement, our approach focuses on dense array computations. Hence, we were not able to apply our strategy to CF2. In the rest of this document we refer to each of the programs listed in Table 4.1 using the names listed in the first column.
4.6
Platforms
Since the goal of our tuning strategy is to deliver performance across different architectures we have included a number of different platforms in our experimental framework. Table 4.2 lists the memory hierarchy parameters for each platform. The chosen platforms display wide variation in the number of floating-point registers and cache organization. Hence, these platforms serve as a good basis for evaluating our tuning strategy. In the rest of the document, we refer to these platforms using the names listed in Table 4.2.
37
Table 4.2 : Platforms CPU FP Regs. L1 L2 L3 TLB Compiler
Itanium 900 MHz Itanium2 128 16 KB, 64 B/line, 4-way 256 KB, 128 B/line, 6-way 1.5 MB, 128 B/line, 8-way 128 entries, 16 K/p, Full Intel 8.1
MIPS 300 MHz R12000 32 32 KB, 32 B/line, 2-way 8 MB, 128 B/line 2-way 128 entries, 16 K/p, Full MIPSPro 7.3.1
CPU FP Regs. L1 L2 TLB Compiler
Alpha 667 MHz Alpha 21264A 32 64 KB, 64 B/line, 2-way 8 MB, 64 B/line 128 entries, 8 KB/p, Full Compaq 5.5
Opteron 1.5 GHz AMD Opteron 242 8 64 KB, 64 B/line, 2-way 1 MB, 64 B/line 1088 entries, 4 KB/p, Full GNU Fortran 3.3.4
CPU FP Regs. L1 L2 TLB Compiler
PowerPC 2.5 GHz G5 32 32 KB, 128 B/line, 2-way 512 KB, 128 B/line 1024 entries, 4KB/p, 4-way IBM XL 8.1
Pentium 4 2 GHz P4 8 32 KB, 64 B/line, 4-way 512 KB, 64 B/line, 8-way 128 entries, 4 KB/p, Full Intel 9.1
CPU FP Regs. L1 L2 TLB Compiler
Pentium III 800 MHz PIII 8 16 KB, 32 B/line, 4-way 256 KB, 32 B/line, 8-way 8 entries, 4 MB/p, 4-way Intel 8.1
38
Chapter 5 Search Space Exploration In this chapter, we discuss an experimental study that we conducted to evaluate the performance of different heuristic search strategies in the context of empirical tuning. This study reveals that a multi-dimensional direct search strategy can be very effective in exploring the search space of transformation parameters. In addition, the study provides key insight into the characteristics of the search space of two program transformations.
5.1
Introduction
As we know, the search space of transformation parameters can be extremely large. Even for modest-sized applications the number of points in the search can go up to a million points. Clearly, an exhaustive exploration of such a large search space is not feasible if we are to make automatic tuning a practical alternative to traditional compilation. Hence, we need to use heuristic search strategies that can explore the search space of transformation parameters efficiently and effectively. The question, as to which particular search strategy to use is not easily answered, however. As discussed in Chapter 3, a number of different search strategies have been used in the context of automatic tuning, with mixed results. The main problem, of course is that we still know relatively less about the nature of some of these search spaces, and because of this we do not have models that can describe the search spaces with a high
39 degree of accuracy. Since many of the search strategies require some modeling of the search space for them to work efficiently, as yet, we have not found a suitable search strategy for exploring the search space of transformation parameters. To address this issue, we conduct an experimental study, in which we use different heuristic search strategies to explore the search space of loop unrolling and tiling parameters. The goal of this study is to find a search method that is most suitable for exploring this search space. To evaluate the performance of various search strategies we perform an exhaustive exploration of all points within the search space of each program in our test suite. Although we consider several search methods, we are primarily interested in determining the effectiveness of a pattern-based direct search method [33]. Direct search has many of the desirable properties of an empirical search strategy. Direct search is multi-dimensional, it is a derivative-free search method and in this strategy minimizing the objective function depends solely on function evaluations. Direct search is flexible in the sense that it allows tuning of the step size, which provides control over when to stop the search. Because of these properties, direct search turns out to be a good choice for use in empirical search of transformation parameters.
5.2
Direct Search
Direct search methods for nonlinear optimization have been used by computational scientists for over four decades [68, 55, 47]. The main feature of direct search that sets it apart from other optimization techniques is that the decision making process in direct search is based solely on function evaluation. So, unlike the quasi-Newton methods, direct search does not require any derivative information to find a direction of steepest descent. It was this particular feature that motivated us to apply direct
40 search to our problem domain. In the following subsections we discuss the benefits and problems associated with using direct search for our problem and describe the algorithm implemented in our system.
5.2.1
Why Direct Search?
It has been observed by researchers [15] that the search space for optimization parameters is large enough to make iterative approaches based on exhaustive search impractical. For example, if we are taking the iterative approach to finding the best compilation sequence for a compiler that supports 10 transformations - a modest number by today’s standards - then an exhaustive search would have to examine 1010 possible sequences. Even in the limited case of a few transformations, the search space can be quite large if we consider transformations whose parameters can vary. For transformations like loop unrolling, the optimization parameter determines how many times loops are to be unrolled in the program. Hence, the values for these transformation parameters can potentially be any integer. Moreover, these transformations are usually most effective when we allow each loop to have a different parameter for each transformation. So, even for a small kernel like matrix-multiply, if we are considering tiling of two loops with tile sizes from 1 to 100 and unrolling of one loop with unroll factor from 1 to 20, we end up with a search space that contains 100 x 100 x 20 or 200,000 points. Evaluating the kernel at all these points could take several days even on a reasonably fast microprocessor. Our goal is to use direct search to reap most of the benefits possible with exhaustive search for empiricallybased program tuning while only exploring a small fraction of the search space of transformation parameters. It is not just the size that makes exploring the transformation search space difficult.
41 Studies have shown that the search space is neither smooth nor continuous [15, 39]. Transformations like tiling and instruction scheduling are highly sensitive to the underlying architecture. Moreover, many of these transformations interact with each other in complicated ways. As a result, the characteristics of the search space vary from program to program, from platform to platform and even from one input set to another. Building accurate models for this search space has become extremely difficult. Hence, in the absence of such modeling, a derivative-free search method becomes a good choice to explore this optimization space. Knijnenburg et al. [40] conducted an experiment where they explored the search space of tiling sizes and unroll factors for matrix-multiply using several different search techniques. The search methods included simulated annealing, pyramid search, window search and a random search. An interesting and somewhat surprising result of that experiment was that random search performed as well (and in some cases even better than) the other more sophisticated methods. The explanation for this is that all the other search techniques assume certain properties to hold for the space that is being explored. For example, simulated annealing uses a pre-computed value called temperature when exploring the search space. At any time during the search, the decision to move to a new point is based not only on the current function value but also on the value of the temperature parameter. However, if the current temperature is computed without detailed knowledge about the search space then it may not be useful in guiding the search in the best direction. Similarly, both pyramid search and window search depend on certain properties of the search space. In using direct search to explore the transformation search space, we wanted to step away from the search methods that uses some form of modeling and use a method that relies solely on function evaluations.
42 Like most other search techniques direct search is not guaranteed to find the global minima. Hence, the result obtained through direct search may not always be as good as the one obtained through an exhaustive search. However, given the long tuning time associated with an exhaustive search this might not be that large a penalty. Another issue with direct search is that it is known to take a long time to converge when dealing with a large number of parameters (usually more than 10) [70]. This can potentially increase the compilation time to a point where it is no longer feasible to use direct search in an autotuning system. However, for our problem domain we do not necessarily need the search to converge to a local minima. By keeping track of the best value found so far we can stop the search after a pre-specified number of iterations. The experimental results from Section 5.3 suggest that this approach can be useful in finding good values even in cases when we do not wait for the search to converge to a local minima.
5.2.2
The Algorithm
To explore the search space of tiling and unrolling factors, we use a version of the pattern-based direct search method first proposed by Hookes and Jeeves [33]. We introduce the following terms to describe the algorithm. • N denotes an n-dimensional search space, where each dimension represents a transformation parameter that is being tuned • p = (p1 , p2 , ...pn ) denotes a point in the search space where pi is the value of the ith parameter • f (p1 , p2 , ...pn ) denotes the execution time for the program compiled with transformation parameters p1 , p2 , ...pn
43 • s denotes the step size, this value determines the size of the subspace that is explored during the exploratory moves The goal of the search algorithm is to find a point (p1 , p2 , ...pn ) in N such that f (p1 , p2 , ...pn ) is minimized. The algorithm proceeds by making a set of exploratory moves and pattern moves. The smaller exploratory moves identify a promising direction of movement from the current position. Once this direction has been identified, the search takes a larger jump in that direction (pattern move) and then explores that new location. This process continues until the exploratory moves fail to find a new promising direction. The major steps of the algorithm are sketched below: Step 1: Pick an initial base point p. This is done by choosing the midpoint within the range for each parameter. Step 2: Make exploratory moves. For each parameter pi we first increment its value by step size s and evaluate the program at p′ (p1 , ...pi + s, ..., pn ). If the execution time at p′ is less than the current minimum then we set the value of parameter pi to (pi + s) and move on to the next parameter. Otherwise we decrement the value of the parameter by s and evaluate the program at p′ (p1 , ...pi − s, ..., pn ). If f (p′ ) is less than the current minimum then we set the value of parameter pi to (pi − s). Otherwise the value of the parameter remains unchanged. Once all the parameters have been explored, we move to Step 3 Step 3: Make pattern move. The series of exploratory moves gives us a new point p′ in N where we are likely to find a value that is less than the current minimum. The pattern move moves the base point in the direction of p′ , that is p ← p′ − p. The execution time at this new point is evaluated. If this execution time is less than the current base point execution time then we go to Step 2. Otherwise we move to Step 4.
44 Table 5.1 : Search space properties Benchmark advect3d lud mm vpenta swim mgrid
Loops Unrolled 1 2 1 1 1 1
Loops Blocked 1 0 2 1 4 2
Search Space Points in Search Dimension Space 10 x 100 1,000 30 x 30 900 200 x 10 2,000 10 x 100 1,000 10 x 100 x 100 100,000 10 x 100 x 100 100,000
Step 4: Reduce step size. If we have reached the minimum step size then we move to Step 5. Otherwise, we reduce the step size by the step size reduction factor and go back to Step 2. Step 5: Done.
5.3 5.3.1
Evaluation Experimental Setup
For these experiments, we chose six of the benchmarks listed in Table 4.1: advect3d, lud, mm, vpenta, swim and mgrid. Table 5.1 lists the applied transformations and the dimensions of the search space for each program. The total number of points in the search space is also listed. Each transformation parameter whose value is being searched by the search algorithm corresponds to a dimension of the search space for that program. The possible range of values for each transformation parameter is chosen by hand prior to performing the search. For example, two loops are unrolled in lud and the maximum unroll factor considered for each loop is 30. Hence, for lud we have a two-dimensional search space with 900 points. For swim four loops are tiled
45 and one loop is unrolled. The four loops that are tiled come from two different loop nests and in searching for the tiling parameters we only consider square tile sizes (i.e. the same tile size is used for loops in the same loop nest). For the unrolled loop the maximum unroll factor considered is 10, whereas the tiling sizes range between 1 and 100. Hence, for swim we have a three-dimensional search space consisting of 100,000 points. A major argument for automatic tuning is its ability to deliver improved performance across a range of architectures. Hence, to determine the effectiveness of the different search strategies, we run experiments on four different platforms from Table 4.2: Itanium, MIPS, Alpha and Pentium 4. On each platform, we first compile the program with the native compiler with full optimization turned on. We run this program to get the baseline execution time. We then use direct search to search for the best tiling and unroll factors for the core loop nests of each program. At each step of the search process, the search module generates a set of parameters values that correspond to a feasible point in the search space. LoopTool interprets these parameter values and applies the transformations accordingly. The transformed source is then fed into the native compiler to produce the binary for the target platform. When compiling the transformed source with the native compiler, we disable tiling and unrolling whenever possible. This step is necessary since in some cases the native compiler actually degrades performance when it re-applies transformations that have already been applied by our high-level transformer. For each program, we allow the search to continue for 30, 60, 90 and 120 iterations, where one iteration corresponds to an evaluation of a new point in the search space either as a result of an exploratory move or a pattern move.
46 Table 5.2 : Performance improvement and tuning time on Itanium using direct search Program advectd3d lud mm vpenta swim mgrid Mean
DS Speed 1.19 3.52 1.17 1.36 1.22 1.12 1.60
30 Time 13:23 6:05 4:52 2:33 41:07 31:00
DS 60 Speed Time 1.19 25:20 4.07 9:01 1.21 9:28 1.54 5:13 1.24 1:09:11 1.15 1:04:00 1.73
DS Speed 1.19 4.07 1.22 1.54 1.24 1.15 1.74
90 Time 49:34 9:01 14:11 6:27 1:56:34 1:47:50
DS Speed 1.19 4.07 1.22 1.54 1.24 1.15 1.74
120 Time 49:34 9:01 16:39 7:36 2:25:02 1:47:50
Table 5.3 : Performance improvement and tuning time on MIPS using direct search Program advect3d lud mm vpenta swim mgrid Mean
5.3.2
DS Speed 1.00 2.98 1.54 1.61 1.04 1.04 1.54
30 Time 41:23 56:00 19:10 22:17 3:30:19 2:23:00
DS 60 Speed Time 1.05 1:21:32 2.99 1:44:45 1.58 56:04 1.65 41:23 1.04 5:30:56 1.04 3:25:12 1.56
DS 90 Speed Time 1.05 2:05:02 2.99 2:05:12 1.59 1:22:30 1.65 1:06:03 1.05 8:12:46 1.04 4:45:00 1.56
DS Speed 1.05 2.99 1.59 1.65 1.05 1.04 1.56
120 Time 4:17:24 2:05:12 1:55:45 1:20:03 8:12:46 4:45:00
Performance Across Architectures
Tables 5.2–5.5 list performance improvement and tuning time using direct search for each platform. For each platform, the reported speedup is the speedup that is obtained over the fully optimized version of the native compiler. The total tuning time includes program evaluations, compilation and search analysis time. It should be noted however, that total tuning time is generally dominated by program execution time. Thus, generally the number of program evaluations can be used as a
47 Table 5.4 : Performance improvement and tuning time on Alpha using direct search Program advect3d lud mm vpenta swim mgrid Mean
DS Speed 1.58 1.07 1.02 1.41 1.03 1.17 1.21
30 Time 7:47 11:02 6:41 8:28 1:06:03 58.29
DS 60 Speed Time 1.58 14:44 1.25 17:28 1.02 12:12 1.41 16:00 1.04 1:59:41 1.17 1:40:21 1.25
DS 90 Speed Time 1.63 19:35 1.25 21:25 1.02 18:01 1.42 21:16 1.04 3:18:50 1.17 2:24:34 1.26
DS Speed 1.63 1.25 1.02 1.42 1.04 1.17 1.26
120 Time 41:22 21:25 38:02 23:29 3:44:24 3:01:04
approximate measure for the actual tuning time. The results presented in Tables 5.2–5.5 show that our approach can yield significant performance improvement across a range of architectures. Overall, the biggest benefits are obtained on Pentium 4, on the Alpha provides the least improvements∗ . There is some variation in performance for different programs as well. But this is mostly due to the applicability of the two transformations for a particular application. For example, tiling and unrolling affects a small fraction of the executed code in mgrid. Thus, understandably, the performance improvement on this application is less than some of the other smaller kernels. Overall, the mean speedup for all programs across all platforms is about 1.70. These results suggest that automatic tuning can improve on the performance delivered by current state-of-the-art commercial compilers. ∗
The Compaq Compiler on the Alpha does not allow selective disabling of transformations. Hence,
we compiled the transformed code with the -O4 option, whereas the baseline version was compiled with full optimizations turned on (-O5 option). This may explain some of the reduced performance on this platform.
48 Table 5.5 : Performance improvement and tuning time on Pentium 4 using direct search Program advect3d lud mm vpenta swim mgrid Mean
5.3.3
DS Speed 1.23 1.52 6.46 5.75 1.00 1.05 2.84
30 Time 3:33 6:43 5:05 2:06 1:10:43 1:15:32
DS 60 Speed Time 1.27 5:20 1.53 10:33 6.60 5:28 5.75 4:00 1.00 1:56:03 1.05 2:02:07 2.87
DS 90 Speed Time 1.27 5:37 1.53 10:33 6.65 7:35 5.75 14:01 1.00 2:11:40 1.05 2:02:30 2.88
DS Speed 1.27 1.53 6.75 5.75 1.00 1.05 2.89
120 Time 5:37 10:33 9:35 14:01 2:11:40 2:02:30
Direct Search Performance
To determine the effectiveness of the direct search strategy, we first compare its performance results against results obtained using an exhaustive search. We evaluate all points in the search space for each program on the Itanium. We then use exhaustive search to find the best value within each search space. Having exhaustive data on the search spaces allows for quantitative evaluation of the performance of direct search. Table 5.6 lists the speedup obtained using exhaustive search. Table 5.6 also lists speedup obtained from direct search as a percentage of the speedup obtained from exhaustive search. Table 5.7 lists the tuning time for the two search strategies in a similar fashion. When limiting direct search to 30 iterations about 93% of the performance is gained at about 1.7% of the cost. Increasing the number of iterations gets us closer to the best speedup obtained from exhaustive search. For lud and mm we are able to find the best solution within the search space after 60 and 90 iterations respectively. The results in Table 5.6 and 5.7 show that direct search can come very close to the performance of exhaustive search at only a fraction of the cost.
49 Table 5.6 : Performance comparison between direct search and exhaustive search on Itanium Program advectd3d lud mm vpenta swim mgrid Mean
Exhaustive Speedup 1.23 4.07 1.22 1.57 1.27 1.17 1.56
DS 30 % of Best 96.75% 87.48% 95.90% 86.62% 96.06% 95.34% 92.93%
DS 60 % of Best 96.75% 100.00% 99.18% 98.08% 97.63% 97.89% 98.25%
DS 90 % of Best 96.75% 100.00% 100.00% 98.08% 97.63% 97.89% 98.38%
DS 120 % of Best 96.75% 100.00% 100.00% 98.08% 97.63% 97.89% 98.38%
Table 5.7 : Tuning time comparison between direct search and exhaustive search on Itanium Program advectd3d lud mm vpenta swim mgrid Mean
Exhaustive Time 8:27:11 2:28:23 4:08:34 2:31:19 664:28:09 831:23:45 22:13:45
DS 30 % of Time 2.64% 4.10% 1.96% 1.69% 0.10% 0.06% 0.77%
DS 60 % of Time 4.99% 6.08% 3.81% 3.45% 0.17% 0.13% 1.44%
DS 90 % of Time 9.77% 6.08% 5.71% 4.26% 0.29% 0.22% 2.13%
DS 120 % of Time 9.77% 6.08% 6.70% 5.02% 0.36% 0.22% 2.33%
The performance improvements that we obtain does come at a cost however. This cost comes in terms of longer tuning times. The total tuning time for the set of benchmarks ranges from a few minutes to several hours. This of course is a natural consequence of any iterative approach. The tuning time is mostly dominated by program execution time. As we can see from the results, increasing the number of iterations results in a proportional increase in tuning time. Also the two applications that have the longest running times suffer the longest tuning time as well.
50 Another observation to be made from the results is that performance benefits start to diminish rapidly as we run the search algorithm for longer iterations. For all platforms except Itanium, 98% of the benefits are realized after 30 iterations. Even for Itanium, going from 30 to 60 iterations yields a modest 10% extra improvement whereas the total tuning time is almost doubled. Interestingly, this behavior holds true for swim and mgrid whose search space is significantly larger than the search space of the kernels. These results suggest that the optimal cut-off point for direct search is fewer than 30 iterations. To investigate this issues further, we ran another set of experiments with a lower cut-off point for the search. The results from those experiments showed that for some programs direct search was able to find reasonably good values in as few as 15 iterations. However, for some of the other programs suitable tile sizes and unroll factors were not discovered until after 25 iterations.
5.3.4
Comparison with Heuristic Search Strategies
The comparison with exhaustive search suggests that direct search can be very effective in finding good values for transformation parameters fairly quickly. However, to determine if direct search is a good choice for automatic tuning, it is important to compare its performance with performance of other heuristic search strategies. In this section, we compare performance of direct search with random search, simulated annealing and window search. We briefly described each of these strategies in Chapter 4.1. To compare direct search with other search strategies we run a set of experiments on the search space data generated on the Itanium through exhaustive search. These experiments are run offline. This means that each search strategy operates on the same performance data generated once through exhaustive search. This ensures that
51
Fraction of Best Performace
100 98 96 94 92 90 88 30
60
90
120
Number of Evaluations Direct Search
Random
Anneal
Window
Figure 5.1 : Performance comparison of different search strategies.
all search strategies explore identical search spaces and provides a more objective comparison. Fig. 5.1 summarizes the performance of the four search strategies for all benchmarks. For each search strategy, Fig. 5.1 reports the fraction of best performance obtained as a function of tuning time. The fraction of best performance is computed using the following formula: 100 − ((F oundMin − T rueMin)/T rueMin ∗ 100) where F oundMin is the best value discovered through search and T rueMin is the best value in the entire search space. Tuning time in Fig. 5.1 is reported in terms of number of program evaluations. We observe that direct search outperforms each of the other search strategies. When stopping the search at 30 iterations the performance gap between direct search and other search strategies is about 2%. This gap increases slightly when we allow the searches to continue for more iterations. Thus, direct search proves to be a better
52 choice for exploring the search space than any of the other search strategies. It is interesting to note however, that random search, which uses no heuristics at all, performs quite well in these experiments. In fact, for 60 and 90 evaluations it does better than some of the other heuristic search strategies. Also, as we have observed, the performance gap between direct search and random search is not that large. This suggests that the benefits of improved search heuristics is somewhat limited in this context. On re-examining the search spaces, we discovered that this limited benefit is largely due to the construction of the search spaces themselves. To reap more benefits from search heuristics we first need to generate a suitable search space. We address this issue in the concluding section of this chapter.
5.4
Summary
The results of this study show that direct search strategy is able to find suitable tile sizes and unroll factors by exploring only a small fraction of the search space. The results also support the notion that an iterative approach is able to deliver performance across architectures at the cost of extra compilation time. There are several issues that still remain open. For our experiments the selection of loops and the generation of the search space was done by hand. The choice of loops to unroll or tile and the initial search space used by the search strategy has a strong impact on how well the search performs. Finding suitable ways to generate the search space automatically require further exploration. Another issue that needs to be explored is the cost of tuning time. If the iterative approach is to be employed in a production environment we need to find out the level of performance it needs to deliver so that the compilation cost is amortized over many runs of the program. We explore the issue of model-guided tuning in the following chapters.
53
Chapter 6 Model-guided Automatic Tuning of Loop Fusion In this chapter, we present a model-guided approach for automatically tuning loop fusion parameters to different architectures. We describe an architecture-sensitive cost model for fusion that is integrated into a constraint-based algorithm. We then describe how the cost model can be parameterized for use with empirical search. We present an evaluation of our strategy on seven different platforms.
6.1
Introduction
Loop fusion is recognized as an effective program transformation for improving memory hierarchy performance of applications. It is used in several commercial compilers and is gaining increased importance because of the increased usage of array assignments in languages like Fortran 95. Although fusion is a useful transformation it is not always profitable. Previous research has shown that unconstrained application of fusion can sometime lead to performance loss [20, 10]. Consider the code in Fig. 6.1. In the first loop nest we compute values of array b(). These same values are then used in the second loop nest. We can exploit this locality in b() by performing a two-level fusion. In the fused loop nest, shown in Fig. 6.1(b), the two references to array b() are temporally close enough to be put into a register. Thus, as a result of fusion we can potentially save NM memory operations. However, there is also outer-loop reuse of a() at references a(i,j-1) and a(i,j-2)
54
outer-loop reuse of a()
l1: do j = 1, N do i = 1, M b(i,j) = a(i,j)+a(i,j-1)+a(i,j-2) enddo enddo cross-loop reuse of b ()
l2: do j = 1, N do i = 1, M c(i,j) = enddo enddo
b(i,j) + d(i,j)
(a) code before fusion
lost reuse of a()
l12: do j = 1, N do i = 1, M b(i,j) = a(i,j)+a(i,j-1)+a(i,j-2) c(i,j) = b(i,j) + d(i,j) enddo enddo saved loads for b ()
(b) code after two-level fusion
Figure 6.1 : Example of un-profitable fusion.
55 in loop nest l1 that we need to consider. In the unfused version, the same memory locations in array a() are touched in every iteration of the outer loop. In the fused version, although we do touch the same locations in a(), the amount of data that we bring into cache between reuses has increased. In the fused version, we will be accessing locations in arrays b(), c() and d() before we get to the reused reference of a(). If the intermediate data between reuses is larger than the cache capacity then we will incur 2NM cache misses due to the references to a(). Moreover, by bringing in data from different arrays between reuses we also increase the likelihood of conflict misses. The occurrence of conflict misses in the loop nest can be even more damaging to performance because it can lead to lost spatial locality in both c() and d(). Thus, for many situations the code in Fig. 6.1 fusion will not yield an overall profit. We observe that these issues can be ameliorated by tiling the loop that results after fusion. We discuss the interaction of tiling with fusion in Chapter 7. Fusion can also degrade memory performance by increasing register pressure for the innermost loop. When fusing loops at the innermost level, the register demand may increase to the point where a large number of register spills occur. The cost of these spills may offset any benefits gained by improved locality in the fused loop. The possibility of exceeding the instruction cache capacity is also a concern when fusing loops with large instruction counts in the innermost loop bodies. However, as noted by Waterman, the growth in the size of instruction caches has made instruction cache overrun a relatively rare occurrence on modern architectures [77]. The problem of finding the optimal fusion solution has been shown to be NPcomplete [18]. Hence, for large applications with many fusible loops finding a good fusion solution involves using good heuristics. In this chapter, we present a strategy that combines an architecture-sensitive cost model with empirical tuning to perform
56 profitable loop fusion. Our cost model considers the size, associativity and latency of various levels of the cache in determining if it is profitable to fuse a pair of loops. We incorporate this cost model into a constraint-based fusion algorithm. We formulate two constraints for the fusion algorithm to ensure that performance does not degrade as a result of increased pressure on system resources due to fusion. Finally, we use empirical search to fine-tune fusion configurations for different architectures.
6.2 6.2.1
Cost Model Quantifying Reuse in Fusible Loops
Determining Safety The first step in quantifying reuse is to identify loops in the program that are legally fusible. We use the dependence analyzer in our autotuning framework to determine if two loops can be safely fused. Two loops can be safely fused if they are adjacent and there are no fusion-preventing dependences between them [2]. A fusion-preventing dependence is a loop-independent dependence, which, after fusion, is carried by the fused loop in the reverse direction. We identify all such dependences between loops. Any pair of loops that have at least one fusion-preventing dependence between them are not considered for fusion. Note that two loops that are not adjacent can still be legally fused as long as there are no intervening statements that fall in a path of loop-independent dependences from the first loop to the second. To simplify the analysis we only consider adjacent loops for fusion. However, before fusing loops, we run a statement motion algorithm which moves all intervening statements to the top of the first loop in the subroutine [63]. Only statements that are not involved in a dependence with any of the loops are moved upwards. Thus, at the end of the
57 statement motion phase, the set of loops that are adjacent are the ones that can be legally fused (assuming they do not have a fusion-preventing dependence).
Capturing Inter-loop Reuse To determine if it is profitable to fuse a pair of loops we first need to compute the amount of reuse that is exploited as a result of fusion. Fusion improves locality by merging loops that access the same data. Thus, any memory location that is accessed in the first loop nest and then re-accessed in the second loop nest is a candidate for potential reuse. This inter-loop reuse can be captured in a dependence graph through the use of loop-crossing dependence edges. A loop-crossing dependence is defined as follows: Definition 1 Let l1 and l2 be two adjacent fusible loop nests where reference r1 accesses location M in some iteration i in l1 and reference r2 accesses location M ′ in some iteration j in l2 . Then there is a loop-crossing dependence from r1 to r2 if M = M ′. To quantify reuse in fusible loops we start with the dependence graph for single loop nests. Then for each pair of adjacent loop nests we add loop-crossing dependence edges between the two dependence graphs. This extended dependence graph is able to identify points of potential reuse in fusible loops. However, in some cases the graph might overestimate the amount of reuse exploited by fusion. Consider the example in Fig. 6.2. There are two loop-crossing dependences from the reference to a(i,j) in l1 to a(i,j-1) and a(i,j) in l2 . It might appear that by fusing the loop nests l1 and l2 we will be able to save 2NM memory operations for references to array a() in l2 . However, we note that there is temporal reuse carried by the outer loop between
58
+ b(j) loop-crossing
do j = 1, N do i = 1, M d(i,j) = a(i,j) enddo enddo loop-crossing
l1 :
l2: do j = 1, N do i = 1, M c(i,j) = a(i,j-1) + a(i,j) enddo enddo outer
Figure 6.2 : Multiple loop-crossing dependences in fusible loops.
a(i,j-1) and a(i,j). Since the memory location that is accessed by a(i,j) in l1 will be accessed by a(i,j) in l2 before it is accessed by a(i,j-1), the reuse distance we need to consider to quantify reuse in a(i,j-1) is the distance for the outer loop reuse and not the loop-crossing reuse.
Pruning the Dependence Graph To account for the above situation we need to prune the graph so that the sink of each loop-crossing dependence represents a potential savings in memory operations. We note that if there are multiple loop-crossing dependences emanating from the same source reference then all but one of the loop-crossing dependence edges can be
59 eliminated. The edge that remains is the one that points to the sink reference that has no incoming dependence edge from within the loop nest. Similarly, if there are multiple loop-crossing dependences that have a single reference as their sink we can eliminate all but one of the edges. In this case, the edge that remains is the one that has a source with no dependence edges flowing into it from within the loop nest. In addition to handling the loop-crossing dependences we also need to prune the dependence graph for each loop nest so that the pruned graph has at most one predecessor for each reference and that predecessor refers to the most recent use of the sink. This pruning is essential for our cost model which assumes one predecessor per sink in order to avoid double counting of cost on particular references. We adopt strategies described by Carr [8] and Allen and Kennedy [2] to perform this pruning. The strategy involves eliminating all killed dependences from the graph and in cases of group temporal reuse keeping only those edges that have the smallest dependence threshold. A typed fusion algorithm is used in finding name partitions and eliminating redundant input dependences.
Hierarchical Classification of Reuse Once we have the pruned dependence graph we need to augment it to include information about reuse distances and memory hierarchy levels. The effects of fusion may not be beneficial across all levels of the memory hierarchy. As we observed in the example presented in the previous section, fusing the pair of loops improved register reuse but had an adverse effect on cache locality. Hence, to improve overall memory performance we need to be able to quantify reuse that is exploited at each level of the memory hierarchy. The reuse classification described by Wolf and Lam [81] is not suitable for han-
60 dling multiple levels of the memory hierarchy. To address this, we introduce a new classification of temporal reuse based on the level at which locality is exploited. We associate with each sink node in the dependence graph a value that expresses the level at which the reuse is exploited. This term is called the reuse level of a reference and we define this formally as follows: Definition 2 Let Li refer to the memory at level i. Then the reuse level of a reference r involved in temporal reuse is the smallest k such that ReuseDistance(r) ≤ Capacity(Lk ) where Capacity(Lk ) is the number of lines that can simultaneously occupy the cache at level k.
6.2.2
Accounting for Conflict Misses using Effective Cache Capacity
Conflict misses can be a big concern for profitable fusion. When fusing loops we often bring accesses to a number of different arrays within the iterations of a single loop nest. If the array locations overlap in cache then we must pay the penalty of increased conflict misses. To account for conflict misses, we extend the cache associativity model described by Hill and Smith [32]. We compute the probability of a cache line being evicted before it is reused based on the size and associativity of the cache and the reuse distance. We use the following notation to describe this probabilistic model: r1 and r2
references to the same cache line
m
reuse distance between r1 and r2
s
number of sets in cache
a
associativity
61 If we assume that each line from m is equally likely to be mapped to any of the sets (a reasonable, but questionable, assumption that will be revisited in Section 6.4.1) then P r[a lines landing in line occupied by r1 ] = P r[conflict miss on r1 ] �m−i m � � � �i � X s−1 1 m = s s i i=a �m−i a−1 � � � �i � X 1 m s−1 = 1− i s s i=0 Now, we introduce a tolerance term T that expresses how high a probability of a conflict miss we are willing to accept. We then have, T ≥ P r[conflict miss on r1 ] = 1 −
�m−i a−1 � � � �i � X s−1 1 m i=0
i
s
s
Let us define MaxReuseDistance(a, s, T ) as the maximum integral reuse distance m such that P r[conflict miss on r1 ] ≤ T . Given a tolerance term T and the size and associativity of a cache at level k we can express a formula for effective cache capacity (ECC) as follows ECC(Lk ) = MaxReuseDistance(ak , sk , T )
(6.1)
where, sk and ak refer to the size and associativity of the cache at level k. Using this model of effective cache capacity we can adapt the definition for the reuse level of a reference to take conflict misses into account. Definition 3 Let Li refer to the memory at level i. Then the reuse level of a reference r involved in temporal reuse is the smallest k such that ReuseDistance(r) ≤ ECC(Lk )
62 6.2.3
Estimating Profitability
With reuse information and the heuristics for conflict miss in place we are now able to estimate the profitability of fusing a pair of loops. For each loop-crossing dependence in the pruned graph we want to determine how many memory operations are saved as a result of placing the source and the sink within the same iteration of the fused loop. We use the following in describing our profitability model: l1 , l2
candidate loops for fusion that have the same nesting depth
D
set of loop-crossing true and input dependences between l1 and l2
C
set of dependences carried by either l1 or l2
ReuseLevelpre (d)
reuse level of d before fusion
ReuseLevelpost (d) reuse level of d after fusion cache at the k th level where 0 ≤ k ≤ L, where L0 is the
Lk
register level LL is main memory cost(Lk )
cost of a miss access to Lk
Then, for each d ∈ D we assign a weight w based on the following condition: if ReuseLevelpre (d) > ReuseLevelpost (d) then ReuseLevelpre (d)−1
w(d) =
X
i=ReuseLevelpost (d)
else w(d) = 0 Then total weight is just X d∈D
w(d)
cost(Li )
63 Computing the number of memory accesses saved from loop-crossing dependences, by itself, is not enough to determine if fusion is profitable. As illustrated in the example in Fig. 6.1, in some cases fusion may reduce locality within loop nests: when fusing two loops the reuse distance of any carried dependence increases if that reuse is also not involved in a loop-crossing dependence. We need to account for all such cases where fusion might lead to loss of potential reuse. For each c ∈ C we need to compute the cost based on the following condition: if ReuseLevelpre (c) < ReuseLevelpost (c) then ReuseLevelpost (c)−1
w(c) =
X
cost(Li )
i=ReuseLevelpre (c)
else w(c) = 0 Then total cost is X
w(c)
c∈C
Hence, the final formula for computing the weight between two fusible loops is: W (l1 l2 ) =
X d∈D
6.2.4
w(d) −
X
w(c)
c∈C
Resource Constraints
A detailed analysis of the savings in memory cost does not guarantee beneficial fusion. There are several factors that can affect fusion that are not captured by the model we presented for computing weights. Most of these factors have to do with the resource requirements of the fused loop. If the requirements for a particular resource is higher than what is available to the program then the benefits of improved locality through
64 fusion may not be realized. In this section, we establish a set of constraints that need to be considered by a constraint-based fusion algorithm [19]. (i) Register Pressure: If the number of required registers for the fused loop body is more than what is available then we have to pay the price for spill costs. To account for register pressure we enforce the following constraint: RegisterP ressure(lf ) ≤ Register Set Size where lf refers to a fused loop nest. We use the methods presented by Carr [8] to estimate register pressure in a loop body. Information about the number of registers available to the program is collected before compilation.
(ii) Instruction Footprint: If the number of instructions in the fused body exceeds the size of the instruction cache then we must pay the penalty of fetching those instructions from memory. Again, this phenomenon should be considered when fusing two loops. Instructions(lf ) ≤ Capacity(Ik ) where lf refers to a fused loop nest and Ik is the instruction cache at level k. Note that, although data cache capacity is another critical resource requirement for a program, we do not include it as a constraint here. When using our cost model with a weighted fusion algorithm the weights of the individual edges account for the data cache miss costs. Thus, we need not consider the total data requirements of the fused loop as a separate constraint.
65 6.2.5
Using the Model with a Greedy Fusion Algorithm
The cost model and resource constraints that we formulated can be incorporated into a constraint-based weighted pair-wise fusion algorithm [19]. In this algorithm, fusion is formulated as a graph clustering problem in which vertices represent loops in the program and weights represent the amount of benefit obtained by fusing the endpoints. Pair-wise greedy fusion considers for fusion only prime edges - edges whose endpoints are joined by no other path. At each step, the algorithm picks for fusion the heaviest prime edge in the graph whose endpoints can be fused without exceeding the resource constraints. After each fusion operation, weights are recomputed and the graph is updated with new successor, predecessor and prime edge information. At termination the algorithm produces the best set of fused loops according to the greedy heuristic. The chief issue that needs to be considered in incorporating our model with the greedy algorithm is the cost associated with recomputing the weights at every step. Since we perform a detailed analysis in calculating the benefits of fusing two loops, we need to annotate the graph with more information to make the re-weighing process more efficient. We construct the pruned dependence graph with reuse information as described previously. We then group the references within each loop nest and label the subgraphs as supernodes. We compute the weights between each pair of fusible loops according to the procedure described in Section 6.2.3. We connect each pair of supernodes using these weights. Hence, each pair of supernodes has only one node connecting them that represents the net gain from fusing the two loops. Now, the pair-wise fusion algorithm can proceed normally on the supernodes and the edges between them. After fusing a pair of loops, edge weights between supernodes have to be updated and the loop-crossing dependence edges adjusted. For this step, we
66 need to examine each loop-crossing dependence coming into and going out of the fused loop nest. The edges within the supernodes representing outer-loop reuse also have to be examined. We note however, that the number of edges in both cases is bounded above by the number of arrays in the loop. Hence, the complexity of a re-weighing operation will be O(A) where A is the number of arrays in the program. Having the complexity of the update operation bounded by the number of arrays ensures that the fast greedy algorithm will be able to maintain its original asymptotic time bound, in spite of the more detailed profitability analysis.
6.3
Empirical Search
Even the most detailed analytical models may not produce the optimal fusion solution. Profitable fusion depends on a number of architectural features and it is often difficult to determine a priori how these features will interact with the fusion choices. The task of estimating machine parameters becomes particularly difficult because we see the underlying hardware through the compiler’s lens∗ , which distorts our view of the target platform. For example, using the model presented in Section 6.2.3 we may be able to make a prediction about the possibility of conflict misses but we cannot say how good our prediction is until the program is actually run on the target machine. Similar uncertainties remain in measuring register pressure and cache footprints. Our approach to dealing with these uncertainties is the use of empirical tuning. In this section, we show how our cost model for loop fusion can be parameterized and used in an empirical tuning framework. The basic idea behind our algorithm for empirically tuning fusion parameters is to identify key architectural parameters (e.g. available registers) that impose constraints ∗
phrase coined by Keith Cooper
67 on fusion choices. Then, for each such parameter P , we introduce a tolerance term Tp and construct a function that computes the effective capacity of P based on the given value of Tp . P ′ = EffectiveCapacity(Tp , P, ...) s.t. P ′ ≤ P The rationale for using the concept of effective capacity is that generally the amount of resources that can be exploited by a program is some fraction of the resources that is actually available on the target machine. For example, the effective cache size at a particular level is reduced by the possibility of conflict misses, as we shall see below. Hence, to apply resource-dependent transformations (i.e. fusion) profitably, we need to use analytical models that can estimate how much of a given resource is available to the program. However, the amount of resource available is determined by a host of factors. For example, the fraction of cache we can exploit depends on the size and associativity of the cache, the number of different arrays accessed in the program and the size of each of those arrays. Moreover, memory allocation and optimization strategies employed by the compiler also have an impact on the amount of cache that is available to a program. A static model that attempts to capture all these parameters is unlikely to be totally accurate for all architectures. The goal of our tuning strategy is to correct for these inaccuracies in the cost model. Fig. 6.3 gives an abstract algorithm for our tuning strategy. For each tuning parameter in the search space, we start off conservatively with a low tolerance term and increase the value of Tp at each subsequent iteration. We stop the iterative process either when performance degrades or when we have reached the availability threshold of a particular resource. Since at each step we only relax some fusion constraint, it is easy to show that the set of fused loops grows monotonically during the tuning process. Because of this property, to find the best fusion configuration,
68
/* /* /*
src is source of program to be tuned */ T~ is a vector of tolerance values */ numDims is number of dimensions in the search space */
T~ ← InitT olerance() curV ariant ← ApplyGreedyP airW iseF usion(src, T~ ) execT ime ← CompileRunMeasure(curV ariant) bestT ime ← execT ime bestV ariant ← curV ariant for i = 1 to numDims do repeat /* increase tolerance and generate new program variant*/ repeat T~ ← IncT olerance(T~ , i) ~ curV ariant ← ApplyGreedyP airW iseF usion(src, T) numInc++ until curV ariant 6= bestV ariant and !ReachedT hreshold(T~ , i) execT ime ← CompileRunMeasure(curV ariant) /* keep track of best execution time and best program variant */ if (execT ime ≤ bestT ime) then bestT ime ← execT ime bestV ariant ← curV ariant else T~ ← DecT olerance(T~ , i, numInc) end if until (execT ime > bestT ime) /* stop search in this dimension when performance no longer improves */ end for Figure 6.3 : Algorithm for empirical search of fusion configurations.
69 we choose a search strategy that is sequential and orthogonal. For n resources we have an n-dimensional search space where the size of each dimension is the range of tolerance values for a particular resource. For each dimension we perform a sequential search. When searching in a particular dimension we use reference values for all other dimensions. Our model includes three memory hierarchy resources: data cache capacity, register set size and instruction cache capacity. Although these three resources are somewhat similar, they interact with fusion choices in different ways and hence constitute individual search dimensions. We discuss the tolerance terms and feedback parameters for each of these resources next. (i) Effective Cache Capacity: We compute the effective cache capacity using Eq. 6.1. Intuitively, Eq. 6.1 tells us what fraction of the cache we can use so that there is T probability of a conflict miss between two accesses to the same memory location. So, in this case we have Effective Cache Capacity = E(a, s, Tcache ) where E(a, s, Tcache ) is obtained from Eq. 6.1. We start off with a low value for Tcache (Tcache < 0.02) and at each step increment Tcache by 0.05 and measure the number of data cache misses at different levels. We stop the search in this dimension when we reach a Tcache for which the number of cache misses increases. (ii) Effective Register Set: We use the register pressure constraint to moderate register pressure in the fused loop. For this constraint, we have the following equation for the tolerance term Treg : Effective Register Set = ⌈Treg × Register Set Size⌉ where 0 ≤ Treg ≤ 1
70 For our experiments, the value of Treg for the register pressure constraint ranges between 0.5 and 1.0. The increment value is 0.1. Feedback parameters we use here are total loads and cycle count. Both parameters serve as good indicators about the occurrence of register spills. (iii) Effective Instruction Cache Capacity: The instruction cache constraint is dealt separately since we do not compute reuse distances for instructions and we are mainly concerned with capacity misses. So, in this case we have: Effective I-Cache Capacity = ⌈Ticache × Capacity(I-Cache)⌉ where 0 ≤ Ticache ≤ 1 The range and increment values of Ticache in this case are identical to values used in the register pressure constraint. For feedback, we measure instruction cache misses directly.
6.4 6.4.1
Evaluation Accuracy of the Effective Cache Capacity Model
The cache miss model presented in Section 6.2.1 makes the assumption that memory accesses between any two reused references are essentially random. Although this scheme works well when integrated with the rest of our framework, it is important to evaluate the accuracy of the model on its own. In this section, we present experimental results that compare the accuracy of the miss rate predicted by our model against measured miss rates on three different programs. Our conflict miss model does not predict the miss rate in a program directly. However, using Eq. 6.1, we can derive an upper bound for the miss rate for a given cache configuration and a tolerance term T . If the number of reused references in a
71 program is n and all reuse distances in the program are less than the effective cache capacity then, according to our model, Expected Misses ≤ nT From the above we get, Expected Miss Rate =
Expected Misses ≤ nT /n = T Total Reused References
We use Eq. 6.1 to generate effective cache capacity for a fixed size cache with varying degrees of associativity. For each cache the tolerance term T is set to four different values: 0.01, 0.05, 0.10 and 0.15. We then force the maximum reuse distance in the program to be less than the computed effective cache capacity by picking a small enough data set size. To get accurate measurements without interference from other architectural features we conducted experiments using a cache simulator instead of a real machine. We use the Simplescalar [6] cache simulator to simulate several different cache configurations. Here, we present and analyze results from a direct-mapped and a 2-way set associative cache both 32KB in size with 32B lines. The first set of experiments is performed on randaccess, a synthetic benchmark we wrote to validate our model. In randaccess we iterate over an array several times. Between each iteration we access m distinct random locations in memory each of which land in a different cache line and none of which overlap with locations in the array. Thus the reuse distance for each reused reference in randaccess is exactly m cache lines and the reuse pattern conforms to the assumption that each cache line accessed within the reuse distance is equally likely to cause a conflict miss. Hence, for randaccess we expect our predicted miss rate to closely match the measured miss rate.
72 18% 16%
Miss Rate
14% 12% 10% 8% 6%
d
4% 2% 0% (10, 76)
(52, 182)
(107, 272)
(166, 349)
Reuse Distance (cache lines) Predicted
Measured (Direct)
Measured (2-way)
Figure 6.4 : Accuracy of cache miss model on randaccess.
The results from experiments on randaccess are presented in Fig. 6.4. The measured miss rates reported in the graph are average miss rates over 100 runs of the program. The data points on the x axis correspond to the effective cache capacity computed by our model for the two cache configurations. As expected, when we enforce random access of memory locations between reuses of the same location the model is able to predict the miss rate in the program quite accurately. For both the direct-mapped and 2-way cache, the difference between the predicted rate and the measured rate is never more than 1%. We realize however, that the reuse pattern in a real application is unlikely to be totally random. Hence, we want to determine how much the accuracy of our model drops when the assumption of random access to memory locations is violated. We perform the second set of experiments on a C-implementation of erle. The experimental results are presented in Fig. 6.5. In this case, we see that our prediction does not match the measured miss rates as closely. For smaller reuse distances the discrepancy is not that high but as we move on to larger data sets with more variability
73 16% 14%
Miss Rate
12% 10% 8% 6% 4% 2% 0% (10, 76)
(52, 182)
(107, 272)
(166, 349)
Reuse Distance (cache lines) Predicted
Measured (Direct)
Measured (2-way)
Figure 6.5 : Accuracy of cache miss model on erle.
in reuse distances the difference between the predicted rate and the measured rate goes up to as high as 10%. We observe however, that the predicted miss rate is always greater than the measured miss rate. Thus, as an upper bound for the miss rate the model still works well. In most cases, a conservative estimate of the effective cache capacity is good enough to make the right fusion choices through empirical tuning. However, in some cases a conservative estimate may lead to an underutilized cache and also have adverse effects on other transformations such as tiling. We address these issues later in the section. It is difficult to predict exactly what kind of reuse pattern we will observe in any given program. However, for many scientific applications it can be generally summarized as a set of loops sweeping through a number of contiguous arrays. We wrote our third benchmark arraysweep with this reuse pattern in mind. arraysweep sweeps through k arrays a fixed number of times producing reuse in each of the k arrays. The inner loop is tiled with respect to the outer so that the reuse distance of each reference can be controlled by varying the tiling factor. For our experiments,
74 16% 14%
Miss Rate
12% 10% 8% 6% 4% 2% 0% (10, 76)
(52, 182)
(107, 272)
(166, 349)
Reuse Distance (cache lines) Predicted
Measured (Direct)
Measured (2-way)
Figure 6.6 : Accuracy of cache miss model on arraysweep.
we derive the sweep length using the following formula: Sweep Length = Effective Cache Capacity/k For arraysweep we also wanted to eliminate the effects of the compiler’s allocation strategy on the conflict miss rate of a program. Simplescalar uses the GNU C compiler (GCC) which uses an optimized malloc() for allocation of larger arrays. To avoid the impact of GCC’s optimized memory allocation strategy, we control allocation of each array in arraysweep and ensure that each array starts off at a random location in memory. The experimental results with arraysweep using 4 arrays are presented in Fig. 6.6. As was the case with erle our model over predicts the miss rate for arraysweep. However, the discrepancy between the predicted rate and the measured rate is smaller in this case. This increased accuracy in the predicted miss rate is explained by two factors. First, the reuse distance for each reference in arraysweep is the same number of cache lines. If there are reused references with small reuse distances that are not affected by the effective cache capacity then those references will have a positive impact on the miss rate regardless of what effective cache capacity
75 is chosen. Thus it is likely that the inner loop carried dependences in erle contribute to the larger gap between the predicted miss rate and the measured miss rate. The second factor that improves the accuracy of our prediction for arraysweep is the allocation strategy we use. We notice in Fig. 6.5 that in some cases the measured miss rate for erle decreases slightly as we increase the data set size. This is a direct consequence of the optimized allocation strategy used by GCC for the larger data sets. Forcing the arrays in arraysweep to start in random locations results in more predictable behavior. We observe a steady increase in the measured miss rate as the data set size is increased. Since our model does not account for any optimizations in the allocation strategy, it fares better on arraysweep then on erle. In summary, the experimental results in this section suggest that our model is able to predict an upper bound for the conflict miss rate with reasonable accuracy. However, the predicted upper bound for the miss rate may be significantly greater than the actual miss rate of the program. Although a conservative estimate suffices for profitability estimates of transformations such as fusion it is important to consider its implications on other transformations. A key transformation for improving memory performance in numerical applications is tiling. If we use our conflict miss model with tiling then the effective cache capacity would directly determine the tile factor for a given loop nest. In that case, a conservative estimate would imply choosing a smaller tile size which in turn may lead to lost reuse in inner loops. In such situations we need a cost model that accounts for these trade-offs. We discuss such a cost model in the next chapter.
76 6.4.2
Comparing Different Search Spaces
In this section, we illustrate some of the characteristics of the fusion configuration search space using a simple experiment. For this experiment, we only consider fusion of innermost loops and tuning of the effective register set parameter. We first explain the fusion parameter search space, then the search space for the effective register set and then present results from an experiment comparing the two search spaces. If reordering of loops is not allowed, the number of different ways to fuse k loops is 2k−1. Thus, the number of points in the fusion search space of k loops is 2k−1. We can represent the search space of different fusion configurations using a bit pattern where each bit corresponds to an edge between two fusible loops. A bit is set if the corresponding adjacent loops are fused. For example, if we have eight fusible loops then we need bit strings of length seven where bit string 0000000 corresponds to no loops being fused and 1111111 corresponds to all loops being fused. As explained in Section 6.3, the size of effective register set search space depends on the range of tolerance values used in the search. Hence, the number of points in the search space is determined by how finely we wish to tune the parameter. For example, if we increase our tolerance by 0.05 at each step then we will have just 20 points in the search space. Note, that if increasing our tolerance does not result in a larger effective register set or a different fusion configuration then that point in the search space does not need to be evaluated. Thus, the number of points in the search space is bounded above by the size of the register set of the target platform and in practice, the number of points that need to be evaluated is likely to be much smaller than this upper bound. To compare the two different search spaces we perform a simple experiment with the advect3d kernel. The advect3d kernel has a total of 24 loops divided into
77
Performance (MFLOPS)
800 750 700 650 600 550 500 450 400 350 300 0
12
24
36
48
60
72
84
96
108
120
Fusion Configuration
Figure 6.7 : Performance curve for fusion configuration search space on Opteron (advect3d).
Performance (MFLOPS)
800 750 700 650 600 550 500 450 400 350 300 0.1
0.2
0.3
0.4
0.5
0.6
0.7
0.8
0.9
1.0
Tolerance Value
Figure 6.8 : Performance curve for effective register set search space on Opteron (advect3d).
78 eight loop nests which are perfectly nested. All loop nests are fully fusible. For this experiment, we consider fusing only the innermost loops without any reordering. Thus, the fusion search space for advect3d contains 28−1 = 128 points. The size of the search space of the register set parameter is dependent on the tolerance value increments and the number of physical registers in the target platform. We present performance results for these two search spaces on an Opteron and a Pentium 4 with 32 and 8 floating-point registers, respectively. For both platforms, we increase tolerance by 5% at each step. Hence, for both platforms, the register set search space contains 20 points. However, since the number of registers on Pentium 4 is less than 20, the number of points that result in different fusion configurations is bounded above by the number of physical registers. The performance of all possible fusion configurations on the Opteron is shown in Fig. 6.7. As expected, the performance line is very jagged with many peaks and valleys. The performance curve for the effective register set search space on the same platform is shown in Fig. 6.8. This search space is much smaller than the search space of fusion configurations. However, the important point to note here is that the performance line for this search space is relatively smooth. Not only that, the performance line follows a specific pattern. Initially, when we increase tolerance from very low values (i.e. 0.1) performance keeps increasing. Then, when Treg = 0.55, there is a big drop in performance. According to our search heuristic, Treg = 0.55 represents the threshold point and no further exploration of the search space is necessary. Indeed, we observe that none of the points beyond this threshold produce better performance. Hence, we could stop our search after evaluating just seven points in this search space. Another issue to note, is the leveling-off of the tail-end of the performance curve. This happens because all eight loops in advect3d are fused at the 0.55 tolerance level and
79
Performance (MFLOPS)
1500 1450 1400 1350 1300 1250 1200 1150 1100 0
12
24
36
48
60
72
84
96
108
120
Fusion Configuration
Figure 6.9 : Performance curve for fusion configuration search space on Pentium 4 (advect3d).
the fusion configuration does not change for any value of Treg beyond that point. Hence, even if we were doing an exhaustive search we would not need to evaluate this portion of the search space. The performance curves for advect3d on Pentium 4 are presented in Figs. 6.9 and 6.10. We notice very similar results on this platform as well. A jagged performance line for the fusion configuration search space and a smooth line for the search space of the effective register set parameter. Since Pentium 4 has so few floatingpoint registers, only a single pair of loops is fused when we increase our tolerance to a 1.0. This explains the long flat segment at the beginning of the performance line in Fig. 6.10. Our search heuristic does not evaluate points beyond the 1.0 threshold. Hence, the search on this platform stops at Treg = 1.0 after fusing just one pair of loops. To verify that this conservative approach is indeed the right one, on this platform, we forced the search strategy to evaluate points beyond Treg = 1.0. As the results in Fig. 6.10 show, going beyond the maximum threshold and trying to fuse
80
Performance (MFLOPS)
1500 1450 1400 1350 1300 1250 1200 1150 1100 0.1
0.3
0.5
0.7
0.9
1.1
1.3
1.5
1.7
1.9
Tolerance Value
Figure 6.10 : Performance curve for effective register set search space on Pentium 4 (advect3d).
more loops makes the performance worse. Thus, for this platform it is best to stop at Treg = 1.0. 6.4.3
Tuning Strategy Performance
We implemented our cost model and search algorithm in our autotuning framework described in Chapter 4. In this section, we present an evaluation of our strategy using experimental results on seven different platforms described in Table 4.2. For these experiments, we select four programs from the set of programs listed in Table 4.1: advect3d, erle, liv18 and mgrid. All four programs present several opportunities for loop fusion and thus serve as a good test suite for evaluating our strategy. We apply our cost model to each program and use LoopTool to restructure the code with the desired fusion configuration. The transformed source is then compiled using the native compiler on the target platform. To avoid conflicts with the optimization strategies of the native compiler, transformed programs are compiled with fusion turned off
81 Platform Itanium
Compiler Intel 8.1
MIPS
MipsPro 7.3.1
Alpha
Compaq 5.5
Opteron
GNU Fortran 3.3.4
PowerPC
IBM XL 8.1
Pentium III
Intel 8.1
Flags for baseline version -O3 -tpp2 -ipo -static mP2OPT hlo fusion=F -132 -O3 -R12000 -OPT:Olimit=0 -TARG:platform=IP27 LNO:fusion=0 -O4 -align dcommons assume noaccuracy sensitive -math library fast -arch EV67 -tune EV67 -O3 -m64 -march=opteron -ffixed-line-length-132 -O4 -qarch=g5 -qcache=auto qhot -qipa=level=2 -qtune=g5 qfixed=132 -O3 -mP2OPT hlo fusion=F -132
Table 6.1 : Compiler flags used on different platforms
whenever possible. Flags used to compile programs on different architectures are listed in Table 6.4.3. In the discussion that follows, we use the following terms to refer to the different optimization strategies: baseline
no fusion
model-based
model-based tuning strategy described in this chapter
simple
fusion of all loops that share data
native
fully optimized version generated by native compiler
MIPS Figs. 6.11 and 6.12 show performance results for the four applications on the MIPS. On this platform, the most significant improvement is observed for liv18. In this case, model-based decides to fuse all three loops to the innermost levels. The MIPSPro
82
1.67
1.4
5.07
1.4
5.07
1.2
Normalized Count
Normalized Count
1.2 1.0 0.8 0.6 0.4 0.2
1.0 0.8 0.6 0.4 0.2
0.0
0.0 Cycles
Loads
L1 Misses L2 Misses
TLB Misses
I1 Misses
I2 Misses
Cycles
Loads
L1 Misses L2 Misses
Performance Metric
base
model-based
simple
I1 Misses
I2 Misses
Performance Metric
native
base
model-based 1.00 simple
(a) advect3d
native 0.97
(b) erle
1.4
1.4
1.2
1.2
Normalized Count
Normalized Count
TLB Misses
1.0 0.8 0.6 0.4
1.0 0.8 0.6 0.4 0.2
0.2
0.0
0.0 Cycles
Loads
L1 Misses L2 Misses
TLB Misses
I1 Misses
I2 Misses
Cycles
Loads
L1 Misses L2 Misses
base
model-based 0.90 simple
(c) liv18
TLB Misses
I1 Misses
Performance Metric
Performance Metric
native 0.70
base
model-based 0.59 simple
(d) mgrid
Figure 6.11 : Memory performance on MIPS.
native 0.60
I2 Misses
Speedup over baseline
83
1.45 1.30 1.15 1.00 0.85 0.70 advect3d
erle
model-based
liv18
simple
mgrid
native
Figure 6.12 : Performance improvement on MIPS.
compiler, by contrast, refrains from fusing the third loop nest. It is not totally clear as to why the MIPSPro compiler decides not to fuse the third loop nest. We speculate this may be due to alignment issues or because of a heuristic used in the compiler to account for register pressure. For this benchmark, the initial fusion configuration recommended by our cost model is less aggressive. Because of the possibility of increased register pressure and conflicts in the L1 cache, our cost model suggests performing outer-loop fusion for all three loops and then fusing only the last two loops to the innermost levels. However, the empirical search in our strategy determines that the loss due to increased loads is more than offset by the benefits from reduced cache misses when we perform a more aggressive fusion. Hence, on this platform model-based fuses all three loop nests to the innermost levels. Thus, this is one instance where empirical search is able to achieve additional gains from loop fusion. On advect3d and erle, native performs worse than base. For advect3d, native does an overly aggressive fusion resulting in a large inner loop body which causes a
84 number of register spills and also introduces conflicts in the L2 cache. On the other hand, model-based refrains from fusing some of the loops because of the register pressure constraint. On mgrid, model-based shows only marginal improvement over baseline. On this application, native is able to get higher performance than model-based. Inspecting the code generated by the MIPSPro compiler, we found that it performs a more aggressive fusion for mgrid, increasing both register pressure and the possibility of conflict misses within the fused loop nest. However, the MIPSPro compiler then applies tiling to the fused loop nest to improve locality for the cache. This combined transformation strategy is effective in improving the memory performance for mgrid. We observe a similar situation with advect3d where MIPSPro applies tiling to the fused loop nest. However, in that case, tiling is not able to mitigate the excessive register pressure caused by fusion. In fact, for advect3d, applying tiling to the fused loop nest further aggravates the loss in performance. These results emphasize the need for considering the interaction of loop fusion with other program transformations. We address this issue in Chapter 7. Note that, for both advect3d and erle there is a significant increase in the normalized count of level one I-cache misses for native. However, in absolute terms the total number of I-cache misses is quite small. Thus, the relative increase of I-cache misses does not have a significant impact on performance for either of these applications. In fact, for all four applications on all platforms the number of I-cache misses is never large enough to have a major impact on performance.
1.4
1.4
1.2
1.2
1.0
1.0
Normalized Count
Normalized Count
85
0.8 0.6 0.4 0.2
0.8 0.6 0.4 0.2
0.0
0.0 Cycles
Loads
L2 Misses L3 Misses
TLB Misses
I1 Misses
I2 Misses
Cycles
Loads
L2 Misses L3 Misses
Performance Metric
base
model-based
simple
I1 Misses
I2 Misses
Performance Metric
native
base
(a) advect3d
model-based
simple
native
(b) erle
1.4
1.4
1.2
1.2
1.0
1.0
Normalized Count
Normalized Count
TLB Misses
0.8 0.6 0.4
0.8 0.6 0.4 0.2
0.2
0.0
0.0 Cycles
Loads
L2 Misses L3 Misses
TLB Misses
I1 Misses
I2 Misses
Cycles
Loads
L2 Misses L3 Misses
model-based
(c) liv18
simple
I1 Misses
Performance Metric
Performance Metric
base
TLB Misses
native
base
model-based
(d) mgrid
Figure 6.13 : Memory performance on Itanium.
simple
native
I2 Misses
Speedup over baseline
86
1.45 1.30 1.15 1.00 0.85 0.70
advect3d
erle
model-based
liv18
simple
mgrid
native
Figure 6.14 : Performance improvement on Itanium.
Itanium Performance results on the Itanium for the four applications are presented in Figs. 6.13 and 6.14. These results show that model-based is quite effective on this platform. The Itanium has a large number of floating-point registers, which allows us to fuse loops more aggressively to improve cache locality without incurring the cost of excessive registers spills. In fact, on this platform, the fused loop structures generated by model-based is the same as those generated by simple for all four applications. Thus, we do not see any performance difference between these two strategies. Itanium is the only platform where fusing all 27 loops in advect3d into one single loop nest turns out to be profitable. This aggressive fusion does create a large inner loop body but because of the larger register set, the machine is able to withstand the high register pressure. Thus, we see the most significant performance improvement for advect3d on this platform. model-based achieves locality at both the level two and level three cache and also improves register reuse as indicated by the fewer number
87 of loads in Fig. 6.13(a). On liv18, model-based achieves improved locality for both the cache levels but incurs 20% extra loads. This result is somewhat surprising since the register pressure for the fused loop nest in liv18 is estimated to be much less than the register pressure of the fused loop nest in advect3d. On closer inspection of the code, we discovered that the native compiler unrolls the fused loop nest in liv18 by several factors which creates a much larger inner loop body than that of advect3d. Our cost model does not account for register pressure when the loop is unrolled. Hence, model-based is unable to prevent the increase in the number of loads in this case. Although this does not result in overall performance loss for liv18, the effect of unrolling on fused loop nests needs to be considered for improved profitability. Performance of native on this platform is at par with model-based for both advect3d and mgrid. However, the fusion strategy of native results in performance loss for erle, whereas model-based achieves a 15% speedup on this application.
Alpha Figs. 6.15 and 6.16 show performance results on the Alpha. Although model-based outperforms native on all programs, it performs worse than baseline on erle. This loss in performance comes because of the large number of TLB misses incurred when fusing two of the loops in erle. Since our model does not have an explicit constraint designed to account for TLB pressure, model-based is unable to prevent this unwise fusion choice. Although most locality enhancement strategies are easily extended to the TLB, there are situations when we need to consider the effects on TLB separately. The two loop nests in erle is one such case. In the future, we plan to incorporate a constraint in our model to prevent TLB conflicts.
88
1.93 1.64
1.4
2.00 3.00
1.4
1.69
3.00 4.20
3.00
1.2
1.0
Normalized Count
Normalized Count
1.2
0.8 0.6 0.4 0.2
1.0 0.8 0.6 0.4 0.2
0.0
0.0 Cycles
Mem Ops
L2 Misses
TLB Misses
I1 Misses
Cycles
Mem Ops
Performance Metric
base
model-based
simple
native
base
model-based
(a) advect3d
1.4
TLB Misses
I1 Misses
simple
native
(b) erle
1.81
14.33
1.45
1.4
2.00
3.00
1.2
Normalized Count
1.2
Normalized Count
L2 Misses Performance Metric
1.0 0.8 0.6 0.4
1.0 0.8 0.6 0.4 0.2
0.2
0.0
0.0 Cycles
Mem Ops
L2 Misses
TLB Misses
I1 Misses
Cycles
Mem Ops
base
model-based
(c) liv18
simple
L2 Misses
TLB Misses
Performance Metric
Performance Metric
native
base
model-based
(d) mgrid
Figure 6.15 : Memory performance on Alpha.
simple
native
I1 Misses
Speedup over baseline
89
1.45 1.30 1.15 1.00 0.85 0.64
0.70 advect3d
erle
model-based
0.61
liv18
simple
mgrid
native
Figure 6.16 : Performance improvement on Alpha.
On this platform, native performs much worse than baseline. However, all of this loss in performance is not attributed to poor fusion choices of the native compiler. The Compaq compiler does not provide specific control over the application of loop fusion. Thus, to avoid conflicts with the fusion strategy of the native compiler we compile the baseline version at a lower optimization level. The lower level of optimization turns off loop fusion along with some other loop transformations. Hence, the poor performance from native is a result of unwise fusion choices as well as negative effects of loop fusion’s interaction with other optimizations. Without fine-grain control over the application of transformations, it is difficult to determine exactly what transformations contribute to the performance loss. However, inspection of the optimized code suggests that there is negative interaction between loop fusion and tiling which causes a large number of TLB misses on this platform. Thus, as was the case on the MIPS, fusion profitability is majorly influenced by the choices made in tiling the fused loops.
90
1.56
1.4
1.40
1.4 1.2
Normalized Count
Normalized Count
1.2 1.0 0.8 0.6 0.4
1.0 0.8 0.6 0.4 0.2
0.2
0.0
0.0 Cycles
Loads
L1 Misses L2 Misses
TLB Misses
I1 Misses
Cycles
I2 Misses
Loads
L1 Misses L2 Misses
Performance Metric
base
model-based 1.00 simple
base
native 1.40
(a) advect3d
I1 Misses
I2 Misses
model-based 0.89 simple
native 0.82
(b) erle
1.4
1.4
1.2
1.2
Normalized Count
Normalized Count
TLB Misses
Performance Metric
1.0 0.8 0.6 0.4 0.2
1.0 0.8 0.6 0.4 0.2
0.0
0.0 Cycles
Loads
L1 Misses L2 Misses
TLB Misses
I1 Misses
I2 Misses
Cycles
Loads
L1 Misses L2 Misses
Performance Metric
base
model-based 0.92 simple
(c) liv18
TLB Misses
I1 Misses
I2 Misses
Performance Metric
native 1.05
base
model-based 0.93 simple
native 0.91
(d) mgrid
Figure 6.17 : Memory performance on PowerPC.
PowerPC Figs. 6.17 and 6.18 show performance results on the PowerPC. We observe significant performance improvement for both advect3d and liv18. For advect3d, native decides to fuse only two loop nests all the way through, leaving the other six loop nests untouched. On the other hand, model-based performs a more aggressive fusion and is able to exploit more register reuse. Although there is some loss in locality in the L1 and L2 caches, this loss is offset by the gains obtained from the large reduction
Speedup over baseline
91
1.45 1.30 1.15 1.00 0.85 0.70 advect3d
erle
model-based
liv18
simple
mgrid
native
Figure 6.18 : Performance improvement on PowerPC.
in the number of loads. For liv18, we observe improvement in terms of both register reuse and improved cache locality.
Opteron Performance results for the Opteron are presented in Figs. 6.19 and 6.20. Our tuning strategy is the least effective on this platform. One of the reasons why model-based is not as effective is because of the limited number of registers on the target machine. The Opteron has only 8 x87 floating-point registers, which imposes a severe restriction on the size of the fused loop body. Because of this constraint, model-based is able to fuse only outer-level loops in advect3d and liv18, sacrificing potential benefits in cache. Indeed, our empirical search reveals that fusing any more loops in either of these two programs results in performance loss. This is further verified in the poor performance shown by simple on these two applications. Another factor that explains the lower performance on the Opteron is the choice of the back-end compiler. We were unable to obtain a commercial compiler for this
92
1.54
1.44
7.72
1.53 1.51
1.4
1.2
1.2
1.0
1.0
Normalized Count
Normalized Count
1.4
0.8 0.6 0.4 0.2
0.8 0.6 0.4 0.2
0.0
0.0 Cycles
Loads
L1 Misses
L2 Misses
TLB Misses
I1 Misses
Cycles
Loads
L1 Misses
Performance Metric
base
model-based
simple
native
base
(a) advect3d 3.56
TLB Misses
I1 Misses
model-based
simple
native
(b) erle 2.11
2.00
1.4
1.2
1.2
1.0
1.0
Normalized Count
Normalized Count
1.4
L2 Misses
Performance Metric
0.8 0.6 0.4
0.8 0.6 0.4 0.2
0.2
0.0
0.0 Cycles
Loads
L1 Misses
L2 Misses
TLB Misses
I1 Misses
Cycles
Loads
base
model-based
(c) liv18
simple
L1 Misses
L2 Misses
TLB Misses
Performance Metric
Performance Metric
native
base
model-based
(d) mgrid
Figure 6.19 : Memory performance on Opteron.
simple
native
I1 Misses
Speedup over baseline
93
1.45 1.30 1.15 1.00 0.85 0.70
0.69
advect3d
erle
model-based
liv18
simple
mgrid
native
Figure 6.20 : Performance improvement on Opteron.
platform at the time of running these experiments. Hence, we use the GNU Fortran compiler as the back-end compiler on this machine. It is possible that the register allocation strategy of the GNU Fortran compiler is unable to exploit some of the register reuse enabled through loop fusion. Note, since the GNU Fortran compiler does not have a loop fusion strategy, we compile both baseline and native with the same compiler options. Because of this, there is no performance difference between baseline and native on this platform.
Pentium 4 Performance results for Pentium 4 are presented in Figs. 6.21 and 6.22. Like the Opteron, Pentium 4 shows very little performance improvement from loop fusion. This result is not surprising, since, like the Opteron, Pentium 4 has just eight floatingpoint registers. For all four programs, limited number of floating-point registers impedes fusing loops at the innermost level. Hence, neither model-based nor native is able to exploit any reuse at the innermost level on this platform. However, heuristics
1.4
1.4
1.2
1.2
1.0
1.0
Normalized Count
Normalized Count
94
0.8 0.6 0.4
0.8 0.6 0.4 0.2
0.2
0.0
0.0 Cycles
Loads
L1 Misses
L2 Misses
Cycles
TLB Misses
Loads
base
model-based
simple
base
native
model-based
(a) advect3d
L2 Misses
TLB Misses
simple
native
(b) erle
1.4
1.4
1.2
1.2
1.0
1.0
Normalized Count
Normalized Count
L1 Misses Performance Metric
Performance Metric
0.8 0.6 0.4 0.2
0.8 0.6 0.4 0.2
0.0
0.0 Cycles
Loads
L1 Misses
L2 Misses
TLB Misses
Cycles
Loads
Performance Metric
base
model-based
(c) liv18
simple
L1 Misses
L2 Misses
Performance Metric
native
base
model-based
(d) mgrid
Figure 6.21 : Memory performance on Pentium 4.
simple
native
TLB Misses
Speedup over baseline
95
1.45 1.30 1.15 1.00 0.85 0.70 advect3d
erle
model-based
liv18
simple
mgrid
native
Figure 6.22 : Performance improvement on Pentium 4.
used for fusing outer loops to exploit cache locality proves successful for liv18, resulting in a 16% speedup over the baseline version. The little performance improvement we get for erle and mgrid is also due to exploited locality at the outer levels.
Pentium III Figs. 6.23 and 6.24 show the performance results on Pentium III. Although Pentium III, like the Opteron and Pentium 4, has only 8 floating-point registers, model-based is still able to achieve significant performance improvement on this platform. One factor that contributed to this speedup is the improved locality in the L2 cache . The limited number of registers prevents model-based from fusing loops at the innermost levels. However, the outer-loop fusion applied by model-based is effective in exploiting locality at the level two cache. We do not observe similar improvements for the Opteron or Pentium 4 because they both have much larger L2 caches with higher degrees of associativity and thus exhibit good locality even for the unfused program variants.
1.4
1.4
1.2
1.2
1.0
1.0 Normalized Count
Normalized Count
96
0.8 0.6
0.8 0.6
0.4
0.4
0.2
0.2
0.0
0.0 Cycles
Loads
L1 Misses
L2 Misses
I1 Misses
Cycles
Loads
Performance Metric
base
model-based
simple
native
base
(a) advect3d
L2 Misses
I1 Misses
model-based
simple
native
(b) erle
1.4
1.4
1.2
1.2
1.0
1.0 Normalized Count
Normalized Count
L1 Misses Performance Metric
0.8 0.6
0.8 0.6
0.4
0.4
0.2
0.2 0.0
0.0 Cycles
Loads
L1 Misses
L2 Misses
I1 Misses
Cycles
Loads
base
model-based
(c) liv18
simple
L1 Misses
L2 Misses
Performance Metric
Performance Metric
native
base
model-based
(d) mgrid
Figure 6.23 : Memory performance on Pentium III.
simple
native
I1 Misses
Speedup over baseline
97
1.45 1.30 1.15 1.00 0.85 0.70
advect3d
erle
model-based
liv18
simple
mgrid
native
Figure 6.24 : Performance improvement on Pentium III.
6.4.4
Summary
We summarize the results of our experiments in Fig. 6.25. These results show that a cache-conscious analytical model combined with empirical search can lead to profitable fusion on a range of architectures. With the exception of erle on Alpha, model-based achieves performance improvement for all four applications on all seven platforms. We also observe that on several instances, model-based is able to obtain good performance, while the fusion heuristics employed by native compilers lead to performance loss. In most cases, this loss in performance is a result of excessive register pressure and conflicts in cache on the target architecture. Hence, these results reiterate the need for careful tuning of parameters for architecture-sensitive transformations such as loop fusion The experimental results also expose several key aspects of fusion profitability. We observe that fusion is more profitable for machines that have larger register sets.
98
Speedup over baseline
1.20 1.15 1.10 1.05 1.00 0.95 0.73
0.90 Itanium
MIPS
Alpha
Opteron
PowerPC
Pentium 4 Pentium III
Mean
Platforms
model-based
simple
native
Figure 6.25 : Mean performance across platforms.
The average speedup obtained on the Itanium with its 128 registers is almost twice as much as that of the Opteron which has only eight registers. We also observe that fusing of outer loops helps improve locality in cache. Thus, in cases where limited number of registers prevents fusing of loops at the innermost level, it is still profitable to fuse loops at the outer levels. A more subtle aspect of fusion profitability revealed by the experimental results, is the interaction of loop fusion with other transformations. In particular, tiling can have a major impact on fusion profitability. In some situations, tiling is able to mitigate some of the performance loss caused by aggressive loop fusion. In other cases, tiling interacts negatively with fusion and causes further performance loss. We address this issue in the next chapter, where we describe a cost model that captures the complex interaction of tiling and loop fusion and exposes key architectural parameters for empirical tuning.
99
Chapter 7 Pruning the Fusion-Tiling Search Space In this chapter, we show how the model-guided tuning strategy presented in Chapter 6 can be extended to cover multiple memory hierarchy transformations. In particular, we show, how the notion of effective cache capacity can be used to linearize the multi-dimensional search space of fusion and tiling parameters. We present an integrated cost model that characterizes the interaction between loop fusion and tiling. We then construct a combined search space for these two transformations based on architecture-dependent parameters embedded within the cost model. We present an evaluation of our strategy on seven different architectures.
7.1
Introduction
Tiling, like loop fusion, is a well-known transformation for improving memory hierarchy performance [81, 9, 23, 10, 14, 11, 53]. It aims to exploit locality within a single loop nest by splitting the iteration space into smaller blocks, where each block fits into some level of cache. Tiling has been widely used in commercial compilers for optimizing dense matrix computations. Although very effective when applied prudently, tiling suffers from some of the same problems as loop fusion. The profitability of this transformation is highly-sensitive to parameters of the underlying architecture as limited by the compiler’s ability to generate effective code. In particular, estimating the capacity of the target cache is critical in improving program performance
100 through tiling. Also, as is the case with loop fusion, tiling can have different effects at different levels of the memory hierarchy. In many cases, improved performance at some level of cache comes at a cost of higher register spills or reduced performance at some other level of memory. Thus, in the absence of detailed architectural information, compilers are forced to resort to heuristics that favor one level of memory hierarchy over another. This of course implies a compromise in overall application performance. The problem of how best to use loop fusion and tiling becomes even more difficult when we try to apply the two transformations in concert. Fusion and tiling interact with each other in complex ways. Because of this, the effectiveness of one transformation is often strongly influenced by decisions made in applying the other transformation. As evidence of this interaction, we present in Figs. 7.1 and 7.2, results from running a set of benchmarks with both fusion and tiling. For each benchmark, we adjust the flags in the native compiler to generate four different variants: baseline applies no fusion or tiling, fuse applies only fusion, tile applies only tiling and fuse-tile applies both transformations. We evaluate the effect of these two transformations on both the L2 cache and the TLB on a MIPS machine. The experimental data in Figs. 7.1 and 7.2 suggest considerable interaction between fusion and tiling. Consider the case of advect3d. Applying fusion to this benchmark results in improved performance for both the L2 cache and the TLB. Tiling by itself has only minimal impact on memory performance. However, when both fusion and tiling are applied together the number of L2 misses increases by almost 20%. Thus, this is an instance where fusion and tiling interact negatively to hurt program performance. Similar negative interaction in the level two cache is observed for equake. On the other hand, consider the case of vpenta. Fusion and tiling individually have very little
Normalized L2 Misses
101 1.8 1.6 1.4 1.2 1.0 0.8 0.6 0.4 0.2 0.0 advect3d
vpenta
baseline
liv14
fuse
mgrid
tile
equake
apsi
fuse-tile
Figure 7.1 : Effects of fusion and tiling on L2 Cache Misses.
Normalized TLB Misses
4.0 3.5 3.0 2.5 2.0 1.5 1.0 0.5 0.0 advect3d
vpenta
baseline
liv14
fuse
mgrid
tile
equake
apsi
fuse-tile
Figure 7.2 : Effects of fusion and tiling on TLB Misses.
impact on the L2 miss rate. However, when applied together L2 misses are reduced by as much as 60%. We also see positive interaction between fusion and tiling for mgrid. In this case, fusion is able to mitigate some of the large number of TLB misses caused by tiling. These experimental results emphasize the need for considering the interaction between loop fusion and tiling at different levels of the memory hierarchy. Applying these transformations in isolation without considering their joint effects on multiple levels of memory can lead to less than desired performance.
102 Complex interactions between loop fusion and tiling and their sensitivity to memory hierarchy parameters makes it necessary to use empirical methods to achieve consistent improved performance from these two transformations. Automatically tuning fusion and tiling parameters, however, poses an even bigger problem. Because the two transformations are intricately related, we need to consider their combined search space for tuning. But the combined search space of these two transformations can be extremely large. The fusion search space consists of all combinations of fusible loops at a particular nesting depth. On the other hand, for tiling, we have a set of values for each tiled loop and the overall search space is the Cartesian product of all of those sets. Moreover, since loop fusion changes the loop structure in a program, we can have a different tiling search space for each fusion configuration. Clearly, exploring such a large space is infeasible for a general-purpose compiler. For automatic tuning to be practical, we need an efficient method of exploring this enormous search space. In this chapter, we present a strategy for pruning the combined search space of loop fusion and tiling parameters. Our approach is based on the key observation that a single architectural parameter can affect the profitability of multiple transformations. For example, the capacity of the target cache has an impact on both fusion and tiling profitability. However, as discussed earlier, it is difficult to come up with an accurate estimate of the effective cache capacity using static heuristics. For this, we need to turn to empirical techniques. Experimental results from Chapter 6 suggest that finding a good estimate for the effective cache capacity leads to more profitable fusion configurations. We use this same principal to find the best parameters for both loop fusion and tiling. The main benefit of this approach is that although we are looking at multiple transformations, there is no significant increase in the size of the search space. Of course, for this approach to work, we first need a model that captures the
103 interaction between the two transformations and exposes the effective cache capacity as a parameter for tuning through empirical search. In the sections that follow, we explain the interaction between loop fusion and tiling, present an integrated cost model for applying the two transformations together, define the combined search space for fusion and tiling and describe our search method and finally, present an evaluation of our strategy on seven different architectures.
7.2
Fusion-Tiling Interaction
Loop fusion and tiling interact with each other in complex ways. Fusing two loops increases the working set size of the resulting loop nest, which imposes a constraint on the tile size to be selected. On the other hand, tiling causes cache misses on references with inner loop reuse. Some of these misses may be avoided if the loops are not fused in the first place. In this section, we use an example code to explain some of the interactions between loop fusion and tiling. The code in Fig. 7.3(a) has two loop nests LA and LB . In LA , values of a() are used to compute values of b() and in LB , values of b() and d() are used to compute c(). We observe several types of reuse in this code. There is cross-loop reuse of b(i,j) from LA to LB , some inner-loop reuse of d(j) in LB and also some outer-loop reuse of a() at reference a(i,j-1) in LA . We now look at the trade-offs in applying fusion and tiling to this code in order. (i.e. fusion before tiling and vice versa). Fusion first: If we fuse LA and LB as shown in Fig. 7.3(b), references to the same locations in b() will be located within the same iteration of the innermost loop. This can potentially lead to saved loads of b(). However, in the fused loop nest we will access roughly twice as much data as compared to each of the unfused loop nests.
104
outer loop reuse of a()
L1: do j = 1, N do i = 1, M b(i,j) = a(i,j) + a(i,j-1) enddo enddo cross-loop reuse of b()
L2: do j = 1, N do i = 1, M c(i,j) = b(i,j) + d(j) enddo enddo
inner loop reuse of d()
(a) code before transformations lost reuse of a()
L12: do j = 1, N do i = 1, M b(i,j) = a(i,j) + a(i,j-1) c(i,j) = b(i,j) + d(j) enddo enddo saved loads of b()
(b) code after two-level fusion
reduced reuse of d()
do i = 1, M, T do j = 1, N do ii = i, i + T - 1 b(ii,j) = a(ii,j)+ a(ii,j-1) c(ii,j) = b(ii,j) + d(j) enddo enddo extra misses when b() is not aligned enddo at cache line boundary
(c) code after fusion and tiling
Figure 7.3 : Effects of fusion and tiling on reuse.
105 This implies that the reuse distance for the outer-loop-carried reuse in a(i,j-1) will increase in the fused nest, potentially leading to cache misses on every iteration of the outer loop. Moreover, since we access more arrays, we also increase the chances of conflict misses. A good heuristic for loop fusion is likely to consider these negative effects on cache use and refrain from fusing the two loops, sacrificing the saved loads of b(). Of course, some of the negative effects of loop fusion can be ameliorated by tiling the fused loop nest. Tiling the inner loop will reduce the reuse distance for a(i,j-1) and ensure that reused blocks of a() remain in cache during each iteration of the outer loop. The potential for conflict misses can also be reduced by picking tile sizes that make the working set significantly smaller than the cache size. Thus, if we do not consider tiling when making our fusion decision this code is likely to suffer some performance loss. Tiling first: A good tiling heuristic will be able to pick a tile size for LA to exploit the outer-loop reuse of a(). However, after fusion, the working set of the fused nest will increase and hence, the original tile size will no longer be effective. Thus, we would need to readjust the tile size to fit the new larger working set in cache. This however, does not solve the entire problem. We notice that tiling LB will reduce some of the inner-loop reuse of d(). The amount of lost reuse will increase for smaller tile sizes. Hence, we need to pick a tile size that is large enough to minimize the loss of inner-loop reuse and at the same time small enough to exploit the reuse in the outer loop. If we cannot find such a tile then we need to reconsider our decision to fuse the two loops. There is also a more subtle issue to consider in the example code. If the arrays are not aligned at cache line boundaries, then we would need to bring in one extra cache
106 line for every execution of the inner tile. This can lead to an extra miss for each array on each iteration of the outer loop. The smaller the tile size, the more misses we are likely to incur.
7.3
Cost Model
In this section, we present a cost model that captures the complex interactions between loop fusion and tiling. Based on this model, we present an algorithm that performs the task of applying the two transformations together. 7.3.1
Modeling Fusion-Tiling Interaction
We first look at the effects of fusion and tiling on reuse separately. We then present the analysis that determines the combined effect of these two transformations. For simplicity, we limit the discussion to a two-level loop nest. We use the following notation: l1 , l2
loop nests considered for fusion
j, i
outer and inner loop in each loop nest, respectively
ii
tiled loop
N, M
loop bounds of outer and inner loops, respectively
F P(i,l1 )
footprint of one iteration of loop i in loop nest l1
T
tile size
B
line size of target cache
In building a combined cost model for loop fusion and tiling we need to consider both intra- and inter-loop reuse. We discussed methods for quantifying inter-loop reuse in Chapter 6. For the combined cost model, we merge our inter-loop reuse information with intra-loop reuse information. In the single loop nest model reuse
107 is classified as being self-temporal, self-spatial, group-temporal or group-spatial. In addition, a reuse can also be classified by the level of the loop that carries the reuse (inner and outer for a two-level loop). In our cost model, we do not explicitly handle spatial reuse∗ . Thus, combining our inter-loop reuse model with the single loop nest model gives rise to nine different classes of reuse as shown below: R1 :
{loop-crossing}
R2 :
{self, inner}
R3 :
{group, inner}
R4 :
{self, outer}
R5 :
{group, outer}
R6 :
{loop-crossing, self, inner}
R7 :
{loop-crossing, self, outer}
R8 :
{loop-crossing, group, inner}
R9 :
{loop-crossing, group, outer}
We augment our dependence graph by labeling each sink as having one of the above types of reuse. As we will see in the discussion that follows, fusion and tiling can have different effects on each of these nine types of reuse.
Fusion Effects Loop-crossing reuse is our prime target for improving locality with loop fusion. Prior to fusion, the source and the sink of any loop-crossing reuse is executed in the first and second loop nest respectively. If we apply a two-level fusion then both the source and the sink will be executed in the same iteration of the innermost loop of the fused loop ∗
Spatial locality is exploited by selecting tile sizes that are multiples of the cache line size on the
target platform
108 nest. Prior to fusion, reuse distance for such a reference is N ∗ F P(j,l1 ) . After fusion, this reuse distance becomes F P(i,l1 ) . Hence, the reuse distance for any loop-crossing reuse will decrease as a result of fusion. If the sink of a loop-crossing reuse is also involved in an outer loop-carried reuse then the reuse distance for that reference will decrease from F P(j,l2 ) to F P(i,l1 ) . The effect of fusion on references that are involved in loop-crossing reuse and also an inner loop carried reuse depends on the relative size of the footprint of the inner loops of the two loop nests. If F P(i,l2 ) < F P(i,l1 ) then there is no change in the reuse distance otherwise the reuse distance is reduced to F P(i,l1 ) . This leads us to our first observation: Observation 1 Fusion decreases the reuse distance of any loop-crossing dependence [R1] and any loop-crossing dependence that is also involved in a carried dependence [R6, R7, R8, R9]. Loop fusion has a negative impact on any carried reuse that is not involved in a loop-crossing reuse. After fusion the footprint of the inner loop in the fused nest increases to F P(i,l1 ) + F P(i,l2 ) . Consequently, the footprint for the outer loop increases to F P(j,l1 ) + F P(j,l2 ) . Hence, we have: Observation 2 Reuse distance of any outer or inner loop carried dependence that is not involved in a loop-crossing dependence [R2, R3, R4, R5] increases as a consequence of fusion.
Tiling Effects When we tile the inner loop with respect to the outer loop, reuse distance of any outer-loop-carried dependence is reduced from F P(j,l1 ) to T ∗ F P {ii, l1 }. Since the
109 source and the sink of the loop-crossing reuse reside in two separate loop nests tiling will not impact their reuse distance. This leads to the following observation: Observation 3 Tiling decreases the reuse distance for any reuse carried by the outer loop [R4, R5, R7, R9]. Tiling has no impact on references that are only involved in a loop-crossing reuse [R1]. By splitting the iterations, tiling can adversely affect the locality in the inner loop. In an untiled loop nest, the most recent use of an inner-loop dependence with a threshold of d always occurs d iterations before the current iteration of the inner loop. On the other hand, in a tiled loop nest, every time we begin working on a new tile, the sink of the reuse is separated from its source by N × T iterations of the inner loop. Thus, we can state the following about the effects of tiling on inner loop reuse: Observation 4 Tiling increases the reuse distance for some instances of innerloop-carried reuse [R2, R3, R6, R8]. The number of instances for which the reuse distance is increased is M/T .
Combined Fusion and Tiling Effects From Observations 2 and 3 we know that fusion and tiling affect the reuse distance of outer-loop-carried reuse in opposing directions. However, the increased reuse distance due to fusion can generally be compensated by choosing a smaller tile size. This will ensure that the reuse distance for any outer-loop-carried reuse is small enough for the reused value to still be in cache. The only place where this approach will not work is if we are forced to pick a tile size that is smaller than one cache line. The above observation leads us to the following observation:
110 Observation 5 If Capacity(L) > T > B then applying both fusion and tiling will result in saved memory operations for any reuse carried by the outer loop. It follows directly from Observations 1 and 3 that fusion and tiling applied together, is beneficial for references involved only in loop-crossing reuse or a loop-crossing reuse and an outer-loop reuse. When a loop-crossing dependence is involved in an inner-loop-carried dependence, we get the full benefits from the loop-crossing reuse due to fusion. Moreover, the negative effects of tiling on the reuse distance are no longer observed. After fusion, the sink of any loop-crossing reference always gets the value from its most recent use, which is in the same iteration of the innermost loop. Therefore, we can state the following about loop-crossing dependences: Observation 6 Applying fusion and tiling together results in a net gain in memory operation cost for any reference that is involved in a loop-crossing dependence. Both fusion and tiling have a negative impact on references that are involved only in inner-loop-carried dependences. Thus, when applying tiling and fusion together we will suffer additional misses on such references. Observation 7 Applying fusion and tiling together will increase the reuse distance for some instances of the sink of any inner loop reuse which is not involved in loopcrossing reuse. The number of additional misses incurred is inversely related to the tile size. Based on the observations outlined in this section, we can characterize the interaction between fusion and tiling as follows: generally, fusion and tiling will interact favorably to reduce the number of cache misses for both loop-crossing and outer-loopcarried reuse. However, by increasing the footprint of the inner loop, fusion imposes
111 a constraint on the tile size to be selected. Meeting this constraint may imply loss of locality in the inner loops. In cases where this loss exceeds the gains from fusion, it will be more profitable to tile the loops separately.
7.3.2
Combined Fuse-Tile Algorithm
Once we have developed a combined cost model for loop fusion and tiling, we need to design an algorithm that will allow us to apply these two transformations simultaneously. To perform this task, we revisit the weighted pair-wise fusion algorithm described in Chapter 6. The main consideration for using our cost model in a weighted fusion algorithm is incorporating tiling decisions within the algorithm. To do this we, need to have additional information associated with each edge and each loop node. In the combined fuse-tile algorithm we tag each edge with a parameter T that represents the tile size of the resulting fused loop nest. This tag is updated each time we update the edge weights in the graph. T ≤ 1 implies no tiling for the fused loop nest whereas a negative weight implies that the two loops should be left unfused. In such cases, the parameter T is a pair that represents the individual tiling sizes of the two loops. Tiling of all such loops is performed in a separate pass at the end of the greedy phase. A high-level sketch of our fuse-tile algorithm is depicted in Fig. 7.4. In the initial phase, we iterate over the loop nests of the program and compute both intra and inter-loop reuse information. Next, we use the reuse information to compute weights between each pair of fusible loops. The weights in this case represent the total gain from fusion and tiling of the two loops. Also, as mentioned above we associate a tag with each edge that determines whether the fused loop nest should be tiled. Once we have built the weighted graph, the algorithm proceeds as it would for a greedy fusion
112
procedure FuseTile(src) /* /* /* /*
src is source program */ L is number of loop nests in src */ deepest is deepest nesting depth */ edges contains fuse-tile profitability info */
/* derive inter and intra-loop reuse information */ for i = 1 to L do BuildReuseInf o(lni ) end for for i = 2 to L do AddInterLoopReuseInf o(lni , ln(i−1) ) end for /* compute weighted edges and fuse loops starting from the outer most level */ for m = 1 to deepest do for i = 1 to num edges at level m do edges(i).w = CostAnalysis(li , li+1 ) edges(i).t = CostAnalysis(li , li+1 ) end for repeat edgeij = P ickHeaviestEdge(edges) if (edgeij .w > 1) then F use(li, lj ) end if if (edgeij .t > 1) then Mark(lij , t) end if UpdateEdges() until V isitedAll(edges) end for /* tile all loops in a separate pass */ for i = 1 to L do T ileLoops(li ) end for Figure 7.4 : Algorithm for applying loop fusion and tiling.
113
t0 t1
tN
f0
T0
f1
Compute ECC for Ti Apply Constraints Tk Search space of tolerance values for effective cache capacity
M apping of tolerance values to transformations parameters
fL Tr = tolerance value fi = fusion configuration t0 - tN = range of tile size values for each loop ECC = effective cache capacity
Search space of transformation parameters for loop fusion and tiling
Figure 7.5 : Mapping of tolerance values to transformation parameters.
algorithm. The only difference is that when selecting two loops for fusion we need to mark loops for tiling if the tag field has a value greater than one.
7.4
Empirical Search
We apply the same principal in exploring the fusion-tiling search space as we did for exploring the search space of different fusion configurations. Our search strategy does not search parameters for individual transformations directly. Instead our approach is to identify key architectural resources that can affect the profitability of a set of transformations. For each such resource, we define a tolerance and construct a
114 function that computes the effective size of that resource, for a given tolerance value. We then apply a search on the set of tolerance values, which leads us to the best set of transformation parameters. The mapping of tolerance values to transformation parameters is depicted in Fig. 7.5. Among the set of memory hierarchy parameters we examine, only the effective cache capacity has a direct impact on both loop fusion and tiling. Hence, the discussion in this section focuses mainly on the search space of the effective cache capacity. In this section, we describe the fusion-tiling search space and show how it relates to the search space of effective cache capacity. We compare the size and characteristics of these two types of search spaces and then lay out our search strategy. Zhao et al. conducted a study to explore the search space of different fusion configurations [88]. In their study, they examined the search space of fusion parameters for cases when reordering of loops is allowed and also when a loop is allowed to be embedded within another loop (i.e. fusion of loops at different levels). However, their study also showed that situations where reordering or embedding of loops is beneficial is relatively rare. Hence, in our framework, we only consider fusing loops at the same level without any reordering. If reordering of loops is not allowed, the number of different ways to fuse L loops is 2L−1 . Thus, the fusion search space can be thought of as a single dimensional search space with 2L−1 points. On the other hand, the set of feasible tile sizes constitutes the search space of a single tiled loop. A feasible tile size is an integer t, where 2 ≤ t < ub, and ub is the upper bound of the loop in question. Therefore, the tiling search space of l loops is the Cartesian product of L sets of feasible tile sizes. If we assume, for simplicity, the number of feasible tile sizes for each loop is N, then the tiling search space is an L dimensional search space with N L points.
115 Characterizing the search space for fusion and tiling separately is not too difficult a task. However, it becomes more problematic when we want to consider the two search spaces together. Since loop fusion changes the loop structure in a program, we can have a different tiling search space for each fusion configuration. For example, if we have L loops and all of them are fused into one loop, then we have just one loop we can tile. On the other hand, if none of the loops are fused then potentially we can tile each of the L loops. Thus, the number of dimensions in the tile size search space depends on the fusion configuration. The size of the search space for effective cache capacity depends on the range of tolerance values and the increment used in the search process. If R is the range of tolerance values and t is the value by which we increment our tolerance during the search process then the size of the search space is R/t. For effective cache capacity we use the probability of a conflict miss as tolerance. Hence, the range for the tolerance value is between 0% − 100%, and if we use the minimum increment of 1% then we get the maximum size of the search space, which is 100 points. And this is true for all applications since this search does not depend on the number of loops in the program. Clearly, this is a much smaller search space then the search space of transformation parameters. Even if we have just a few loops in the program, the search space of transformation parameters is likely to be much larger than the effective cache capacity search space.
7.5
Comparison with Other Model-guided Tuning Strategies
As mentioned earlier, several researchers have recently advocated the model-guided approach for automatic tuning. In this section, we compare our model-guided approach with that of Yotov et al. [86]. For readability, in the rest of this section, we
116 refer to the model-guided approach adopted by Yotov et al. as the Yotov approach. The Yotov approach uses carefully constructed models to find near-optimal parameters for a set of memory hierarchy optimizations. They then employ a local search to find the most suitable parameters around the points chosen by their models. Their approach is very much focused in tuning the level 3 BLAS. The set of parameters they search for are precisely the ones used by ATLAS. The transformations used in the Yotov approach include: tiling, unroll-and-jam (referred to as register tiling), loop unrolling, scheduling and data copy. Their search space consists of eight parameters, two of which are boolean, while the rest are integer parameters. The Yotov approach considers a larger set of transformations than we do in our framework. As such, the Yotov approach is more inclusive. However, some of their transformations are customized for optimizing matrix operations in the BLAS. In particular, their scheduling and data copy algorithms are specifically designed for the matrix multiply operation. Our framework considers more general application of the transformations. One of the main strengths of our model-based approach is the ability to explore the combined search space of multiple transformations in a non-orthogonal manner. Although the Yotov approach considers some interaction between transformations (i.e., tiling and unroll-and-jam), the search strategy they use is orthogonal. For this reason, their approach is less likely to find points that are discovered through a nonorthogonal exploration of the search space. The search space explored by the Yotov approach consists mostly of transformation parameters. They have one architectural parameter in their search space called MulAdd, which checks the existence of a multiply-add instruction in the target architecture. Although searching for the MulAdd parameter is useful in optimizing the
117 scheduling of the matrix multiply operations, it does not help in narrowing down the overall search space. The architectural parameters used in our framework allows us to reduce the size of the search space and make the search space non-orthogonal at the same time. Finally, in terms of performance, the Yotov approach produces very impressive results. They show that their approach can achieve performance comparable to ATLAS on a series of platforms. We cannot provide a direct comparison with the Yotov approach because our approach is based on multi-loop transformations, whereas their approach deals with transformations that only involve a single loop nest. We speculate that the Yotov approach is going to achieve better performance on matrix-multiply like kernels because it is more specialized. However, on general scientific applications, the performance of these two approaches is likely to be more competitive, with our approach requiring less tuning time.
7.6
Evaluation
We implemented our cost model and search algorithm in our autotuning framework described in Chapter 4. In this section, we present an evaluation of our strategy using experimental results on different platforms. We divide the discussion into two parts. First, we evaluate the effectiveness of our empirical tuning strategy by comparing performance results with native compilers on seven different platforms. Next, we focus on the search itself and compare our strategy with multi-dimensional direct search - a search strategy known to be effective in finding good values for transformation parameters [64, 87].
118 7.6.1
Experimental Setup
We select four programs from the set of programs listed in Table 4.1: advect3d, erle, liv18 and mgrid. All four programs present opportunities for both loop fusion and tiling and thus serve as a good test suite for evaluating our strategy. We apply our cost model to each program and use LoopTool to restructure the code with the desired optimization parameters. The transformed source is then compiled using the native compiler on the target platform. To avoid conflicts with the optimization strategies of the native compiler, transformed programs are compiled with fusion and tiling turned off whenever possible. In the the discussion that follows we use the following terms to refer to the different optimization strategies:
7.6.2
baseline
no fusion or tiling
native
fully optimized version of the native compiler
model-based
tuning strategy described in this chapter
direct
cost model + direct search on tile sizes
Tuning Strategy Performance
MIPS Performance results on the MIPS for the four applications are presented in Figs. 7.6 and 7.7. These results show that model-based is able to outperform both baseline and native on each application. The most significant improvement is observed for liv18. This is not surprising since all the work in liv18 is done in three fusible loop nests. Our fusion strategy in this case decides to fuse all three loops all the way through. The MIPSPro compiler, by contrast, refrains from fusing the third loop nest. This may be due to alignment issues or because of some heuristic used in the compiler to account for register pressure. We note, that although our model-based strategy
1.4
1.4
1.2
1.2
Normalized Count
Normalized Count
119
1.0 0.8 0.6 0.4 0.2 0.0
1.63
1.0 0.8 0.6 0.4 0.2 0.0
Cycles
L1 Miss
L2 Miss
Loads
TLB Miss
Cycles
base
native
L1 Miss
L2 Miss
Loads
TLB Miss
Performance Metric
Performance Metric model-based
base
(a) advect3d
native
model-based
(b) erle
1.4
1.4
1.2
1.2
Normalized Count
Normalized Count
9.87
1.0 0.8 0.6 0.4 0.2
5.68 3.85
1.0 0.8 0.6 0.4 0.2 0.0
0.0 Cycles
L1 Miss
L2 Miss
Loads
TLB Miss
Cycles
Performance Metric base
native
model-based
(c) liv18
L1 Miss
L2 Miss
Loads
TLB Miss
Performance Metric base
native
model-based
(d) mgrid
Figure 7.6 : Memory performance on MIPS.
incurs some extra loads because of the aggressive fusion, we are able to compensate for the loss with a reduction in L2 and TLB misses. For advect3d and erle the optimization strategies of the MIPSPro compiler results in overall performance loss. The tile sizes chosen by the native compiler for erle caused conflicts in both the level two cache and the TLB. For TLB this conflict is quite severe causing almost 10 times as many TLB misses over the baseline version. The model-based strategy is able to pick tile sizes good enough to improve L2 performance without causing conflicts in the TLB. For advect3d the native compiler
Speedup over baseline
120 1.5 1.4 1.3 1.2 1.1 1.0 0.9 0.8 0.7
advect3d
erle
native
liv18
mgrid
model-based
Figure 7.7 : Performance improvement summary on MIPS.
does an overly aggressive fusion which creates a large inner loop body. This results in a high number of register spills and conflict misses as indicated by the measurements in Fig. 7.6(a). Our fusion strategy refrains from fusing all the loops because of the register pressure constraint. For mgrid our strategy shows only marginal improvement over the native compiler. Looking at the different memory system performance metrics in Fig. 7.6(d), we note that in this case the model-based strategy improves locality in the two caches but pays a severe penalty in the TLB. For mgrid the tile sizes chosen by our model are very small. For all the outer loops the tile sizes chosen by model-based is the minimum allowed within the search space. To find out why our model exhibited such poor performance for TLB, we manually changed the lower bound for the outer tile size and ran the code with smaller tile size values. This resulted in severe misses in the level one and level two caches (most likely due lost spatial locality and high loop overhead). Thus, choosing tile sizes any smaller and reducing the working set further is unable to avoid the conflicts in the TLB for mgrid. This result suggests that tiling
121
1.2
Normalized Count
Normalized Count
1.2 1.0 0.8 0.6 0.4 0.2
1.0 0.8 0.6 0.4 0.2 0.0
0.0 Cycles
L2 Miss
L3 Miss
Loads
Cycles
TLB Miss
Performance Metric baseline
native
L3 Miss
Loads
TLB Miss
Performance Metric
model-based
baseline
(a) advect3d
native
mode-based
(b) erle
1.2
Normalized Count
1.2
Normalized Count
L2 Miss
1.0 0.8 0.6 0.4 0.2
1.0 0.8 0.6 0.4 0.2 0.0
0.0 Cycles
L2 Miss
L3 Miss
Loads
Performance Metric baseline
native
(c) liv18
model-based
TLB Miss
Cycles
L2 Miss
L3 Miss
Loads
TLB Miss
Performance Metric baseline
native
model-based
(d) mgrid
Figure 7.8 : Memory performance on Itanium.
alone is not enough to exploit locality in this case. To fully exploit locality in mgrid, we need to explore data layout optimizations. We address this issue in Chapter 8.
Itanium Performance results on the Itanium are presented in Figs. 7.8 and 7.9. The most significant performance improvement on the Itanium is observed for erle. In this case, model-based is able to reduce the number of misses for both levels of the cache and also the TLB. The number of level two cache misses is reduced by almost 60%
122
Speedup over baseline
1.3 1.2 1.1 1.0 0.9 advect3d
erle
native
liv18
mgrid
model-based
Figure 7.9 : Performance improvement summary on Itanium.
as we observe in Fig. 7.6(b). This reduction was a direct result of the improved tile sizes selected by our framework. For advect3d the performance improvement from our strategy is not as great as it was for the MIPS. In this case, the Intel compiler, like the MIPSPro, decides to fuse the loops all the way through. However, since the Itanium has a much larger register set, it is able to withstand some of the register pressure of the large inner loop body. For liv18 the Intel compiler did not perform any fusion or tiling. The model-based strategy in this case is able to improve locality at both the level three cache and the TLB. For mgrid, both model-based and native perform about the same. model-based does not suffer from TLB thrashing as it did on the MIPS. However, our strategy is not able to exploit much locality at either of the cache levels. Most of the improvement we observe for mgrid is because of the reduced number of loads due to fusion.
Speedup over baseline
123
1.4
1.2
1.0
0.8
0.6
advect3d
erle
native
liv18
mgrid
model-based
Figure 7.10 : Performance improvement summary on Alpha.
Alpha Fig. 7.10 shows performance results on the Alpha. Although model-based outperforms native on all programs, it performs worse than baseline on erle. This result is somewhat puzzling, since there is no significant drop in any of the memory hierarchy performance metrics. On closer inspection of the code, we discovered that the loss in performance is caused by the excessive stalls in the processor pipeline. The Compaq compiler on the Alpha applies software prefetching and pipelining at the -O4 optimization level (the level at which both baseline and model-driven version were compiled). We speculate that fusing two the loops in question, inhibits the effectiveness of these two transformations resulting in higher number of processor cycle stalls. Thus, this negative result highlights the complex interaction of loop fusion with two other program transformations.
Speedup over baseline
124
1.4
1.2
1.0
0.8
0.6
advect3d
erle
native
liv18
mgrid
model-based
Figure 7.11 : Performance improvement summary on PowerPC.
PowerPC Performance results on the PowerPC are presented in Fig. 7.11. We observe the most significant performance improvement on this platform. For advect3d we are able to fuse all loops without a corresponding increase in register spills. This behavior can be attributed to the larger register set on the PowerPC. We also observe significant performance improvement for erle and liv18. For these two programs our cost model chooses to tile for the 32KB L1 cache and is able to find tile sizes that make the working sets small enough to fit in the cache. The PowerPC has a relatively large cache line size for the L1 cache (16 words). In each case, our cost model chooses large enough tile sizes that fully exploit the spatial locality on these larger cache lines.
Opteron Performance results on the Opteron are presented in Fig. 7.12. Our tuning strategy is the least effective on this platform. Although we see about a 20% speedup for
Speedup over baseline
125
1.4
1.2
1.0
0.8
0.6
advect3d
erle
native
liv18
mgrid
model-based
Figure 7.12 : Performance improvement summary on Opteron.
both erle and liv18, there is no improvement for advect3d and a slight loss in performance for mgrid. The reason for this performance loss is the increased L1 misses incurred when tiling the loops. The TLB structure of the Opteron is unique among the seven platforms in that it has a large number of entries with relatively smaller pages. Because of this, mgrid suffers very few TLB misses even without tiling. Thus, when tiling for the outer loop we pay the penalty of increased L1 misses without a corresponding benefit in TLB performance. Thus, in this case the native compiler does a good job in tiling the code for the TLB.
Pentium 4 Fig. 7.13 shows performance results on Pentium 4. model-based achieves significant performance improvement for both advect3d and erle. In our earlier experiments with loop fusion, neither program showed much performance improvement on this platform. However, by applying tiling to the fused loops we are able to ameliorate some of the ill-effects of aggressive fusion. This results in overall improved perfor-
126
Speedup over baseline
1.50
1.25
1.00
0.75
advect3d
erle
native
liv18
mgrid
model-based
Figure 7.13 : Performance improvement summary on Pentium 4.
mance for both advect3d and erle. For liv18 and mgrid tiling does not provide any additional benefit over fusion. However, even for these two programs, model-based outperforms the native Intel compiler on this platform.
Pentium III Fig. 7.14 shows performance results on Pentium III . The main architectural feature we are able to exploit on this machine is the large size of the TLB pages. Having large TLB pages allows us to fuse more loops without causing too many conflicts in the TLB. Moreover, we also have the freedom to explore larger tile sizes for the outer loops, which allows us to exploit more instances of the outer loop reuse. With liv18, for example, the outer tile size we choose for this platform is 32. This tile size is small enough to avoid TLB conflicts, yet large enough to exploit a good amount of outer loop reuse.
Speedup over baseline
127
1.4
1.2
1.0
0.8
0.6
advect3d
erle
native
liv18
mgrid
model-based
Mean speedup over baseline
Figure 7.14 : Performance improvement summary on Pentium III.
1.30 1.25 1.20 1.15 1.10 1.05 1.00
MIPS
Itanium
Alpha
PowerPC
Opteron Pentium 4 Pentium III
Platform
Figure 7.15 : Mean performance across platforms.
128 Summary The mean performance results for all platforms is presented in Fig. 7.15. With the exception of erle on Alpha and mgrid on Opteron, model-based achieves significant performance improvement for all seven platforms. In several instances, model-based is able to achieve good performance, while the optimization strategies of the native compiler results in performance loss. We should note, however, that the effectiveness of our tuning strategy varies from one platform to another. The effectiveness of our strategy depends, to a get degree on how well we are able to model the underlying architecture. The performance is also influenced by the interaction of our strategy with the optimization strategies of the native compiler. Sometimes the optimizations used by the native compiler may make fusion or tiling less effective or in other instances it can actually have an overall negative impact on performance.
7.6.3
Comparison with Direct Search
Being able to linearize a multi-dimensional search space is the key to the success of our tuning strategy. In this section, we first compare the search spaces generated by our model-based approach with those generated by a more conventional search method. We then compare the performance vs. cost ratio of model-based with that of direct. We conclude the section with a discussion on the best transformation parameters generated by the two strategies.
Comparing Search Spaces For this discussion, we focus on the parameter search space of advect3d. As mentioned earlier, the parameter search space of fusion and tiling is orthogonal. Thus, we are not able to search through (or visualize) the combined search space of these
129
direct search
Figure 7.16 : Fusion configuration search space for advect3d on Opteron.
two transformations. The fusion parameter search space of advect3d is shown in Fig. 7.16. advect3d has eight loop nests. Fig. 7.16 shows the performance of the application for all different fusion combinations. For simplicity, we only consider fusing of loops at the innermost levels. As expected the performance curve for the fusion parameter search space is jagged with no discernible pattern. Fig. 7.17 shows the tile size search space corresponding to fusion configuration number four. We choose this particular configuration because this is the best configuration discovered by direct. The tile size search space shows the performance of advect3d for different tile sizes for two loops. We notice again that there is some variation (about 10%) in performance within the tile size search space. More interestingly however, we notice that all of the points within the tile size search space lies below the performance of the original fusion configuration. This says that it is best to leave the loops untiled for this particular fusion configuration. However, there may be other fusion configurations for which tiling may be desirable. Because we perform an orthogonal search, we never explore the tiling search space for other, possibly sub-optimal fusion configurations.
130
Performance (Normalized Cycle Count)
0.34 0.34 0.33 0.33 0.32 0.32 0.31
31
0.31
21
29
Tile Size
1 33
25
21
13
Tile Size
17
5
11 9
1
0.30
Figure 7.17 : Tile size search space for best fusion configuration for advect3d on Opteron.
Thus, an orthogonal search on the transformation parameter search space leads to less than desirable performance. Now, consider the search space corresponding to different tolerance values for the effective cache capacity in Fig. 7.18. This search space considers both transformations together. For this search space, our search strategy is not tied to a particular fusion configuration when searching for different tile sizes. For each tolerance value of effective cache capacity a different fuse-tile combination is generated. We observe that this search space not only has a lot fewer points, but also leads to higher performance. This is a direct consequence of linearizing the search space using the effective cache capacity parameter. The parameter search space of advect3d is a prime example when the orthogonal nature of the search space leads to reduced performance. The situation where none of the tile sizes results in improved performance for a chosen fusion configuration may not arise for all applications. However, these experimental results demonstrate the
Performance (Normalized Cycle Count)
131 0.45 0.40 0.35 0.30 0.25 0.20 0.15 0.10 0.05 0.00 1%
2%
3%
4%
5%
6%
7%
8%
9%
10%
Tolerance for ECC
Figure 7.18 : Search space for effective cache capacity for advect3d on Opteron.
potential hazards of using an orthogonal search without considering the interaction between transformations.
Performance vs. Cost As demonstrated above, by tuning for the effective cache capacity parameter, we are able to explore the combined search space of fusion and tiling in a non-orthogonal manner, which can lead to improved performance. However, by moving to the search space of estimates of machine parameters, we are also moving into a much smaller search space. Therefore, it is important to evaluate how much performance is lost as a result of moving into the smaller search space. To do this, we perform a set of experiments, comparing model-based with direct. For these experiments, we replace our search strategy with a multi-dimensional direct search that explores the search space of possible fusion configurations and tile sizes. Since the tiling search space dimension changes for each fusion configuration, direct search performs an orthogonal search. That is it first searches for the best fusion
132
Speedup over baseline
1.25 1.20 1.15 1.10 1.05 1.00 advect3d
erle
model-based
liv18
mgrid
direct
Figure 7.19 : Performance comparison between model-based and direct on Opteron.
configuration and once the best fusion configuration has been found it attempts to find the best tile sizes for that particular fusion configuration. On the other hand, model-based uses effective cache capacity to linearize the search space for fusion and tiling. Thus, for all applications model-based explores a two-dimensional search space. Figs. 7.19 and 7.20 show performance results from four applications on the MIPS and the Opteron using the two search strategies. The results show that model-based is able to find values that are very close to the values found by direct. For advect3d on the Opteron, model-based significantly outperforms direct. This, of course, is due to the orthogonal nature of the search method, as discussed earlier. For all other applications direct performs better. However, the performance gap is never more than 5%. On the other hand, in terms of tuning time we pay a high premium when we apply direct search. Figs. 7.21 and 7.22 show that on average direct requires about four times as many program evaluations as model-based. In the context of
133
Speedup over baseline
1.5 1.4 1.3 1.2 1.1 1.0 advect3d
erle
model-based
liv18
mgrid
direct
No. of Program Evaluations
Figure 7.20 : Performance comparison between model-based and direct on MIPS.
60 50 40 30 20 10 0 advect3d
erle
model-based
liv18
mgrid
direct
Figure 7.21 : Tuning time comparison between model-based and direct on Opteron.
No. of Program Evaluations
134 35 30 25 20 15 10 5 0 advect3d
erle
model-based
liv18
mgrid
direct
Figure 7.22 : Tuning time comparison between model-based and direct on MIPS.
empirical tuning, where the number of program evaluations is the principal bottleneck, this savings in tuning time will be significant for any decent sized application. In such cases, the savings in tuning cost may make the small sacrifice in performance worthwhile.
Best Parameters We conclude the comparison of model-based and direct with a look at the best transformation parameters discovered by the two strategies. The best tile sizes found by each strategy on the MIPS are presented in Table. 7.1. Interestingly, the best tile sizes discovered by the two strategies are significantly different in some cases. This discrepancy may be explained by several factors. The cost models used in model-based compute conservative estimates of the architectural parameters. Thus, the tile sizes picked by model-based are sometimes smaller than necessary. As we can see, in most cases the tile sizes picked by direct is larger than model-based. Another factor that explains some of the discrepancy is the multi-dimensional
135 model-based
direct
[4, 20]
[6, 15]
erle
[12, 28, 12, 12]
[18, 62, 6, 109]
liv18
[12, 60]
[20, 72]
mgrid
[4, 12, 4, 120, 4, 24]
[6, 13, 18, 112, 8, 32]
advect3d
Table 7.1 : Best tiling parameters
nature of the search space. Each dimension in the search space can affect performance in different ways. For example, the level-two cache miss rate is sensitive to the inner tile size whereas the TLB miss rate is sensitive to the outer tile size. Thus, the trade-off between L2 misses and TLB misses leads to two pairs of tile sizes that are significantly different but produce good results.
7.7
Summary
In this chapter, we have presented a model-driven approach of empirically tuning loop fusion and tiling parameters. The experimental results in Section 7.6 show that our analytical model is able to estimate the trade-offs between fusion and tiling with reasonable accuracy. By combining our static model with empirical search, we are able to adapt the transformed programs to achieve good performance on different platforms. Our approach of tuning for architectural parameters results in a significant reduction in the size of the optimization search space, while incurring only a small performance penalty in the resulting code.
136
Chapter 8 Model-guided Tuning of Array Padding Factors In this chapter, we present a strategy for incorporating array padding into an automatic tuning framework. We describe a graph-coloring based approach for efficient allocation of arrays and a cost model for making fusion, tiling and padding decisions in an integrated fashion. We show how this cost model can be parameterized for use with empirical search for fine tuning of transformation parameters to different architectures. We also present a preliminary evaluation of our approach using hand experiments on two architectures.
8.1
Introduction
Array padding belongs to the family of data-layout transformations that aims to improve memory hierarchy performance by reorganizing the way data is laid out in the program. It is a a well-known and effective technique for eliminating conflict misses that occur in set-associative caches. The transformation involves inserting dummy elements between variables to influence where in cache each variable is mapped. The goal is to find a mapping for all variables that results in the least amount of overlap in cache. Although array padding can be a very effective technique for improving program performance, the task of finding suitable padding factors is usually quite difficult. In the general case, the problem of finding an optimal data layout has been shown to
137 be NP-hard [59]. Even more restricted instances of the problem, such as the optimal layout of data with bounded arrays can be shown to be NP-hard∗ . Because the problem of finding an optimal solution is generally intractable, researchers have developed several heuristic algorithms for finding suitable padding factors (see Chapter 3). However, finding a good heuristic for array padding has also proven to be non-trivial. Several factors that make finding suitable padding factors difficult. First, padding factors are highly sensitive to parameters of the underlying cache architecture. Small changes to any of the cache parameters can completely nullify the effects of padding. Second, similar to loop fusion and tiling, array padding has strong interaction with several other program transformations. Therefore, finding the right padding factors often involves considering the complex trade-offs with transformations that are applied both before and after array padding. Finally, determining effective padding factors requires a global view of the program. A padding solution that is optimal for one particular loop may have an adverse effect on another loop in the program. In the section that follows we use a simple example to illustrate some of the difficulties of padding arrays effectively.
8.2
An Example
Consider the code in Fig. 8.1. We have two two-dimensional loop nests, each of which sweeps over several one-dimensional arrays a number of times. For this example, assume that we have a two-way set associative cache with 16 blocks with 16 words per block. We want to allocate all arrays in the code segment such that the number of conflict misses is minimized. ∗
We can show this by formulating the problem as an integer programming problem.
138
LA: do j = 1, 64 do i = 1, 64 b(i) = a(i) + c(i) + d(i) enddo enddo LB: do j = 1, 64 do i = 1, 48 e(i) = b(i) + b(i+1) + d(i) + d(i+1) + e(i+1) enddo enddo
Figure 8.1 : Example code before transformations.
8.2.1
Global Array Padding
Fig. 8.2 shows the number of contiguous memory blocks touched by each array in the inner loop of each loop nest. In loop nest LA , we access four memory blocks from each of the arrays a(), b(), c() and d(). On the other hand, in loop nest LB , because of the inner-loop carried reuse, we access five blocks each, from arrays b(), d() and e(). We note, that the total number of blocks accessed in each loop nest is less than the capacity of our example cache. Therefore, there is a perfect allocation for all arrays for each loop separately. However, if we were to start with the first loop nest and allocate all of the arrays to minimize the conflicts in the first loop and then focus on the second loop nest then we would end up with the allocation shown in Fig. 8.2. As we can see, this does not lead to a perfect allocation. We have two overlapped blocks in cache which will cause severe conflict misses when the code is executed. The reason this happens is because two of the arrays, b() and d() are shared among the two loop nests. When we allocate arrays in loop nest LA , we fix the locations for these two arrays. Then, when we try to find the best allocation
139
two block overlap Contiguous memory blocks accessed for each reference
Global layout for a 2-way set associative cache
a(i) b(i)
a()
c(i)
b()
d(i)
c() d()
CFP(LA) = 4 x 4 = 16 blocks
CS
e()
b(i), b(i+1) d(i), d(i+1) e(i), e(i+1)
CFP(LB) = 5 x 3 = 15 blocks
CS
CS = 8 x 2 = 16 blocks blocks accessed in loop LA blocks accessed in loop LB blocks accessed in both loops
Figure 8.2 : Cache conflicts arising when padding arrays in local scope.
for LB , the only array we have control over is e(). No matter where we place e(), we cannot avoid this conflict. It can be easily shown, that we encounter the same problem if we started with LB rather than LA . This example emphasizes the need for having a global view when allocating or padding arrays in a program. Fig. 8.3 shows a simple approach to a global allocation strategy. In this example, arrays that are accessed in multiple loops are allocated before arrays that are accessed in only one loop nest. Thus, instead of trying to find optimal allocation for each loop
140
one block overlap Contiguous memory blocks accessed for each reference
Global layout for a 2-way set associative cache
a(i) b(i)
b()
c(i)
d()
d(i) e() b(i), b(i+1)
a()
d(i), d(i+1) e(i), e(i+1)
c()
Layout order
M ax Length x Num of referring loops
CS = 8 x 2 = 16 blocks 4
a() : 4 x 1 = 4
1
b() : 5 x 2 = 10
5
c() : 4 x 1 = 4
2
d() : 5 x 2 = 10
3
e() : 5 x 1 = 5
blocks accessed in loop LA blocks accessed in loop LB blocks accessed in both loops
Figure 8.3 : Fewer cache conflicts when padding arrays in global scope.
nest this strategy aims to allocate arrays such that the overall performance of the program is improved. Although this global allocation strategy does not eliminate all conflicts, it reduces the number of overlapped blocks in cache.
8.2.2
Padding-Tiling Interaction
The code in Fig. 8.1 has constant loop bounds. Hence, computing the number of memory blocks touched in each loop nest is trivial. However, most real applications are likely to have symbolic loop bounds whose value may depend on the input data
141
LA: do ii = 1, M, T do j = 1, N do i = ii, MIN(ii+T-1, M) b(i) = a(i) + d(i) + c(i) enddo enddo enddo LB: do ii = 1, M, T do j = 1, N do i = ii, MIN(ii+T-1, M) e(i) = d(i) + d(i+1) + b(i) + b(i+1) + e(i+1) enddo enddo enddo
(a) code after tiling
LAB: do ii = 1, M, T do j = 1, N do i = ii, MIN(ii+T-1, M) b(i) = a(i) + d(i) + c(i) e(i) = d(i) + d(i+1) + b(i) + b(i+1) + e(i+1) enddo enddo enddo
(b) code after fusion
Figure 8.4 : Example code with fusion and tiling.
142
Contiguous memory blocks accessed by each reference
Global layout for a 2-way set associative cache
a(i) b(i)
a()
c(i)
b()
d(i)
c() d()
CFP(LA) = 4 x 4 = 16 blocks
CS
e()
b(i), b(i+1) d(i), d(i+1) e(i), e(i+1)
CFP(LB) = 4 x 3 = 12 blocks
CS = 8 x 2 = 16 blocks
CS
blocks accessed in loop LA blocks accessed in loop LB blocks accessed in both loops
Figure 8.5 : Optimal allocation with reduced tile sizes.
set. In such cases, determining the number of memory blocks accessed becomes much more difficult. As a result, finding the best data layout for a program also becomes more difficult. However, the interaction with tiling works favorably in this situation. We can use tiling to limit the number of blocks touched in the inner loop and therefore, can apply a more accurate and efficient allocation strategy. Fig. 8.4(a) shows the code from Fig. 8.1 using symbolic loop bounds and each of the loop nests tiled with a factor of T . If we choose T = 64 then we can allocate all arrays as we had done previously with constant loop bounds.
143 Although tiling enables us to determine the number of blocks accessed in each loop nest it does not necessarily imply a better data layout. For that, we need to find a suitable tile size as well. The allocation in Fig. 8.3 results in one overlapped block in cache. We can eliminate this overlap if we touched fewer blocks in either of the loop nests. This is achieved by choosing a tile size, T < 64 for LA or T < 48 for LB . However, as mentioned in Chapter 7, choosing a smaller tile size results in lost reuse for the inner loop. Hence, we want to choose a smaller tile size only if losing inner-loop reuse is less of a sacrifice than accepting an overlapped block in cache. For the code in Fig. 8.4, the global allocation causes one overlapped block in cache, which results in (M/T × 2) × N = 2NM/T misses. On the other hand, if we reduce the tile size for LB , which has two inner-loop carried reuse, the code will incur 2(NM/bT − NM/b(T − b)) additional misses, where is b is the block is size in words. Hence, we want to reduce the tile size only if 2NM/T > 2(NM/bT − NM/b(T − b)) Simplifying the above we get, T >b+1 . Thus, as long as our tile size is larger than one cache block it is always profitable to reduce the tile size rather than accommodate an overlapped block in cache. Of course, this constraint will change depending on the reuse patterns of different loop nests. Fig. 8.5 shows the allocation of arrays that avoids all conflicts using the reduced tile size.
144
two block overlap Contiguous memory blocks accessed for each reference
Global layout for a 2-way set associative cache
a(i) b(i), b(i+1)
a()
c(i)
b()
d(i), d(i+1)
c()
e(i), e(i+1) d() e() CFP(LA) = 4 x 3 + 3 x 2 = 18 blocks > CS
CS = 8 x 2 = 16 blocks
Figure 8.6 : Conflicts in cache when padding arrays in fused loop nest.
8.2.3
Padding-Fusion Interaction
There is considerable interaction between array padding and loop fusion as well. However, this interaction is generally negative. Consider the code in Fig. 8.4(b), where we have fused the two loop nests that we had previously tiled. In fusing the two loops we have increased the potential for cross-interference between arrays in the fused nest. Fig. 8.6 shows the the number of blocks touched by each array in the fused nest. The best possible allocation for the fused nest is also shown in this figure. As we can see, after fusion we are not able to avoid conflicts in cache no matter what padding factors we choose for the different arrays. Thus, for this particular example it is best to leave the loops unfused so that we can minimize the number of conflict misses.
145
8.3 8.3.1
Background Program Model
We make the same assumptions about the program model as we did in earlier chapters. A program is a collection of statements each enclosed by one or more loops. Loops are perfectly nested and loop bounds are affine expressions of loop induction variables. All array references are uniformly generated [25]. We assume that the first declared array is aligned at a page boundary.
8.3.2
Notation and Terminology
The following notation is used to describe the cost model: CS = cache size in number of cache blocks CA = cache associativity S = CS /CA = number of sets (associativity groups) CF P (l) = cache footprint of loop l in terms of cache blocks
We use the following terminology in describing the cost model in the next section: Block: A block refers to either a cache block or a contiguous block of memory within the allocation of an array that maps to a single cache block. The distinction will be clear from context. Array section: An array section is simply the number of blocks in an array that is touched in the iteration space of a loop nest. In the context of the cost model, we are chiefly concerned about the number of blocks touched within some tiled portion of the iteration space. The notion of array sections originates from bounded regular sections defined by Havlak and Kennedy [31]
146
Interference: An interference between two arrays refers to the number of cache blocks where the two arrays can overlap. Note, when we refer to interference it implies a probable interference. That is, there exists an allocation for which the two array sections will overlap. It does not imply overlap for all allocations.
Local Interference Graph: A local interference graph, G = (V, E) is an undirected weighted graph, where a vertex, v ∈ V represents an array accessed in loop nest l. A weighted edge, e ∈ E between v1 and v2 represents the cost of interference between v1 and v2 in loop nest l.
Global Interference Graph: A global interference graph, G = (V, E) is an undirected weighted graph, where a vertex, v ∈ V represents an array accessed in program P . A weighted edge, e ∈ E between v1 and v2 represents the cost of interference between v1 and v2 in program P .
8.4
Cost Model
We approach the problem of finding an optimal data layout with tiling and fusion by formulating it as a graph-coloring problem. The idea is to first tile (and fuse) the loops so as to fix the size of the array sections accessed in each tile and then attempt to find a global layout that eliminates cache interference within each tile. We do this by building a weighted interference graph, similar to the graph used in register allocation [16]. In the interference graph, vertices correspond to arrays in the program and an edge between two vertices represents a potential cache conflict between the two corresponding arrays. We then use a heuristic to color the graph so
147 that no two neighboring vertices have the same color. A color in this case corresponds to an associativity group in the target cache. Of course, the graph-coloring problem is NP-complete and so an optimal solution cannot be guaranteed in polynomial time. When we encounter the situation when there are no colors left for a particular vertex, we may decide to distribute (unfuse, if the loop has been fused previously) one of the loops where the array is referenced or re-tile the loop with a smaller tile size. If neither option appears profitable we accept the overlap in cache and move on to the next vertex. The algorithm proceeds in four major steps: fusing loops and selecting tile sizes, building the interference graph, coloring the graph and deriving padding factors from the colored graph. We describe these four steps in the following sections.
8.4.1
Fusing Loops and Selecting Tile Sizes
We use the algorithm presented in Chapter 7 to fuse and tile loops within the program. We however, do not perform any search based tuning at this point. There are two reasons for performing fusion and tiling in this initial phase. First, fusing the loops gives us a fixed loop structure for building the initial interference graph. Second, tiling the loops allows us to fix the size of the array sections within each loop nest. Since the algorithm for fusion and tiling has been described elsewhere, we do not reproduce the entire algorithm here. We only reiterate the two basic principles used in making fusion and tiling decisions. For each two-level loop nest l, we pick tile sizes T1 and T2 such that CF P (l(T1 , T2 )) < CS
(8.1)
148 For any pair of fusible loops li and lj , we fuse the two loops only if CF P (lij ) < CS
(8.2)
We note that if (1) and (2) hold then theoretically, we can allocate arrays for any particular loop to eliminate all conflict misses. That is, there is a trivial solution for each loop separately.
8.4.2
Building the Interference Graph
The interference graph, G = (V, E) is an undirected weighted graph where a vertex, v ∈ V corresponds to an array accessed in the program and a weighted edge, e ∈ E represents the cost of interference between two vertices. The cost of an interference is estimated in terms of the number of blocks in cache where the two arrays overlap and the cache miss penalty of each overlap. The algorithm for building the interference graph proceeds in two steps. We first build an interference graph for each loop separately. Then, on a second pass, we merge all local interference graphs to construct an interference graph for the whole program. The two major steps to building the interference graph is outlined below.
Local Interference Graph To construct a local interference graph for a tiled loop nest l(T1 , T2 ), we first add a vertex v for for each array accessed in the loop nest. Then, for each vertex v in the graph we determine the array section that is accessed during one execution of tile (T1 , T2 ). Computing array sections for a tiled loop nest is relatively simple. They can be directly derived from the tile sizes and the set of array references in the loop. The algorithm for computing array sections in a tiled loop nest is outlined in Fig. 8.7. Let
149 procedure ComputeArraySection(REFS(a), T1 , T2 ) /* /* /* /*
REF S(a) is the set of references for array a() in a tiled loop nest l */ T1 , T2 are the inner and outer tile sizes respectively */ i, j refer to the index variable for inner and outer loop respectively */ sectiona holds array section for array a() at termination */
sectiona ← 0 /* compute section for inner-loop references */ if if ref of the form a(i) or a(i - p) or a(i + p) ∈ REF S(a) then sectiona ← T1 × T2 end if innerGrouplow ← refs ∈ REF S(a) of the form a(i - p) sectiona ← sectiona + F indMaxAdditive(innerGrouplow ) ∗ T2 innerGrouphigh ← refs ∈ REF S(a) of the form a(i + p) sectiona ← sectiona + F indMaxAdditive(innerGrouphigh ) /* compute section for outer-loop references */ if ref of the form a(j) or a(j - p) or a(j + p) ∈ REF S(a) then sectiona ← sectiona + T2 end if outerGrouplow ← refs ∈ REF S(a) of the form a(j - p) sectiona ← sectiona + F indMaxAdditive(outerGrouplow ) outerGrouphigh ← ref s ∈ REF S(a)of thef orma(j + p) sectiona ← sectiona + F indMaxAdditive(innerGrouphigh ) Figure 8.7 : Algorithm for computing array section.
REF (v) be the set of references for the array corresponding to vertex v. We then compute the array section for v using the following:
v.section = ComputeArraySection(REF (v), T1, T2 ) Next we need to compute the number of times each block is referenced in the loop. This is done using reuse analysis described in Chapter 6.
150
v.reuse = ComputeReuse(ReuseT ype(REF (v)), T1, T2 ) Since all arrays within a tile can interfere with each other, the local interference graphs are all fully connected. Hence, we add an edge between each pair of nodes in the graph. For an edge, e(v1 , v2 ), we assign a weight W using the following formula e(v1 , v2 ).W = MIN(v1 .section, v2 .section) × (v1 .reuse + v2 .reuse) In the worst case, the smaller array section completely overlaps with the larger array section. Therefore, the maximum number of blocks where the two arrays can overlap is the number of blocks accessed by the array with the smaller section. The cost of an overlap is estimated by the number of times we incur a miss in cache. The number of cache misses is determined by the number of times each overlapped block is accessed in the code. The reuse field gives us this information. Hence, when computing the edge weight we sum these two fields to get an estimate of the total cost of interference.
Global Interference Graph Once we have computed all of the local interference graphs we make a second pass through the loop nests and merge the graphs two at a time, in program order. When merging two local interference graphs we only need to consider vertices that correspond to arrays that are referenced in both loops. Vertices that do not appear in both graphs are not affected by the merge operation. When merging a pair of vertices that correspond to the same array in the code, we need to update both the section and the reuse fields. Since the section and reuse information for each loop is needed for optimally allocating arrays at a later phase, we need to store this information for
151 both the loops. Hence, for the global interference graph we maintain a list associated with each vertex to store this information. Assume we are merging vertices va and vb in graphs Gi and Gj then we have vnew .section[i] = va .section vnew .section[j] = vb .section Similarly, vnew .reuse[i] = va .reuse vnew .reuse[j] = vb .reuse When merging two local interference graphs, edges need not be updated unless there are multiple arrays shared between the two graphs. If there are two (or more) arrays shared between two loops then in addition to merging the two pairs of vertices, we also need to merge the two edges. The reuse component of the edge weight can be computed by simply adding the reuse components of the two edges. The section component is computed by taking the max-min of the two pairs of array sections. Thus, at the end of this phase we have an interference graph for the full program. 8.4.3
Coloring the Interference Graph
We adopt Chow and Hennessy’s priority-based coloring scheme in coloring the interference graph [13]. We sort the vertices in descending order by weight and put the sorted vertices into a working list. We then iteratively pick the highest ranked vertex v and try to color it. If we are able to find a color for v, we remove it from the working list. If v is not color-able we either try to distribute the loop where v is referenced or attempt to re-tile the corresponding loop nest. If neither option is feasible, we assign a color to v that minimizes the number of overlaps in cache for v.
152
procedure ColorVertex(G, v) Slots[S] /* array to store counters */ CA /* cache associativity */ /* identify slots occupied by ≥ CA arrays */ for each u ∈ neighbors(v) do if u allocated then for i = u.start to u.start + W (u, v) do Slots[i]++ end for end if end for /* mark each slot occupied by ≥ CA as unavailable */ /* mark k preceding slots as unavailable */ for each sequence of slots P occupied by ≥ CA arrays do for i = P.start to P.end do Slots[i] ← unavailable end for for i = P.start − MAX(W, uk , v) to P.start do Slots[i] ← unavailble end for end for /* find first available slot and color the vertex */ for i = 0..S − 1 do if Slots[i] = available then v.start ← i break end if end for if no slots available then Distribute(v) or Tile(l) or Try again allowing n overlap end if Figure 8.8 : Algorithm for coloring a vertex.
153 Initially, number of colors available is the number of associativity groups in the target cache. (i.e. all integers between 0 and S − 1). When we color a particular vertex v, we remove from the available list all colors that fall in the span of v. Of course, we need to maintain a counter for associativity for each set. A particular color is made unavailable only if the counter goes beyond the associativity of the cache. Figure 8.8 shows a high-level sketch of the algorithm for coloring a particular vertex.
8.4.4
Computing Padding Factors
Once we have colored the global interference graph, each array in the program will be assigned a starting location in cache that is deemed as most profitable according to our cost model. The final step in our algorithm involves deriving a padding factor from the starting location of each array. We derive padding factors from relative offsets of two consecutively declared variables. Let, Loci be the starting location in cache for the ith array in the program. We compute the padding factors for all variables using the following formula: P ad0 = 0 P adi = Loci − Loci−1 where 1 ≤ i ≤ A and A is the number of arrays in the program. Once all padding factors have been computed, we derive the new base addresses for each variable using the following formula: Basei = Addri +
i=0 X
P adi
i≤A
where Addri is the original memory address of the ith array.
154
8.5
Search Strategy
Our search strategy for tuning padding factors follows the method described in Chapter 7. Finding good padding factors is intricately related with determining a suitable value for the effective cache size parameter. Padding factors are not directly correlated with the capacity of the cache, as is the cache with loop fusion and tiling. However, finding good padding factors is dependent on choosing the right tile sizes for different loops. Choosing the right tile sizes in turn depends on finding a good estimate for the effective cache capacity. Hence, tuning for the best effective cache capacity is likely to lead to better padding values. This approach of searching for the best effective cache capacity creates a search space that is independent of the number of arrays in the program. In most cases, this leads to a much smaller search space. For example, the approach used by Vera et al. [73] searches for a range of padding factors for each array in the program. Hence, the size of their search space is A×R, where A is the number of arrays in the program and R is the number of different values considered for each padding factor. On the other hand, in our approach the size of the search space is bounded by the range of tolerance values used in the search for the best effective cache capacity. Hence, if we increase our tolerance by t% in a range of 1 to R, then the size of the search space is R/t. Hence, even for a 1% increment we end up with a smaller search space as long as there is more than one array in the program.
8.6
Preliminary Evaluation
We have a partial implementation of the array padding algorithm in our automatic tuning framework. We use this implementation to present a preliminary evaluation of
155
L1 M iss Rate (%)
35% 30% 25% 20% 15% 10% 5% 0% 400
1200
2000
2800
3600
Input Size G lobalPad
RegularPad
W orstcase
Figure 8.9 : Comparison of L1 cache miss rates for different padding strategies on Pentium4.
45%
L1 Cache Miss Rate
40% 35% 30% 25% 20% 15% 10% 5% 0% 400
1200
2000
2800
3600
Input Size GlobalPad
RegularPad
Worstcase
Figure 8.10 : Comparison of L1 cache miss rates for different padding strategies on Opteron.
156 our strategy. We use a simple synthetic benchmark, arraysweep to test our strategy. arraysweep sweeps over ten arrays in two separately tiled loop nests. Hence, this program provides ample opportunities for cache conflicts to arise. The tile sizes are preselected so that the cache footprint of each tile is less than the capacity of the target cache. Thus, the program allows us to determine the effectiveness of the padding strategy in reducing conflict misses in isolation. We use Pentium 4 and Opteron as our testing platforms. We compare our global padding strategy (globalpad) with a regular padding strategy regularpad. In regularpad, padding factors are chosen for arrays by considering one loop nest at a time. Strategies similar to regularpad have been previously used by Rivera and Tseng [65] in eliminating severe thrashing of arrays. As a point of reference, we also look at the extreme case when all arrays start-off at the same cache location and no padding is used (worstcase). Fig. 8.9 shows preliminary experimental results on Pentium 4. We measured the L1 miss rate for arraysweep for all three scenarios for varying array sizes. The results show that the L1 miss rates for globalpad is about 5% less than that of regularpad. This difference in miss rates does not change as we vary the size of the arrays. Also, as expected the miss rates for worstcase is very high, almost 16 times that of globalpad. Fig. 8.10 shows experimental results on Opteron. Although the Opteron has a much bigger L1 cache than the Pentium4, it only has an associativity of two. Hence, we observe similar results on this platform. In the worstcase scenario, the application suffers almost a 40% miss rate and again globalpad does better than regularpad. Although in this case the difference in miss rates is not as much.
157
8.7
Summary
The preliminary experimental results presented in this chapter is not sufficient to evaluate our padding strategy. The results merely serve as proof of concept. Performing a more thorough evaluation of the method would require a complete implementation of our strategy. This is part of our future plans. Nevertheless, the strategy described in this chapter shows that the approach of applying integrated program transformations with empirical search can be extended to include other key memory hierarchy optimizations.
158
Chapter 9 Conclusions We began this dissertation by emphasizing the importance of automatic tuning in achieving high-performance on scientific applications in the ever-changing microarchitectural landscape. We also pointed out the serious difficulties we face in trying to automatically tune applications to different architectures. Over the course of several chapters in this dissertation, we have presented a number of strategies that address these difficult problems. The goal of this work has been to lay the foundations for an automatic tuning framework that will present itself as a viable alternative to scientists who require portable high-performance for their applications. This chapter first summarizes the main contributions of this dissertation and then discusses some future extensions to this work.
9.1
Contributions
A Tool for Automatic Tuning Chapter 4 describes our framework for automatic tuning. Although this tool was primarily developed to support our research, it addresses several important issues that can help advance research in automatic tuning. Chief among them is the integration of loop-level performance metrics with loop-level control over transformations. Specifying optimization parameters through source code directives is a novel idea in the area of automatic tuning. This fine-grain approach of tuning applications can result
159 in significant reduction in tuning time. This approach will be particularly useful for tuning applications in a distributed system where different code regions can be tuned in parallel.
Insight into the Nature of the Search Space The experimental study described in Chapter 5 provides insight into the characteristics of the search space of certain transformation parameters. We used this insight in developing our search space pruning strategy. The large volume of data generated through exhaustive search of different search spaces can provide additional insight about the nature of the search spaces. This knowledge can be useful in developing new search strategies and search space reduction techniques.
Heuristic Models for Integrated Transformations Chapters 6, 7 and 8, all describe new heuristic models for applying memory hierarchy transformations. Although we developed the strategies with the intention of using them in the context of automatic tuning, these models can be useful enhancements for any optimizing compiler. In particular, the integrated cost model for fusion and tiling in Chapter 7 and the global array padding algorithm with fusion and tiling in Chapter 8 are both novel approaches for performing integrated program transformations.
Search Space Pruning The main contribution of this work is the search space pruning strategy described in Chapter 7. The use of architecture-dependent model parameters in empirical search is a novel idea which has several benefits. This pruning strategy causes a significant
160 reduction in the search space of transformation parameters. Using the notion of effective cache capacity we are able to capture the effects of multiple transformations with a single parameter, This allows us to linearize a multi-dimensional search space into a single dimension. Moreover, our search allows us to correct for inaccuracies within the models which leads to more accurate estimates of architectural parameters.
9.2
Future Work
Exploring More Transformations The most immediate extension to this work is to incorporate more transformations into the framework. Some of the transformations we plan to include in our framework are: unroll-and-jam, loop interchange and software prefetching. Our goal is to have a core set of memory hierarchy transformations that attack the problem from different angles. For example, we currently have tiling and array padding in our framework that mainly target capacity and conflict misses. Therefore, a useful choice for inclusion is software prefetching that can hide latency for compulsory misses. Of course, adding more transformations will pose new challenges. Adding new transformations will require careful analysis of the interaction between the new transformation and each of the transformations already in the framework. As the number of transformations grows large, this task may prove to be rather daunting. In such situations, a favorable trade-off may be to reduce some of the analysis in favor of longer search times.
Exploring More Architectural Parameters Our current search strategy considers the register set and different levels of cache for tuning. However, there are several other memory hierarchy parameters that can have
161 a significant impact on performance. Chief among them is the translation look-aside buffer (TLB). The TLB often turns out to be the principal bottleneck for applications processing large data sets. TLBs tend to have a small number of associativity groups with high degrees of associativity. Hence, the TLB poses a somewhat different challenge in improving memory hierarchy performance. One of our future plans is to develop a model (similar to the model of the effective cache capacity) that estimates the fraction of TLB that is available to a program during execution. We then plan to use that model to tune applications for improved TLB performance. The presence of load and store buffers in the underlying architecture can also have a significant impact on the memory hierarchy performance of an application. For this reason, in the future, we plan to incorporate number of outstanding loads and stores as possible tuning parameters. Our experimental results revealed some interplay between certain memory hierarchy transformations and software prefetching. Similarly, the profitability of certain transformations may be affected by the hardware prefetch mechanisms that exist on some architectures. As such, we plan to include hardware prefetch distance as a parameter for empirical tuning in the future.
Tuning for Multi-Core Platforms Chip multiprocessor systems (CMP) are playing an increasingly important role in high-performance computing. Each new generation of CMPs is likely to double the number of cores on a chip and also present a more complex memory hierarchy. Hence, software tools will be critical in harnessing the full potential of large-scale chip multiprocessor systems. Keeping this scenario in mind, we want to expand our research on automatic tuning to tuning for multi-core systems. In particular, we want to explore tuning strategies for the shared cache architecture on multi-core platforms.
162 The shared cache architecture of CMPs present an inherent trade-off between locality and parallelism. Striking the right balance between locality and parallelism will be critical to performance for many applications. We intend to develop an automatic tuning strategy that attempts to find the optimal granularity of parallelism without sacrificing locality on individual cores. Models we have developed in estimating parameters for non-shared caches can be extended for shared caches to guide the tuning strategy.
163
Bibliography
[1] J. R. Allen, D. Callahan, and K. Kennedy. Automatic decomposition of scientific programs for parallel execution. In Proceedings of the Fourteenth Annual ACM Symposium on the Principles of Programming Languages, Munich, Germany, Jan. 1987. [2] R. Allen and K. Kennedy. Optimizing Compilers for Modern Architectures. Morgan Kaufmann, 2002. [3] L. Almagor, K. D. Cooper, A. Grosul, T. J. Harvey, S. W. Reeves, D. Subramanian, L. Torczon, and T. Waterman. Finding effective compilation sequences. In LCTES ’04: Proceedings of the 2004 ACM SIGPLAN/SIGBED conference on Languages, compilers, and tools for embedded systems, pages 231–239, 2004. [4] K. Beyls and E. D‘Hollander. Reuse distance as a metric for cache behavior. In Proceedings of the IASTED International Conference on Parallel and Distributed Computing and Systems, Anaheim, California, USA, 8 2001. [5] J. Bilmes, K. Asanovic, C.-W. Chen, and J. Demmel. Optimizing matrix multiply using phipac: a portable high- performance ansi-c coding methodology. In Proceedings of the 1997 ACM International Conference on Supercomputing, Vienna, Austria, July 1997. [6] D. C. Burger and T. M. Austin. The simplescalar tool set, version 2.0. Technical report, Department of Computer Science, University of Washington, June 1997.
164 [7] D. Callahan, K. Kennedy, and A. Porterfield. Software prefetching. In Proceedings of the Fourth International Conference on Architectural Support for Programming Languages and Operating Systems (ASPLOS-IV), Santa Clara, CA, Apr. 1991. [8] S. Carr. Memory-Hierarchy Management. PhD thesis, Dept. of Computer Science, Rice University, Sept. 1992. [9] S. Carr and K. Kennedy. Compiler blockability of numerical algorithms. In Proceedings of Supercomputing ’92, Minneapolis, MN, Nov. 1992. [10] S. Carr, K. S. McKinley, and C. W. Tseng. Compiler optimizations for improving data locality. In Proceedings of the Sixth International Conference on Architectural Support for Programming Languages and Operating Systems (ASPLOS-VI), San Jose, CA, Oct. 1994. [11] J. Chame and S. Moon. A tile selection algorithm for data locality and cache interference. In Proceedings of the 13th ACM International Conference on Supercomputing, Rhodes, Greece, June 1999. [12] C. Chen, J. Chame, and M. Hall. Combining models and guided empirical search to optimize for multiple levels of the memory hierarchy. In International Symposium on Code Generation and Optimization, San Jose, CA, 2005. [13] F. C. Chow and J. L. Hennessy. The priority-based coloring approach to register allocation. ACM Transactions on Programming Languages and Systems, 12(4), 1990. [14] S. Coleman and K. S. McKinley. Tile size selection using cache organization. In
165 Proceedings of the SIGPLAN ’95 Conference on Programming Language Design and Implementation, La Jolla, CA, June 1995. [15] K. Cooper, D. Subramanian, and L. Torczon. Adaptive optimizing compilers for the 21st century. In Proceedings of the Los Alamos Computer Science Institute Second Annual Symposium, Santa Fe, NM, Oct. 2001. [16] K. D. Cooper and L. Torczon. Engineering a Compiler. Morgan Kaufmann, 2004. [17] D. L. Dai, S. K. S. Gupta, S. D. Kaushik, J. H. Lu, R. V. Singh, C.-H. Huang, and P. Sadayappan. EXTENT: A portable programming environment for designing and implementing high-performance block recursive algorithms. In Proceedings of Supercomputing ’94, pages 49–58, 1994. [18] A. Darte. On the complexity of loop fusion. In PACT ’99: Proceedings of the 1999 International Conference on Parallel Architectures and Compilation Techniques, 1999. [19] C. Ding and K. Kennedy. Resource-constrained loop fusion. Technical report, Dept. of Computer Science, Rice University, Oct. 2000. [20] C. Ding and K. Kennedy. Improving effective bandwidth through compiler enhancement of global cache reuse. In International Parallel and Distributed Processing Symposium, San Francisco, CA, Apr. 2001. (Best Paper Award.). [21] C. Ding and Y. Zhong. Predicting whole-program locality through reuse-distance analysis. In Proceedings of the SIGPLAN ’03 Conference on Programming Language Design and Implementation, San Diego, CA, 2003.
166 [22] T. M. Eidson and G. Erlebacher. Implementation of a fully-balanced periodic tridiagonal solver on a parallel distributed memory architecture. Technical Report TR-94-37, Institute for Computer Application in Science and Engineering, 1994. [23] K. Esseghir. Improving data locality for caches. Master’s thesis, Dept. of Computer Science, Rice University, Sept. 1993. [24] M. Frigo. A fast Fourier transform compiler. In Proceedings of the SIGPLAN ’98 Conference on Programming Language Design and Implementation, Montreal, Canada, June 1998. [25] D. Gannon, W. Jalby, and K. Gallivan. Strategies for cache and local memory management by global program transformation. Journal of Parallel and Distributed Computing, 5(5):587–616, Oct. 1988. [26] G. Gao, R. Olsen, V. Sarkar, and R. Thekkath. Collective loop fusion for array contraction. In Proceedings of the Fifth Workshop on Languages and Compilers for Parallel Computing, New Haven, CT, Aug. 1992. [27] G.G.Fursin, M.F.P.O’Boyle, and P.M.W.Knijnenburg. Evaluating iterative compilation. In Proceedings of the Fifteenth International Workshop on Languages and Compilers for Parallel Computing, College Park, Maryland, July 2002. [28] S. Ghosh and M. M. amd Sharad Malik. Cache miss equations: An analytical representation of cache misses. In Proceedings of the 1997 ACM International Conference on Supercomputing, pages 317–324, Vienna, Austria, July 1997. [29] A. Goldberg and R. Paige. Stream processing. In Conference Record of the 1984
167 ACM Symposium on Lisp and Functional Programming, pages 228–234, Aug. 1984. [30] K. Goto and R. Geijn. On reducing tlb misses in matrix multiplication. Technical Report TR-2002-55, The University of Texas at Austin, Department of Computer Sciences, 2002. [31] P. Havlak and K. Kennedy. Experience with interprocedural analysis of array side effects. In Proceedings of Supercomputing ’90, pages 952–961, 1990. [32] M. D. Hill and A. J. Smith. Evaluating associativity in cpu caches. IEEE Trans. Comput., 38(12), 1989. [33] R. Hooke and T. A. Jeeves. Direct search solution of numerical and statistical problems. In Journal of the ACM, pages 212–229, 1961. [34] E.-J. Im, K. Yelick, and R. Vuduc. Sparsity: Optimization framework for sparse matrix kernels. International Journal of High Performance Computing Applications, 18(1):135–158, 2004. [35] K. Kennedy. Fast greedy weighted fusion. In ICS ’00: Proceedings of the 14th international conference on Supercomputing, 2000. [36] K. Kennedy and K. S. McKinley. Maximizing loop parallelism and improving data locality via loop fusion and distribution. In Proceedings of the Sixth Workshop on Languages and Compilers for Parallel Computing, Portland, OR, Aug. 1993. [37] S. Kirkpatrick, C. D. Gelatt, and M. P. Vecchi. Optimization by simulated annealing. Science, Number 4598, 13 May 1983, 220, 4598:671–680, 1983.
168 [38] T. Kisuki, M. O. Boyle, and P. Knijnenburg. Combined selection of tile sizes and unroll factors using iterative compilation. In Proceedings of the International Conference on Parallel Architectures and Compilation Techniques, pages 237– 246, Philadelphia, PA, 2000. [39] T. Kisuki and P. Knijnenburg. Combined selection of tile sizes and unroll factors using iterative compilation. The Journal of Supercomputing, 24(1):43–67, 2003. [40] P. Knijnenburg, T. Kisuki, and M. O. Boyle. Iterative compilation. In Embedded Processor Design Challenges - System Architecture, Modeling and Simulation (SAMOS), Lecture Notes in Computer Science 2268, pages 171–187. SpringerVerlag, May 2002. [41] P. Knijnenburg, T. Kisuki, K. Gallivan, and M.F.P.O’Boyle. The effect of cache models on iterative compilation for combined tiling and unrolling. Concurrency and Computation: Practice and Experience, 16:247–270, 2004. [42] D. Knuth. An empirical study of FORTRAN programs. Software—Practice and Experience, 1:105–133, 1971. [43] I. Kodukala and K. Pingali. Data-centric transformations for locality enhancement. International Journal of Parallel Programming, 29(3):319–364, 2001. [44] P. Kulkarni, S. Hines, J. Hiser, D. Whalley, J. Davidson, and D. Jones. Fast searches for effective optimization phase sequences. In Proceedings of the SIGPLAN ’04 Conference on Programming Language Design and Implementation, Washington, DC, June 2004. [45] L. Lamport. The parallel execution of do loops. Communications of the ACM, 17(2):83–93, 1974.
169 [46] E. Lewis, C. Lin, and L. Snyder. The implementation and evaluation of fusion and contraction in array languages. In Proceedings of the SIGPLAN ’98 Conference on Programming Language Design and Implementation, Montreal, Canada, June 1998. [47] R. M. Lewis, V. Torczon, and M. W. Trosset. Direct search methods: then and now. Journal of Computational and Applied Mathematics, 124(1-2):191–207, Dec. 2000. [48] A. Lim and M. Lam. Blocking and array contraction across arbitrarily nested loops using affine partitioning. In Proceedings of the Eighth ACM SIGPLAN Symposium on Principles and Practice of Parallel Programming, Snowbird, Utah, June 2001. [49] A. Lim and M. Lam. Cache optimizations with affine partitioning. In Proceedings of the Tenth SIAM Conference on Parallel Processing for Scientific Computing, Portsmouth, Virginia, Mar. 2001. [50] G. Marin and J. Mellor-Crummey. Cross architecture performance predictions for scientific applications using parameterized models. In Proceedings of the joint ACM SIGMETRICS-Performance 2004 Conference on Measurement and Modeling of Computer Systems, New York, NY, June 2004. [51] A. C. McKellar and J. E. G. Coffman. Organizing matrices and matrix operations for paged memory systems. Commun. ACM, 12(3):153–165, 1969. [52] J. Mellor-Crummey, R. Fowler, G. Marin, and N. Tallent. HPCView: A tool for top-down analysis of node performance. The Journal of Supercomputing,
170 2002. In press. Special Issue with selected papers from the Los Alamos Computer Science Institute Symposium. [53] N. Mitchell, K. H¨ogstedt, L. Carter, and J. Ferrante. Quantifying the multi-level nature of tiling interactions. International Journal of Parallel Programming, 26(5), 1998. [54] D. Monroe. Energy science with digital combustors. scidac review, Jun 2002. [55] J. A. Nelder and R. Mead. A simplex method for function minimization. The Computer Journal, 7:308–313, 1965. [56] Netlib. Software repository at university of tennssee and oakridge national laboratory. http://www.netlib.org. [57] Z. Pan and R. Eigenmann. Fast and effective orchestration of compiler optimizations for automatic performance tuning. In The 4th Annual International Symposium on Code Generation and Optimization (CGO), 2006. [58] P. R. Panda, H. Nakamura, N. D. Dutt, and A. Nicolau. Augmenting loop tiling with data alignment for improved cache performance. IEEE Trans. Comput., 48(2):142–149, 1999. [59] E. Petrank and D. Rawitz. The hardness of cache conscious data placement. In Proceedings of the Twenty-ninth Annual ACM Symposium on the Principles of Programming Languages, pages 101–112, 2002. [60] G. Pike and P. N. Hilfinger. Better tiling and array contraction for compiling scientific programs. In Proceedings of SC’02: High Performance Networking and Computing, Baltimore, MD, Nov. 2002.
171 [61] R. P. J. Pinkers, P. M. W. Knijnenburg, M. Haneda, and H. A. G. Wijshoff. Statistical selection of compiler options. In The IEEE Computer Societys 12th Annual International Symposium on Modeling, Analysis, and Simulation of Computer and Telecommunications Systems (MASCOTS’04), pages 494–501, 2004. [62] M. P¨ uschel, B. Singer, J. Xiong, J. M. F. Moura, J. Johnson, D. Padua, M. Veloso, and R. W. Johnson. SPIRAL: A generator for platform-adapted libraries of signal processing algorithms. Int’l Journal of High Performance Computing Applications, 18(1):21–45, 2004. [63] A. Qasem, G. Jin, and J. Mellor-Crummey. Improving performance with integrated program transformations. Technical Report CS-TR03-419, Dept. of Computer Science, Rice University, Oct. 2003. [64] A. Qasem, K. Kennedy, and J. Mellor-Crummey. Automatic tuning of whole applications using direct search and a performance-based transformation system. In Proceedings of the Los Alamos Computer Science Institute Second Annual Symposium, Santa Fe, NM, Oct. 2004. [65] G. Rivera and C.-W. Tseng. Data transformations for eliminating conflict misses. In SIGPLAN Conference on Programming Language Design and Implementation, pages 38–49, 1998. [66] G. Rivera and C.-W. Tseng. Locality optimizations for multi-level caches. In Supercomputing ’99: Proceedings of the 1999 ACM/IEEE conference on Supercomputing (CDROM), 1999. [67] Y. Song, R. Xu, C. Wang, and Z. Li. Data locality enhancement by memory
172 reduction. In Proceedings of the 15th ACM International Conference on Supercomputing, Sorrento, Italy, June 2001. [68] W. Spendley, G. R. Hext, and F. R. Himsworth. Sequential application of simplex designs in optimization and evolutionary operation. Technometrics, 4:441–461, 1962. [69] O. Temam, E. Granston, and W. Jalby. To copy or not to copy: A compile-time technique for assessing when data copying should be used to eliminate cache conflicts. In Proceedings of Supercomputing ’93, Portland, OR, Nov. 1993. [70] V. Torczon. Multi-Directional Search: A Direct Search Algorithm for Parallel Machines. PhD thesis, Dept. of Computer Science, Rice University, May 1989. [71] S. Triantafyllis, M. Vachharajani, N. Vachharajani, and D. August. Compiler optimization-space exploration. In Proceedings of the international symposium on Code generation and optimization: feedback-directed and runtime optimization, San Fransisco, CA, 2003. [72] X. Vera, J. Abella, J. Llosa, and A. Gonzalez. An accurate cost model for guiding data locality transformations. ACM Trans. Program. Lang. Syst., 27(5):946–987, 2005. [73] X. Vera, N. Bermudo, J. Llosa, and A. Gonzalez. A fast and accurate framework to analyze and optimize cache memory behavior. ACM Transactions on Programming Languages and Systems, 26(2), 2004. [74] X. Vera, J. Llosa, and A. Gonzalez. Near-optimal padding for removing conflict misses. In C.-W. Tseng, editor, Languages and Compilers for Parallel Computers (LCPC02). LNCS - Springer Verlag, 7 2002.
173 [75] S. Verdoolaege, M. Bruynooghe, G. Jenssens, and F. Catthoor.
Multi-
dimensional incremental loop fusion for data locality. In Proceedings of the IEEE International Conference on Application Specific Systems, Architectures, and Processors, June 2003. [76] R. Vuduc, J. Demmel, and J. Bilmes. Statistical models for empirical searchbased performance tuning. International Journal of High Performance Computing Applications, 18(1):65–94, 2004. [77] T. Waterman. Adaptive Compilation and Inlining. PhD thesis, Dept. of Computer Science, Rice University, Dec. 2005. [78] C. Whaley and J. Dongarra. Automatically tuned linear algebra software. In Proceedings of SC’98: High Performance Networking and Computing, Orlando, FL, Nov. 1998. [79] L. J. Wicker. NSSL collaborative model for atmospheric simulation (NCOMMAS). http://www.nssl.noaa.gov/~wicker/commas.html. [80] M. Wolf, D. Maydan, and D. Chen. Combining loop transformations considering caches and scheduling. In Proceedings of the 29th Annual International Symposium on MicroArchitecture, pages 274–286, 1996. [81] M. E. Wolf and M. Lam. A data locality optimizing algorithm. In Proceedings of the SIGPLAN ’91 Conference on Programming Language Design and Implementation, Toronto, Canada, June 1991. [82] M. J. Wolfe. Advanced loop interchanging. In Proceedings of the International Conference on Parallel Processing, 8 1986.
174 [83] M. J. Wolfe. Iteration space tiling for memory hierarchies. In Proceedings of the Third SIAM Conference on Parallel Processing for Scientific Computing, Dec. 1987. [84] J. Xiong, J. Johnson, R. Johnson, and D. Padua. SPL: A Language and Compiler for DSP algorithms. In Proceedings of the SIGPLAN ’01 Conference on Programming Language Design and Implementation, Snowbird, Utah, June 2001. [85] Q. Yi. Applying data copy to improve memory performance of general array computations. In Proceedings of the Eighteenth International Workshop on Languages and Compilers for Parallel Computing, Hawthorne, NY, 10 2005. [86] K. Yotov, X. Li, G. Ren, M. Cibulskis, G. DeJong, M. Garzaran, D. Padua, K. Pingali, P. Stodghill, and P. Wu. A comparison of empirical and model-driven optimization. In Proceedings of the SIGPLAN ’03 Conference on Programming Language Design and Implementation, San Diego, CA, June 2003. [87] H. You, K. Seymour, and J. Dongarra. An effective empirical search method for automatic software tuning. Technical report, University of Tennessee, Feb. 2005. [88] Y. Zhao, Q. Yi, K. Kennedy, D. Quinlan, and R. Vuduc. Parameterizing loop fusion for automated empirical tuning. Technical report, Lawrence Livermore National Laboratory, Dec. 2005.