Large-scale networks such as mobile communication net- works consist of a large number of .... mobile user, when the latter is in the state s3 â C3. However,.
Automating the Mean-Field Method for Large Dynamic Gossip Networks Rena Bakhshi∗, J¨org Endrullis∗ , Stefan Endrullis† , Wan Fokkink∗, Boudewijn Haverkort‡§ ∗ Department
of Computer Science, Vrije Universiteit Amsterdam, Amsterdam, The Netherlands † Universit¨at Leipzig, Institut f¨ ur Informatik, Leipzig, Germany ‡ Centre for Telematics & Information Technology, University of Twente, Enschede, The Netherlands § Embedded Systems Institute, Eindhoven, The Netherlands
Abstract—We investigate an abstraction method, called meanfield method, for the performance evaluation of dynamic networks with pairwise communication between nodes. It allows us to evaluate systems with very large numbers of nodes, that is, systems of a size where traditional performance evaluation methods fall short. While the mean-field analysis is well-established in epidemics and for chemical reaction systems, it is rarely used for communication networks because a mean-field model tends to abstract away the underlying topology. To represent topological information, however, we extend the mean-field analysis with the concept of classes of states. At the abstraction level of classes we define the network topology by means of connectivity between nodes. This enables us to encode physical node positions and model dynamic networks by allowing nodes to change their class membership whenever they make a local state transition. Based on these extensions, we derive and implement algorithms for automating a mean-field based performance evaluation.
I. I NTRODUCTION Large-scale networks such as mobile communication networks consist of a large number of interacting nodes. These systems are generally hard to model and analyse due to the high dynamics, since nodes are joining, and leaving the system, as well as moving around. Straightforward analytical models are too large to be handled by model checkers (e.g. [1], [2], [3], [4]). Abstracting away from details of a system can be an efficient approach to cope with the infamous state space explosion. Recently, mean-field analysis has been proposed and applied for the effective analysis of very large communication systems. It is known that such systems exhibit a deterministic behaviour in the limit (e.g., epidemics [5], [6]). That is, the stochastic process of the modelled system converges to a deterministic process if the number of participating nodes tends to infinity. This allows for an asymptotic analysis of the system. The mean-field method approximates a distribution of nodes in the set of possible states over time, for the case that there are infinitely many interacting nodes. In this paper we focus on the automation of mean-field analysis, and demonstrate how a network with pairwise communication between nodes can be modelled and analysed. For this we explore the mean-field method in two directions. (1) We introduce a notion of classes (of states) of nodes that can represent group membership or topological
information. By changing their states, we allow nodes to change their class membership. This enables us to model mobile networks, where nodes are moving around. (2) We introduce multiplicities in the state transitions such that nodes can be created and removed. This extension is important for modelling of dynamic networks with node departures and arrivals. To this end, we identify a class of stochastic systems of nodes for which the construction of the mean-field model can be automated. Using these results, we have automated the meanfield method, which allows us to model large dynamic networks. Given as user input the probabilities of communication between different classes of nodes, and an initial distribution of nodes, our new tool calculates the evolution of the system in discrete time. Apart from that, our tool allows the meanfield method to be used by a broad community, ranging from the non-expert outside of academia to the expert in mean-field theory. Our tool is suitable for the non-expert since it releases the user from the burden of the details of mean-field theory. For the expert, the tool is of interest since carrying out meanfield analysis requires the cumbersome, error-prone computation of probabilities that describe the complete behaviour of the nodes. Moreover, our tool can easily be extended to include other aspects of mean-field analysis (some of which we mention in the last section of the paper). In the next section we compare our work with similar approaches. In Sec. III, we introduce the notion of classes and the modelling framework. Sec. IV describes how the transition probability matrix can be computed based on userinput probabilities. In Sec. V-A and V-B, we illustrate the application of our tool by using it for two case studies. In Sec. VI, we formalise the generalisation of our framework to allow for modelling of dynamic networks, supported by the case study in Sec. VI-C. Due to the space limitations only the first case study analyses a real protocol, the other two case studies are simply intended to illustrate specific features of our framework. Sec. VII describes implementation details of our framework, including optimisation algorithms. Finally, Sec. VIII concludes the paper and discusses future work. II. R ELATED W ORK Mean-field theory originates from statistical mechanics (e.g., [7]), has been applied to chemical reaction systems
[8], enjoyed the attention of the neural networks community (e.g., [9]), and has recently been introduced in the area of communication networks [10], [11], [12], [13], [14], [15]. The idea of different classes of nodes for mean-field approximation emerged from [10] and the follow-up paper [11]. In these papers, a gossip-based clock synchronisation protocol has been analysed using the mean-field method. The authors specify classes of nodes with respect to communication behaviour. Moreover, nodes adapt their communication behaviour depending on their state, and by changing the state, nodes can change their class membership. The multiple classes approach has also been used by [12], [16], [17], [18]. In these works, the authors give a mean-field approximation in the form of differential equations, whereas we observe the evolution of the system in discrete time based on matrix-vector multiplication. We focus on the automation of the generalised mean-field method for dynamic gossip networks. The main advantage of our automated framework over the equation-based solutions is that our framework allows to change a format of states of nodes (a tuple) without the need to manually derive a corresponding set of equations. A mean-field related technique has been developed in [19], [20], [21], supported by a tool in [22]: an ODE-approximation for a specific class of continuous-time process algebra models (PEPA). In contrast to their approach, we employ a discretetime model. Whether to choose continuous or discrete time of course depends on the system to be modelled. Moreover, our mean-field modelling allows for time-dependent events and discrete time changes of node states and network topology, cf. Section V-B. These are crucial ingredients of communication networks, but fall outside of the capabilities of an ODE-based analysis. To the best of our knowledge, our tool is the first to automate mean-field based performance evaluation for dynamic gossip networks, an indispensable step to facilitate the mean-field analysis in the area of communication systems.
internal connectivity 0.2
B connectivity 0.01
connectivity 0.1
A
C connectivity 0.05 internal connectivity 0.4
internal connectivity 0.9 Figure 1.
An example of a clustered network.
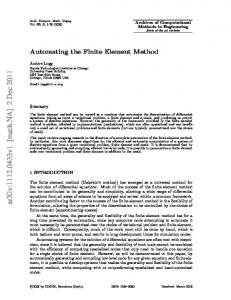
networks with a changing topology; nodes changing their local states may change their class memberships. An example topology based on three classes is shown in Figure 1. Example 1. Figure 1 depicts a network consisting of three clusters (classes) A, B and C. Each cluster in the network has a uniform link probability between any member of the cluster, and there is a specified probability of a communication between the clusters A, B and C. Namely, nodes of the cluster A interact with nodes of the cluster B with probability 0.01; however, nodes of the cluster A interact with each other with probability 0.9, and nodes of the cluster B with probability 0.2. user
user movement communication base station
user
user
base station
III. M ODELLING F RAMEWORK As setup for the subsequent sections, we describe the class of models of communication networks for which we automate the mean-field method. We consider large networks of nodes interacting in a peer-to-peer or gossip fashion. The nodes are characterised by discrete-time stochastic processes {On (τ ) | τ ∈ N, n ∈ N }, with N = {1, . . . , N }, where N is the network size, n is the node identity, and τ is the (global) discrete time. In other words, the nodes interact in a roundbased fashion. The values of On (τ ) are taken from a finite sample set Ω, called (local) state space. We classify local states s ∈ Ω of nodes into one or more different groups, called ‘classes’. A class C is a collection of states of nodes, C ⊆ Ω. The classes of nodes can represent group membership, topological information, a combination of several aspects, etc. We impose no restriction on the formation of these classes, e.g., states are permitted to be in multiple classes. We have chosen for ‘classes of local states’ over ‘classes of nodes’ since it enables the modelling of mobile
Figure 2.
An example of a small mobile network.
C1
C5 C2
C3
s1
s2
s3
communication
C4 s4 Figure 3.
Modelling mobile networks using classes of states.
Example 2. Figure 2 illustrates an example of a small mobile network. The network consists of three classes of nodes, two users and one base station. One of the users is mobile, and moves around. The base station can communicate with both
users at all times, but the communication between the users depends on the distance between them; in the lower half of Figure 2 interaction between the users directly is not possible. We encode this scenario in our framework by means of states and classes, as shown in Figure 3. For the mobile user, we distinguish two states s2 and s3 , representing its position. Two other states, s1 and s4 represent the non-mobile user and the base station, respectively. All states are divided into different classes, as shown in Figure 3. The station in class C4 communicates with both users C5 = {s1 , s2 , s3 }, irrespective of the position of the mobile user. The mobile user can undergo the state transitions s2 → s3 and s3 → s2 , that express the user movement. By moving from s2 to s3 , the mobile user changes its class from C2 to C3 , and vice versa. The stationary user in state s1 ∈ C1 cannot communicate with the mobile user, when the latter is in the state s3 ∈ C3 . However, this communication is possible if the mobile user is in state s2 ∈ C2 . We introduce the following terminology. A node is called active if it initiates a contact at the current time step, and passive, otherwise. Moreover, a node is idle if it is passive, and is not currently contacted by any node. On the contrary, a node is non-idle if it is active, or a node attempts to contact it. Definition 1. Let S be a set. We use Distr (S) to denote the distributions over P S, that is, the set of functions µ : S 7→ [0, 1] such that s∈S µ(s) = 1. Moreover, by Distr ≤1 (S) we denote the subdistributions P over S, that is, the set of functions µ : S 7→ [0, 1] such that s∈S µ(s) ≤ 1. The behaviour of the network is defined by the following four functions (specified by the user): • contacts: the network topology, • κ: state transition for successful communication, • φ: state transition for unsuccessful communication, and • ǫ: state transition for idle nodes. The function contacts defines the topology of the network. The nodes periodically interact with each other; at each time step every node picks a communication partner. The choice of the partner is governed by a probability distribution: contacts : Ω → Distr ≤1 (P6=∅ (Ω)) , which determines the probability that a certain node contacts different classes of nodes. More precisely, for any state s ∈ Ω, contacts(s) is a subdistribution µ : P6=∅ (Ω) 7→ [0, 1] meaning that a node in state s contacts with probability µ(C) a node from class C 6= ∅. Then the partner is chosen uniformly at random from all nodes that are in a state in this class C. The probability of a node in state s ∈ Ω being active is: X Pact (s) = contacts(s)(C) C⊆Ω, C6=∅
Then 1 − Pact (s) is the probability of a node in state s to be passive. We explain this distribution on the following example.
Example 3. Assume that Ω = {s1 , s2 , s3 }, and consider a network with 10 nodes in state s1 , 10 in state s2 , and 20 in state s3 . Let the contact distribution for s1 be defined as: contacts(s1 ) = {{s2 , s3 } 7→ 0.3, {s1 } 7→ 0.5} and we tacitly assume C 7→ 0 for all other classes C ⊆ Ω. This means that a node in state s1 contacts with probability 0.3 a node in state s2 or s3 (uniformly at random), with 0.5 another node in state s1 , and is idle (not initiating communication) with the remaining probability 0.2. Hence, Pact (s1 ) = 0.8. Assume that a node in state s1 decides to contact the class {s2 , s3 }. The choice of the communication partner inside this class is uniformly at random, that is, every node among the 30 nodes in state s2 or s3 has an equal probability of being picked. Since there are 10 nodes in state s2 and 20 nodes in state s3 , with probability 13 the choice will fall on a node from s2 , and with 32 on s3 . Remark. For simplicity, we will refer to “a node in state s” as “a node in s”. When a node in s (attempts to) contact a node in t, then depending on the success of the contact and the state t of the peer, both nodes stochastically change their states in a manner that depends on s and t. By moving from one state to another, the nodes may change their class membership, which can be used to encode dynamic networks. Since nodes pick their communication partner randomly, it can happen that multiple nodes choose the same partner simultaneously. Moreover, the chosen target can itself be active. In this case, the result of the interactions depends on their sequential order. In this paper, we handle the cases when a node is involved in multiple interaction attempts as collisions. That is, a node has a collision either if (a) it is contacted at least twice, or (b) it is active and contacted at least once. A communication fails whenever there is a collision either in the source or in the target. In other words, considering the pairwise communication between the nodes as a directed graph, then every isolated edge, i.e., strongly connected component with one edge, is a communication success, and edges that are not isolated amount to communication failures. Such collision models are used, for example, in the setting of wireless networks [23]. In our framework, we distinguish between the state transition of idle nodes and nodes with a collision. The function κ defines the state transition of nodes for the case of successful communication, κ : Ω × Ω → Distr (Ω × Ω). If a node in s (successfully) interacts with a node in t, then κ(s, t) defines the distribution of the next states of both nodes, that is, κ(s, t)(s′ , t′ ) is the probability of s′ and t′ being the successor states of s and t, respectively. The function ǫ describes the state transition for idle nodes, ǫ : Ω → Distr(Ω), that is, ǫ(s)(t) is the probability of an idle node in s to progress to the next state t. The function φ describes the state transition for nodes whose communication fails due to a collision, φ : Ω → Distr(Ω),
That is, if a node in s is either the source or the target of a failed communication, then φ(s)(s′ ) is the probability that the node moves to the state s′ . IV. M EAN - FIELD M ODELLING In this section, we describe the theory behind our tool, and illustrate our framework on two case studies. The format of the states of Ω, be it an integer, a tuple or another data structure, is irrelevant to the computations presented in this section. Therefore, we simply identify states by their indices (with respect to a fixed total order), i.e., {0, . . . , l − 1}, where l is the number of different states. Normally, the complete system is composed of the N nodes as a discrete-time stochastic process Z N (τ ) = (O1 (τ ), . . . , ON (τ )). The size of this state space is |Ω|N = lN . However, in case of the mean-field approximation, nodes that are in the same state are indistinguishable. Thus, we can describe the overall state at time τ with a vector ∆(τ ) = (∆0 (τ ), . . . , ∆l−1 (τ )), where an entry ∆i (τ ) is the fraction of nodes in state i. This discrete-time vector is called the occupancy measure, and the size of �the state space ΩN ∆ −1 of this “occupancy process” is l+N . That is, there are l−1 � � l+N −1 −1 = l+N ways to combine N (not necessarily N l−1 distinct) nodes in l states. The evolution of the system is then described by the local transition probabilities of each node: N M∆ (t, s) = Pr{OnN (τ + 1) = t | OnN (τ ) = s, ∆(τ ) = ∆}
That is, the next state t ∈ Ω of a node depends on its current state s ∈ Ω and on the current occupancy measure ∆. These transition probabilities form the transition probability matrix N M∆(τ ). A. Transition probabilities and matrix calculation We now describe how the state transition probability matrix N M∆(τ ) can be computed based on the user-input probabilities, presented above. In order to compute the matrix, we assume ∆(τ ) to be the current state distribution, and simply write ∆. We first compute the probability that a given node in s contacts any node in t. Recall that a node in s ∈ Ω picks a communication partner from class C ⊆ Ω with probability contacts(s)(C). It does so uniformly from the nodes that are currently in one of the states of C. For every pair of states s, t ∈ Ω and current distribution ∆, the probability that a node in s contacts a node in t is: X ∆t contact(s, t) = contacts(s)(C) · ∆C C⊆Ω, t∈C P where ∆C = u ∈ C ∆u for any set of states C ⊆ Ω. Given the current distribution ∆, the expected fraction of nodes that contact the state s ∈ Ω: X ξ(s) = ∆t · contact(t, s) t∈Ω
Example 4. Consider the occupancy measure ∆ = (∆s , ∆t ) = (0.4, 0.6). Let contact (t, s) = 0.5 and contact (s, s) = 1. Then the number of nodes to contact s
is ξ(s) = 0.6 · 0.5 + 0.4 · 1 = 0.7, that is 70% of all nodes in the network will contact nodes in s. For a node in s ∈ Ω, the probability of not being contacted equals �ξ(s)·N � 1 , (1) Pc0 (s) = 1 − N · ∆s if ∆s 6= 0, and Pc0 (s) = 0, otherwise1 . That is, ξ(s) · N is the expected number of nodes that contact s, N · ∆s is the 1 is the probability total amount of nodes in s, and 1 − N ·∆ s that nodes that contact s do not choose a given node in s. Similarly, the probability of a node in s to be contacted once equals �ξ(s)·N −1 � � � 1 1 ξ(s) · N · 1− Pc1 (s) = · N · ∆s N · ∆s 1 �ξ(s)·N −1 � ξ(s) 1 = · 1− , ∆s N · ∆s
(2)
1 if ∆s 6= 0, and Pc1 (s) = 0, otherwise1 . Here, N ·∆ is the s probability that a given node in s is contacted by nodes that contact s. Thus, Pc1 (s) expresses that only one of ξ(s) · N nodes contacts a given node in s and the remaining ξ(s)·N −1 nodes that contacted the class s did not choose the node. The probability that a node in s ∈ Ω is idle, i.e., neither initiating contact nor being contacted, is:
Pidle (s) = (1 − Pact (s)) · Pc0 (s) There are two probabilities of communication failure. Firstly, we have to take into account the active nodes that are contacted themselves and the non-active nodes that are contacted more than once. The sum of both renormalised to the non-idle nodes yields the probability that a non-idle node in s has a collision: Pact (s) · (1 − Pc0 (s)) � + (1 − Pact (s)) · (1 − Pc0 (s) − Pc1 (s)) /(1 − Pidle (s)),
PcolNonIdle (s) =
if Pidle (s) 6= 1, and PcolNonIdle (s) = 0, otherwise. Secondly, the probability that a communication with a target in s ∈ Ω failed due to a collision at the target is: Pc1 (s) · (1 − Pact (s)) · ∆s · N ξ(s) · N = 1 − Pc1 (s) · (1 − Pact (s)) · ∆s /ξ(s),
PcolInc (s) = 1 −
if ξ(s) 6= 0, and PcolInc (s) = 1, otherwise. We briefly explain the derivation of this formula. The probability of a node in s to be contacted without collision in s is Pc1 (s)·(1−Pact (s)), that is, the probability of being contacted once multiplied with the probability of being passive. Then Pc1 (s)·(1−Pact (s))·∆s ·N is the expected number of nodes in s that are contacted without collision in s. As the communication is pairwise, this number coincides with the number of nodes that contact a node in s 1 This guarantees that the probability P colInc (s), defined later, is equal to 1 for ∆s = 0, that is, contact attempts amount to collisions.
s
s′
node has a collision peer has a collision
c
The mean-field approximation captures the asymptotic behaviour of the complete system if the network size N tends to infinity. Namely, the occupancy measure ∆ for large networks converges to a deterministic limit, if the following is satisfied: for all local states s, t ∈ Ω, all ∆ ∈ ΩN ∆ and assuming the initial distribution ∆(0),
a
b
Figure 4.
B. Mean-field convergence
The three causes of communication failure.
without collision in the target. Dividing this number by the expected number of nodes contacting s, ξ(s) · N , we obtain the probability that a contact with target s does not have a collision in the target. Using these probabilities of communication failure, we can derive the probabilities of successful communication. The probability of a node in s ∈ Ω to talk to a node in t ∈ Ω, without a collision at t, is
N if N → ∞, M∆ (t, s) converges uniformly2 in ∆ to M∆ (t, s), which is a continuous function of ∆.
That is, if N tends to infinity, for each local state i the fraction ∆i (τ ) of nodes in state i at time τ converges to a deterministic limit. N This requirement is clearly satisfied for our matrix M∆ , since the dependence on the network size N vanishes in the limit for all transition probabilities. Notably, when N → ∞, (1) and (2) take their limit in forms Pc1 (s) → ξ(s)/∆s · e−ξ(s)/∆s
PtalkOkTgt (s, t) = contact (s, t) · (1 − PcolInc (t))
Pc0 (s) → e−ξ(s)/∆s ,
Then, the probability of a successful contact, i.e., there is no collision at the target nor at the source, equals
if ∆s 6= 0, and 0 otherwise.
PtalkOk (s, t) = PtalkOkTgt (s, t) · Pc0 (s). The three causes for communication failures are displayed in Figure 4: (a) a non-idle node in s has a collision, (b) a node in s′ is contacted and the source of the contact has a collision, and (c) the target in s′ of an active node has a collision. Finally, we describe the calculation of the transition probaN N bility matrix M∆ . Let M∆ (t, s) be the entry in the matrix at the crossing of the row t and the column s. For all nodes in states s, t ∈ Ω, N M∆ (t, s) = Pidle (s) · ǫ(s)(t) X PtalkOk (s, s′ ) · κ(s, s′ )(t, t′ ) +
X
PtalkOk (s′ , s) · κ(s′ , s)(t′ , t) ·
N M∆ = lim M∆ , ∆ ∈ ΩN ∆. N →∞
Define the deterministic discrete time process δ(τ + 1) = Mδ(τ ) · δ(τ ). Then for ∀τ ∈ N, lim ∆(τ ) = δ(τ ), with probability 1,
N →∞
that is, δ(τ ) is the deterministic limit occupancy measure at time τ for N → ∞. In Sect. VI, we show that the convergence theorem holds even for the more general setting of dynamic networks. V. C ASES
s′ ∈ Ω, t′ ∈ Ω
+
Theorem 1 (cf. [13]). Fix the initial occupancy measure: ∆(0) = δ(0); define the limit of the local probability matrix:
∆s′ ∆s
A. Case study on clock synchronisation (3)
The first case study illustrates that our tool can cope with large dense matrices. Moreover, it shows a non-trivial encoding + (1 − Pidle (s)) · PcolNonIdle (s) · φ(s)(t) of the states of nodes for the mean-field analysis. Using the X model of the clock synchronisation protocol GTP from [11], ′ ∆ s + (PtalkOkTgt (s′ , s) − PtalkOk (s′ , s)) · φ(s)(t) · we compare the results obtained by our tool with the results ∆s s′ ∈ Ω of the protocol emulation from [24]. X + (contact (s, s′ ) − PtalkOkTgt (s, s′ )) · Pc0 (s) · φ(s)(t) According to the protocol, the nodes are equipped with local s′ ∈ Ω clocks. At least one node (time source) has the accurate time. Note that we take ∆s′ /∆s = 0, if ∆s = 0. The matrix Nodes periodically interact with randomly chosen peers, gosconsists of the six summands that express the corresponding siping their clock samples, and update the clocks depending on probabilities of: (i) the state transition from s to t, if a node the quality of the sample, measured according to the distance in s is idle; (ii)–(iii) the state transitions after the successful to the time source on a synchronisation path. In [11], the state contact; (iv)–(vi) cover the cases (a)–(c) of interaction failure of a node is defined as a triple (g, l, h) of local parameters. depicted in Figure 4, that is, (iv) the state transition from s to The delay g defines a period of interaction of the node. The t, if node in s is non-idle and a collision occurs; (v) the state counter l defines a period of the enforced synchronisation. transition of nodes in s contacted by nodes in s′ , if a collision The hop count h shows the distance to the time source on the occurs at the source nodes in s′ ; and (vi) the state transition 2 A sequence f of real-valued functions converges uniformly with limit of active nodes in s whenever a collision occurs at the target f if for every ε >N 0 there exists n ∈ N such that for all x and all N ≥ n ′ nodes in s . we have |fN (x) − f (x)| < ε. s′ ∈ Ω, t′ ∈ Ω
hop ≤ 7
hop count (avg)
fraction of nodes
1.0 0.9 0.8 0.7 0.6 0.5 0.4 0.3 0.2 0.1 0.0
hop ≤ 6 hop ≤ 5 mean-field emulations 0
200
400
600
time Figure 5. Distribution of the hop count (mean-field results) and fraction of the synchronised nodes for the network size 1500 (emulation results) in GTP
synchronisation path, and is a metric of the sample quality. A node with h = ∞ is unsynchronised. The state space of a node is Ω = {0, . . . , Gmax } × {0, . . . , L} × {0, . . . , H, ∞} of the size |Ω| = (Gmax + 1)(L + 1)(H + 2). The occupancy measure is the fraction of nodes in state (g, l, h). For the mean-field analysis, we consider the following values of Gmax = 25, L = 25, H = 15. The initial distribution 1 1 in Figure 5 and 1500 , of the time sources ∆(12,L,0) is 1500 10 100 , in Figure 6. All other nodes are unsynchronised and 1500 1500 have remaining gossip delays uniformly distributed between 0 and Gmax . We compare our mean-field results with the experimental results from [24]. The latter results were obtained by emulating a network of 1500 nodes that execute GTP, on a single workstation. We assume one step in the GTP model to be one second in the emulations. Figures 5 and 6 show the results of two experiments: the evolution of the hop count distribution over the first 600 seconds, and the evolution of the average hop count for the different number of time sources, respectively. In Figure 5, each mean-field curve shows the fraction of nodes that have at most a certain hop count. All but one node are initially unsynchronised. By communicating to the time source, first some of the nodes obtain small hop counts. The hop count distribution then gradually increases, and finally converges towards the stable state. The local maxima in the hop count distribution before the final stable state is due to the forced update, governed by the parameter l. Nodes that have not synchronised for 25 seconds are forced to update their hop counts, if they interact with a synchronised node. Thus, as more nodes become synchronised, the forced updates become more frequent. For the small hop counts such as 1, this update leads to the increase of the hop count. For more details on the effect of the forced updates, we refer to [11]. The highest curve corresponds to the fraction of nodes with the hop count at most H = 15, that is, the fraction of synchronised nodes. The curve of the emulation results shows the fraction of nodes that are synchronised, and thus, corresponds to the mean-field curve of at most hop count 15. Figure 6 shows the average hop count for 1, 10 and 100 time sources. The respective curves for the mean-field (gray) and
Figure 6.
12 11 10 9 8 7 6 5 4 3 2 1 0
0
600 1200 1800 2400 3000 3600 4200 4800 time
Average hop count for different number of time sources in GTP
emulation (black) results settle to similar values. As one can observe, the average hop count decreases with larger number of time sources. B. Case study on mobile networks The purpose of this case study is to show how our framework can be used to encode mobility of nodes. We consider the spread of a (fictive) virus between three villages A, B and C. Every person (node) can be either healthy or infected. Additionally, every person has a parameter resistance with a value in {0, . . . , 20} (initially, 0). For infected population, the resistance to the virus is increased by 1 at every step. When it reaches the maximum value, infected people recover and remain healthy afterwards. Note that immunity is a requirement of mean-field convergence result for epidemics (cf. [6]); however, this condition is not necessary for our framework. Whenever an infected person successfully communicates with a healthy person with resistance lower than 20, the healthy person becomes infected. The connectivity among the villages is defined as follows: contacts(A) = {{A} 7→ 0.1, {B} 7→ 0.005} contacts(B) = {{B} 7→ 0.1, {A, C} 7→ 0.005} contacts(C) = {{C} 7→ 0.1, {B} 7→ 0.005} The mobility is introduced by a “ship” S that commutes inbetween the villages A and C. The ship “moves” according
Figure 7.
Commuting ship
fraction of infected nodes
0.3 village A village B village C ship S
0.2 0.1 0.0
0
10 Figure 8.
20
30
40
50 60 time
70
80
90 100
Infection spread, mean-field results.
VI. F RAMEWORK
to the parameter position, with a value in {S0 , . . . , S5 } (see Figure 7). If the ship is in position S0 or S3 , it indicates that the ship is docking at village A or C, respectively. The ship positions S1 and S5 represent the same location, but indicate the movement in opposite directions; likewise, for the positions S2 and S4 . Thus, the connectivity of the ship depends on its position. Let Sp denote a ship in position p, and define: {{A} 7→ 1}, if p = 0, contacts(Sp ) = {{C} 7→ 1}, if p = 3, { }, otherwise.
fraction of infected nodes
People that get on and off the ship are represented as follows. If a person from the ship interacts with a person from a village, then they exchange their health/infection and resistance properties. Thus we simulate that one person leaves the ship, while the communication peer enters the ship. Figure 8 shows the evolution of the infected people over time at the different classes of people. All villages have an equal number of inhabitants, and the ship can carry up to half of the size of any village. Initially, 50% of the population of village C is infected; the remaining population is healthy. For the village C, the corresponding curve starts with the highest value. Over time, the infection spreads to the next village A, since it is connected to C via the ship S. The infection spreads fast on the ship, due to its small capacity, increasing the probability of infecting people in the village A. At the same time, occasional travellers between the villages make it possible for the virus to spread onto the villages B and C. At some point, infected people with a value of resistance 20 recover from the virus. Hence, the fraction of infected people decreases and approaches zero after 90 steps. 0.3 village A village B village C ship S
0.2 0.1 0.0
0
10
20
30
40
50 60 time
70
80
Comparison with Monte-Carlo Simulations: We compare the mean-field results with Monte-Carlo simulations; Figure 9 show simulation results of the infection spread with 100 people travelling by the ship, and 200 people in each of three villages. Every line in the figure is the average of 1000 simulation runs (each 100 time steps). Note the accuracy (i.e., resemblence between Figure 8 and Figure 9) of the mean-field approximation (Figure 8) even for the system of moderate size.
90 100
Figure 9. Monte-Carlo simulations with 100 people on the ship and 200 people per village
FOR
DYNAMIC N ETWORKS
So far, the number of nodes in the network has been invariant over time. The section extends this to the dynamic creation and removal of nodes. A. Introduction and notations For this purpose, we generalise the semantics of the occupancy measure ∆. Up to now, ∆s P has been the fraction of nodes in state s, and consequently s∈Ω ∆s = 1. We relax this requirement, and henceforth interpret ∆s as the number of nodes in state s relative to the initial distribution ∆(0). We use NS to denote the multisets over S, that is, the set functions S 7→ N. Accordingly, we generalise the functions κ, ǫ and φ to include, along with probabilities, ”multiplicity”: κ : Ω × Ω → Distr (NΩ ),
(4)
such that for all states s, t ∈ Ω, the domain of κ(s, t) is finite. For every pair of communicating nodes there is only a finite number of possible outcomes. Here, the finiteness ensures the Lipschitz condition in Lemma 1 (below). If two nodes in state s and state t communicate successfully, then κ(s, t)(µ) is the probability that the communicating nodes in s and t will transform into a multiset of nodes in the states defined by µ, that is, for every state u ∈ Ω we obtain µ(u) nodes in u. Example 5. κ(s, t)({s 7→ 3, u 7→ 1}) = 0.5 means that with 50% probability a successful communication of nodes in s and t will result in 3 nodes in s, and 1 in u. Note that, for the multisets, we suppress entries with multiplicity 0, e.g., t 7→ 0. Similar to κ, we also generalise the following distributions: ǫ : Ω → Distr(NΩ ) Ω
φ : Ω → Distr(N )
(5) (6)
Again, we require that for every s ∈ Ω, the distributions ǫ(s) and φ(s) have a finite domain. Example 6. ǫ(s)(s 7→ 1, t 7→ 2) = 0.3 means that with 30% probability an idle node in s will transform into one node in s, and two nodes in t. Since the evolution of a very large system can be expressed by the equation of δ(τ ) (as described in Sec. IV-B), the expected number of states after a state transition can be obtained using the corresponding multiplicity. N We generalise the calculation of the transition matrix M∆ . The computation of contact , Pidle , PtalkOk , PcolNonIdle and PtalkOkTgt remain as described in Section IV. For all nodes in
N M∆ (t, s) = Pidle (s) ·
X
ǫ(s)(µ) · µ(t)
µ ∈ NΩ
+
X
PtalkOk (s, s′ ) ·
′
X
µ
s ∈Ω
κ(s, s′ )(µ) · µ(t)
∈ NΩ
+ (1 − Pidle (s)) · PcolNonIdle (s) ·
X
φ(s)(µ) · µ(t)
µ ∈ NΩ
+
X
s′ ∈ Ω
+
X
(PtalkOkTgt (s′ , s) − PtalkOk (s′ , s)) ·
X
µ ∈ NΩ
(contact (s, s′ ) − PtalkOkTgt (s, s′ )) · Pc0 (s) ·
s′ ∈ Ω
φ(s)(µ) · µ(t) · X
∆s′ ∆s
φ(s)(µ) · µ(t)
µ ∈ NΩ
Figure 10.
Matrix computation for dynamic networks
N states s, t ∈ Ω we compute M∆ (t, s) as shown in Figure 10. We assume ∆s′ /∆s = 0, if ∆s = 0. The crucial difference with the matrix (3) from Section IV is that along with the probabilities, we take into account the corresponding multiplicities to calculate the expected number of nodes in state t after the state transition. For example, X ǫ(s)(µ) · µ(t)
C3 note that the maximum multiplicity is bounded for all local transitions and this yields a global bound since there are only finitely many possible transitions. Hence, Theorem 1 holds for the generalised setting. That is, for the initial distribution ∆(0) = δ(0) and the limit M∆ = N lim M∆ and δ(τ +1) = Mδ(τ ) ·δ(τ ), the occupancy measure N →∞ converges towards the mean-field limit:
µ ∈ NΩ
B. Mean-field convergence revisited To ensure that Theorem 1 holds for the generalised setting, here, we show that all required conditions are valid. N Lemma 1. The following conditions hold for M∆ : N C1. For all time steps τ , M∆(τ ) is independent of the network size N in the limit. C2. The number of possible state transitions per time step is bounded. N C3. For all time steps τ , M∆(τ ) satisfies the Lipschitz condition. N Proof: Condition C1 is satisfied for M∆ , since all local state transition functions are independent of the network size N , and for the contact probabilities Pc0 (s) and Pc1 (s) the dependence vanishes in the limit, as shown in Sec. IV-B. Conditions C2 and C3 hold, since there are only finitely many pairs of states, each of which has finitely many possible transitions per time step; see (4), (5), (6) where the domain of the distribution functions is required to be finite. For condition
C. Case study on dynamic networks The current example illustrates the dynamic creation and removal of nodes. We consider the scenario inspired by the well-known Lotka-Volterra equations [25], that model a biological system. Two species, predator A and prey B, inhabit environment E. They periodically interact with each other, which results in the following population dynamics. Prey feeds from the environment, that is, contacts(B) = {{E} 7→ β}, and their population grows whenever they eat: κ(B, E) = {(α, (2, B), (1, E)), (1 − α, (1, B), (1, E))}. Predators hunt prey: contacts(A) = {{B, E} 7→ 1}; they may find prey B or nothing E. In case of a successful hunt, the population of the predators grows while the prey is eaten: κ(A, B) = {(λ, (2, A), (0, B), (1−λ, (1, A), (0, B)}. For a non-successful hunt κ(A, E) = {(1 − ν, (1, A), (1, E)), (ν, (0, A), (1, E))}, that is, the predators die naturally. Likewise, idle predators may starve to death, or a predator dies as the result of a fight (collision) between the two: ǫ(A)(A) = φ(A)(A) = (1−ν, 1). The environment stays invariant ǫ(E)(E) = φ(E)(E) = (1, 1). Likewise we define for prey: ǫ(B)(B) = φ(B)(B) = (1, 1). All other transition or contact probabilities are 0. fraction of nodes
expresses the expected number of nodes in t after an idle transition of a node in s. The second difference with the matrix (3) in Section IV is the following. For successful communication of two nodes, the function κ, defined in (4), expresses the resulting distribution without distinguishing which of the two nodes progresses to which state. This simplifies the matrix in so far that, in comparison with (3), the third summand is dropped. In Figure 10, the second summand ‘takes care’ of the whole state transition.
lim ∆(τ ) = δ(τ ), with probability 1.
N →∞
0.5 0.4 0.3 0.2 0.1 0.0
predators prey
0
200 Figure 11.
400
600
800
1000 time
Predator and Prey; mean-field results
fraction of nodes
Figure 11 shows the results of mean-field analysis using the following parameters: α = 0.04, β = 0.5, λ = 0.5, and ν = 0.05, and initial distribution ∆E = 0.8, ∆B = 0.14, and ∆A = 0.06. We can clearly see that the predator-prey system undergoes a simple harmonic motion, with the population sizes of predator and prey fluctuating. Comparison with Monte-Carlo simulations: We compare our mean-field results with Monte-Carlo simulations. Figures 12 and 13 show simulation results of the predator-prey system with 100 predators and 300 prey, and 500 predators and 1500 prey, respectively. Although the mean-field approximation is precise only for large populations, we have a surprisingly close match already for the simulation with only 100 predators. For the system with 500 predators, the match is nearly perfect and the standard deviation stays small over the whole period of 1000 steps. 0.5 0.4 0.3 0.2 0.1 0.0
predators prey
0
fraction of nodes
200
400
600
1000 time
800
Monte-Carlo simulations with 100 predators and 300 prey
predators prey
0
Figure 13.
200
400
600
800
1000 time
Monte-Carlo simulations with 500 predators and 1500 prey
probability
When dealing with simulations, there is of course always a small probability that one of the species will become extinct. The graph in Figure 14 depicts the probability that one of the species will become extinct within a period of 1000 steps in dependence of the number of predators (the number of prey is 3-times this number). To give an impression: for 100 predators the probability of extinction is 0.12, for 200, 300, and 400 predators it decreases to 0.006, 0.00028, and 0.00004, respectively. For 500 predators we did not experience a single extinction in over 25000 runs (that is, 25 · 106 time steps in total). Consequently, for 100 predators or more, the probability of extinction is fairly small. 1.0 0.8 0.6 0.4 0.2 0.0
case class Clock(hop: Int) extends Node { talk = { case b: Clock => { Array( 1 -> Clock(hop min (b.hop+1)), 1 -> b ) } } idle = () => Array(1 -> Clock(hop)) collision = idle contacts = () => Array( 0.1/MAX_HOP*hop -> all ) } val all = ContactClass( { for (h Clock(0), 0.9 -> Clock(MAX_HOP) ) } Figure 15.
A specification of a simple gossipping protocol
with 100 predators we have filtered out the runs where one of the species became extinct (approximately 12% of the runs, see Figure 14). For the graph with 500 predators no filtering was needed (we did not encounter any extinctions). VII. T OOL S UPPORT
Figure 12.
0.5 0.4 0.3 0.2 0.1 0.0
object SimpleNetDef extends NetDef { val MAX_HOP = 5
probability of extinction
0
Figure 14.
100
200
300
400
500
predators
Probability of extinction within a period of 1000 time steps
The graphs of both Figures 12 and 13 are the average of 1000 simulation runs (each 1000 time steps). For the graph
We implemented a tool allowing the user to specify a system specification with a network topology, defined by the distribution contacts and the initial distribution ∆(0), and communication behaviour in the form of the transition functions κ, ǫ, and φ. The tool then performs an automatic mean-field analysis using the algorithm, which proceeds in N two steps: (i) calculation of matrix M∆ , according to Eq. (3) or Figure 10, and finding the limit Mδ ; (ii) matrix-vector multiplications Mδ · δ, according to Theorem 1. In order to avoid inhibitions towards a new tool-dependent specification language we decided to use existing programming languages for the system specification. Users can either use Scala [26] to specify the system in a functional programming style, or, alternatively, Java. Beside the fact that users might already be familiar with these languages, there are some important advantages over tool-dependent languages. First, we have the full power of the platform-independent Scala/Java library at our disposal for writing our specification. Second, the writing process can be immensely accelerated by specialised development environments (such as Eclipse, IntelliJ). Figure 15 shows a complete specification of a simple gossipping protocol. The case class Clock defines a node type that is parametrised by a hop count ranging from 0 to 5. The hop count is updated when a node talks to another one with smaller hop count, as defined in talk. It corresponds to the transition function κ of our theoretical framework. In our specification, the hop count remains unchanged for idle nodes and in case of collisions. That is, if a node in state s is idle or has a collision, then a node will stay in s, ǫ(s)(s) = 1 and φ(s)(s) = 1. Using contacts that corresponds to the distribution contacts in our modelling, we define that a node contacts a random partner from all with probability 0.1/5 · hop. The initial distribution ∆(0) of the occupancy measure is expressed by the statement initial of the specification.
To handle specifications with a very large number of node states within a reasonable time period, we implemented different performance optimisations. For the mean-field analysis, we need a fast mapping from nodes to indices in the vector, which represents the occupancy measure. Thus, the tool determines a local state space of nodes in a first phase. From the local state space the tool extracts the range for each node parameter (e.g., hop), and derives a function, mapping states to unique IDs from the set N. For a better performance, the tool extends the original specification with this function, and recompiles the source code. As an additional optimisation, by replacing object creation with look-up tables, the tool instantiates each state only once to reduce memory consumption. Mean-field analysis is perfect for a parallel computation. Its central ingredient, matrix multiplication, can be easily distributed over multiple CPUs. Our tool supports computation on multi-core computers. We leave, however, distributed execution on a cluster of computers as future work. For the GTP case study (see Sec. V-A), the matrix is dense (contains no zeros) and has a size of 11492 × 11492. For this example, our tool needs 4.3 seconds per discrete time step (on a Core 2 Duo with 2.66GHz PC). Surprisingly, the throughput of the memory (RAM) channel turns out to be the bottleneck for parallel execution on more than two cores. However, on an 8 core machine we reached 200% speedup of the performance of 3 cores, while more cores did not yield further acceleration. In this paper so far, we presented three case studies, all supported by our tool. The source code of the tool and all experimental data are available at http://www.few.vu.nl/˜rbakhshi/alg/mean.tar.gz
VIII. C ONCLUSIONS We presented an automated mean-field method for largescale systems with pairwise communication between nodes. To model dynamic systems, we introduced the notion of classes of states in our framework, and allow nodes to move between the classes by changing their states. We reported the results of three case studies, performed by our tool; each of the case studies illustrates one aspect of our framework. Regarding the future of our tool, we will experiment with different representations of the matrix, to distribute the computations over the cluster of multiple PCs, and to extend the user-interface for more convenient input of distributions and probabilities. The mean-field framework presented in this paper can be extended as follows. First, the communication between the classes can be governed by a certain distribution, e.g., the Poisson distribution (instead of uniform distribution). In the current framework, arbitrary distributions can be approximated by assigning nodes to different classes. Second, we plan to extend the method to allow multiple communications per node. Since the result depends on the order of communications, we need to introduce a notion of schedulers or oracles. Finally, the mean-field method for discrete-time models without a notion of classes in [13], [15] allows for the incorporation of a global memory (history of the occupancy
measure). Our tool currently only supports models without memory, and the extension could be integrated in the future. R EFERENCES [1] M. Kwiatkowska, G. Norman, and D. Parker, “Analysis of a gossip protocol in PRISM,” ACM SIGMETRICS Perform. Eval. Rev., vol. 36, no. 4, pp. 17–22, 2008. [2] P. Crouzen, J. van de Pol, and A. Rensink, “Applying formal methods to gossiping networks with mCRL and GROOVE,” ACM SIGMETRICS Perform. Eval. Rev., vol. 36, no. 3, pp. 7–16, 2008. [3] R. Bakhshi and A. Fehnker, “On the impact of modelling choices for distributed information spread. a comparative study,” in Conf. on Quantitative Evaluation of SysTems. IEEE, 2009, pp. 41–50. [4] R. Bakhshi, F. Bonnet, W. Fokkink, and B. R. Haverkort, “Formal analysis techniques for gossiping protocols,” ACM SIGOPS Oper. Syst. Rev., vol. 41, no. 5, pp. 28–36, 2007. [5] R. Darling and J. Norris, “Differential equation approximations for Markov chains,” Probab. Surveys, vol. 5, pp. 37–79, 2008. [6] S. N. Ethier and T. G. Kurtz, Markov Processes: Characterization and Convergence. Wiley, 1986. [7] R. Baxter, Exactly Solved Models in Statistical Mechanics. Academic Press, 1982. [8] T. G. Kurtz, “The relationship between stochastic and deterministic models for chemical reactions,” J. Chem. Phys., vol. 57, no. 7, pp. 2976– 2978, 1972. [9] M. Opper and D. Saad, Eds., Advanced Mean Field Methods: Theory and Practice. MIT Press, 2001. [10] R. Bakhshi, L. Cloth, W. Fokkink, and B. Haverkort, “Mean-field analysis for the evaluation of gossip protocols,” ACM SIGMETRICS Perform. Eval. Rev., vol. 36, no. 3, pp. 31–39, 2008. [11] R. Bakhshi, L. Cloth, W. Fokkink, and B. R. Haverkort, “Mean-field analysis for the evaluation of gossip protocols,” in Conf. on Quantitative Evaluation of SysTems. IEEE, 2009, pp. 247–256. [12] A. Chaintreau, J.-Y. Le Boudec, and N. Ristanovic, “The age of gossip: spatial mean field regime,” in Proc. ACM Conf. on Measurement and modeling of computer systems (SIGMETRICS), 2009, pp. 109–120. [13] J.-Y. L. Boudec, D. McDonald, and J. Mundinger, “A generic mean field convergence result for systems of interacting objects,” in Conf. on Quantitative Evaluation of SysTems. IEEE, 2007, pp. 3–18. [14] A. Bobbio, M. Gribaudo, and M. Telek, “Analysis of large scale interacting systems by mean field method,” in Conf. on Quantitative Evaluation of SysTems. IEEE, 2008, pp. 215–224. [15] M. Bena¨ım and J.-Y. Le Boudec, “A class of mean field interaction models for computer and communication systems,” Perform. Eval., vol. 65, no. 11-12, pp. 823–838, 2008. [16] X. Zhang, G. Neglia, J. Kurose, and D. Towsley, “Performance modeling of epidemic routing,” Comput. Netw., vol. 51, no. 10, pp. 2867–2891, 2007. [17] E. Altman, P. Nain, and J.-C. Bermond, “Distributed Storage Management of Evolving Files in Delay Tolerant Ad Hoc Networks,” in Proc. of INFOCOM. IEEE, 2009, pp. 1431–1439. [18] N. Banerjee, M. D. Corner, D. Towsley, and B. N. Levine, “Relays, base stations, and meshes: enhancing mobile networks with infrastructure,” in Proc. ACM Conf. on Mobile computing and networking (MobiCom), 2008, pp. 81–91. [19] J. Hillston, “Fluid Flow Approximation of PEPA models,” in Conf. on Quantitative Evaluation of SysTems. IEEE, 2005, pp. 33–43. [20] F. Ciocchetta, A. Degasperi, J. Hillston, and M. Calder, “Some Investigations Concerning the CTMC and the ODE Model Derived From BioPEPA,” in Proc. Workshop on From Biology to Concurrency and Back (FBTC), ser. ENTCS, vol. 229, no. 1. Elsevier, 2009, pp. 145–163. [21] R. A. Hayden and J. T. Bradley, “A fluid analysis framework for a markovian process algebra,” Theor. Comput. Sci., 2010, article in Press. [22] A. Stefanek, R. Hayden, and J. T. Bradley, “A new tool for the performance analysis of massively parallel computer systems,” in Proc. Workshop on Quantitative Aspects of Programming Languages (QAPL), ser. EPTCS, 2010, to appear. [23] IEEE 802.11 WG, Part 11: Wireless LAN Medium Access Control (MAC) and Physical Layer (PHY) specification, IEEE, 1999. [24] K. Iwanicki, “Gossip-based dissemination of time,” Master’s thesis, Warsaw University and Vrije Universiteit Amsterdam, 2005. [25] J. Murray, Mathematical Biology. Springer, 2003, vol. I. [26] Programming language Scala, http://www.scala-lang.org/.