Hindawi Publishing Corporation Journal of Sensors Volume 2016, Article ID 5036857, 8 pages http://dx.doi.org/10.1155/2016/5036857
Research Article Autonomous Gait Event Detection with Portable Single-Camera Gait Kinematics Analysis System Cheng Yang,1 Ukadike C. Ugbolue,2,3 Andrew Kerr,3 Vladimir Stankovic,1 Lina Stankovic,1 Bruce Carse,3 Konstantinos T. Kaliarntas,4 and Philip J. Rowe3 1
Department of Electronic and Electrical Engineering, University of Strathclyde, Royal College Building, 204 George Street, Glasgow G1 1XW, UK 2 Biomechanics Laboratory, School of Science and Sport, Institute of Clinical Exercise & Health Science, University of the West of Scotland, Hamilton Campus, Almada Street, Hamilton ML30JB, UK 3 Department of Biomedical Engineering, University of Strathclyde, Wolfson Building, 106 Rottenrow, Glasgow G4 0NW, UK 4 Faculty of Health, Life & Social Sciences, School of Life Sciences, Edinburgh Napier University, Sighthill Campus, Edinburgh EH11 4BN, UK Correspondence should be addressed to Lina Stankovic;
[email protected] Received 13 July 2015; Accepted 9 December 2015 Academic Editor: Sara Casciati Copyright © 2016 Cheng Yang et al. This is an open access article distributed under the Creative Commons Attribution License, which permits unrestricted use, distribution, and reproduction in any medium, provided the original work is properly cited. Laboratory-based nonwearable motion analysis systems have significantly advanced with robust objective measurement of the limb motion, resulting in quantified, standardized, and reliable outcome measures compared with traditional, semisubjective, observational gait analysis. However, the requirement for large laboratory space and operational expertise makes these systems impractical for gait analysis at local clinics and homes. In this paper, we focus on autonomous gait event detection with our bespoke, relatively inexpensive, and portable, single-camera gait kinematics analysis system. Our proposed system includes video acquisition with camera calibration, Kalman filter + Structural-Similarity-based marker tracking, autonomous knee angle calculation, videoframe-identification-based autonomous gait event detection, and result visualization. The only operational effort required is the marker-template selection for tracking initialization, aided by an easy-to-use graphic user interface. The knee angle validation on 10 stroke patients and 5 healthy volunteers against a gold standard optical motion analysis system indicates very good agreement. The autonomous gait event detection shows high detection rates for all gait events. Experimental results demonstrate that the proposed system can automatically measure the knee angle and detect gait events with good accuracy and thus offer an alternative, cost-effective, and convenient solution for clinical gait kinematics analysis.
1. Introduction Techniques which allow for objective clinical gait analysis while being minimally intrusive to the stroke patients have dramatically advanced recently [1], resulting in quantified, standardized, and more reliable measurement of the joint kinematics [2] essential for gait analysis [3] compared with traditional, semisubjective [1], observational gait analysis [4, 5]. For example, laboratory-based nonwearable motion analysis systems [1, 6] capture three-dimensional (3D) human motion patterns by tracking markers adhered to the skin overlying anatomical landmarks of the study participant using strategically located multiple infrared cameras within
a large laboratory space and provide objective numerical and visual feedback for assessment and diagnosis. However, the expensive system modules and the requirement of significant operational expertise make these systems inconvenient to patients and health services. In this respect, further research on the development of cost-effective and portable systems has emerged. The portability of these systems would enable conducting gait analysis with adequate fidelity outside a gait laboratory, for example, at local clinics and homes. After measurements are taken, the stroke patient would send the analyzed gait parameters to physiatrists for near-real-time clinical consultation, which has the potential to facilitate the development of increasingly
2 popular telerehabilitation [7–11]. In particular, [12] proposed an automatic 2D single-camera gait kinematics analysis system. However, the requirement for a dark background and a dark suit with gloves to be worn by patients limits the flexibility of system usage; the system is validated without a gold standard on only one healthy volunteer with one walking trial. Reference [13] presented detailed gait kinematic parameters evaluation of a 2D single-camera gait analysis system (approximate cost, m700), building on [14] with Pro-Trainer motion analysis software (Sports Motion, Inc., Cardiff, CA), showing excellent agreement with a gold standard Vicon MX Giganet 6 × T40 and 6 × T160 (Vicon Motion Systems Ltd., Oxford, UK; approximate cost, m250,000) optical motion analysis system, and similar to Siliconcoach video analysis software (Siliconcoach Ltd., Dunedin, New Zealand) as used by [15, 16]. For all the above, operational expertise to manually process the measurements is a time-consuming and impractical procedure for clinical use. In our early conference work [17, 18], we proposed an alternative, inexpensive, and portable, 2D single-camera gait kinematics analysis system, including video acquisition, Kalman filter [19, 20] + Structural-Similarity- [21] based marker tracking, autonomous knee angle calculation, and result visualization. Unlike [12], there are no color restrictions on background and study participant’s clothing. Unlike ProTrainer and Siliconcoach, the system automatically tracks bullseye markers attached to the joints and calculates the knee angle, where the only operational effort required is markertemplate selection for tracking initialization, via mouse-click. The result on one healthy volunteer with 6 walking trials with Vicon, the same gold standard as used by [13], showed good general agreement. In this study, we enhance our initial single-camera system presented in conference papers [17, 18] by improving video acquisition and the analysis process. In addition, we provide a novel autonomous gait event detection method. We validate the proposed system with Vicon on knee angle using a much wider subject-group than that in [17, 18]: 15 participants including both stroke patients and healthy volunteers. We focus on identifying six gait events and knee angle, which are essential for gait analysis [3], though there are other gait parameters, such as stride length, walking speed, and joint angular velocity, that are not calculated in this study. The remainder of this paper is organized as follows. In Section 2 we give a detailed description of the proposed system configuration. In Section 3 we present the experimental results on knee angle validation against Vicon and performance evaluation of the proposed autonomous gait event detection. We discuss the performance and potential improvements of the proposed system in Section 4 and provide concluding remarks in Section 5.
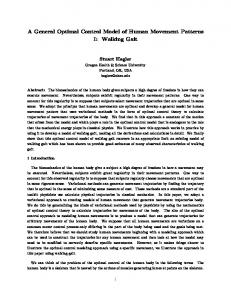
2. Method 2.1. System Overview. The system comprises a digital camera EX-FH20 EXILIM (Casio Computer Co., Ltd., Tokyo, Japan) with a tripod, 6 bullseye black-and-white paper markers [13], a black-and-white calibration checkerboard, shown in Figure 1(a), and a laptop with bespoke data processing
Journal of Sensors software and a graphic user interface (GUI) developed in MATLAB R2014b (MathWorks, Inc., Natick, MA). The goal of the system is to autonomously analyze the study participant’s gait kinematics indicated by knee angle. This is achieved by tracking three bullseye markers attached to the skin overlying the joint centers of hip, knee, and ankle of the study participant, in the sagittal plane. As shown in Figure 1(b), the system procedure includes video acquisition and camera calibration, marker tracking, autonomous knee angle calculation and gait event detection, and result visualization. In the following, we describe each of these acquisition and processing steps. 2.2. Video Acquisition and Camera Calibration. Before video recording, 6 bullseye markers are attached to the hip, knee, and ankle joint centers on both legs of a study participant in the sagittal plane. The study participants walk from left to right and back on a 6 × 0.7 m mat, as in [13]. A digital camera capturing video frames at 360 × 480-pixel resolution and 210 frames per second (fps) is mounted on a tripod with 0.5∼1.0 m in height and positioned 1.5∼3.0 m away from the long-side center of the mat. All video frames are calibrated for correction of lens distortion, using the method of [22] with a calibration checkerboard with 10 × 7 squares of size 23.3 mm each. For the gold standard Vicon system, SWIFT Cast trial [23, 24] and Plug-in-Gait [25] protocols are adopted in strokepatient and healthy-volunteer groups, respectively. In particular, for stroke patients, retroreflective markers (14 mm diameter) are fixed to the skin overlying the anatomical landmarks, as done in [24]. The knee flexion/extension axes are defined based on marker clusters at the femur and tibia and single calibration markers, followed by corresponding joint angle calculation [24]. For healthy volunteers, 15 retroreflective markers (14 mm diameter) are fixed to the skin overlying the following anatomical landmarks adapted from the Plug-inGait protocol [25], denoted as sacral wand marker, left (right) anterior superior iliac spine, knee, femur, ankle, tibia, toe, and heel markers. The joint angles are then obtained based on the Euler/Cardan angle determination algorithm with a 𝑦-𝑥-𝑧-axis rotation sequence, namely, flexion/extension, adduction/abduction, and internal/external rotation [25]. All motion-capturing instrumentation associated with Vicon MX Giganet 6 × T40 and 6 × T160 is calibrated for both groups. Each study participant is simultaneously recorded with the proposed system and Vicon. Figure 1(c) shows a sample single-camera scene for a healthy volunteer, where 4 out of the 12 Vicon infrared cameras are shown as red circles and 3 bullseye markers on the right leg of the study participant are shown as yellow circles. 2.3. Marker Tracking and Autonomous Knee Angle Calculation. We formulate the marker tracking task as automatically finding the center coordinate of each marker on the camerafacing leg independently from other markers, frame by frame. For initialization, the marker-templates for hip, knee, and ankle markers are manually selected via mouse-click in the first frame of the video shown in the “Current frame” panel
Journal of Sensors
3
Video acquisition and calibration
Marker tracking
Autonomous knee angle calculation
Autonomous gait event detection
Visualization (a)
(b)
(c)
Figure 1: (a) Calibration checkerboard. (b) System procedure. (c) Sample single-camera scene.
of the GUI in Figure 2. For each marker, first a Search Area (SA) is set in each frame, where the position and size of the SA are determined by a discrete Kalman filter [20]. Next, SSIM [21] with a full motion search scheme is performed within the SA to find the candidate block most similar to its marker-template, where the best-match candidate block has the highest similarity value among all candidate blocks within SA and is designated then as the tracked marker. Meanwhile, the center coordinate of the tracked marker is recorded for autonomous knee angle calculation. The hip marker is occasionally hidden from the camera view, that is, occluded, due to arm swing. This occlusion handling problem is addressed by heuristically setting a threshold on the similarity value; that is, the first frame, where the highest similarity value is less than the threshold, is determined as the first frame of occlusion. The SSIMbased motion search algorithm continues to process the subsequent frames until the highest similarity value is no less than the threshold; that is, the hip marker first appears after occlusion. Next, nonlinear interpolation, based on the center coordinates of the hip marker and the distances between the hip and knee markers in the last frame before occlusion and
the first frame after occlusion, is performed to estimate the center coordinates of the hip marker within the occluded frames. The marker trajectories are visualized by mapping the center coordinates of all tracked markers into a single frame, as shown in the “Marker trajectories” figure of the “Result” panel of the GUI in Figure 2. The knee angle is shown in the “Knee angle” figure of the same panel. 2.4. Autonomous Gait Event Detection. Locating the gait events in each gait cycle is essential for gait analysis [26]. To the best of our knowledge, current kinetics-based gait event detection methods rely on adequate force plate strikes [26], as done in conventional optical motion analysis systems such as Vicon, where the limited area of the force plate is impractical for gait event detection within multiple consecutive gait cycles. Similarly to kinematic-based gait event detection algorithms such as [27, 28], these methods are limited to the detection of Initial Contact (heel strike) and Terminal Contact (toe-off), that is, only two gait events/phases. In this section we discuss how we perform autonomous gait event detection which detects all six gait events/phases in
4
Journal of Sensors
Video
H:\CIMG1800.AVI
Row coordinate
Single-camera gait analysis system
Result Marker trajectories
Current frame
150 200 250 100 40
Knee angle (deg.)
Knee angle Proposed Vicon
20 0
Tracking
(Re)select
Hip
(Re)select
Knee
Start tracking Gait event detection
Benchmark Vicon
Knee angle with gait event detection Initial Contact Foot Flat Midstance Heel Raise Terminal Contact Midswing
1
1.5 2 Tracking time (s)
2.5
3
200 250 100
Ankle
Initialization Select template markers
0.5
150
Knee angle (deg.)
(Re)select
Marker trajectories with gait event detection Initial Contact Foot Flat Midstance Heel Raise Terminal Contact Midswing
Row coordinate
0 Template
400
200 300 Column coordinate
400
200 300 Column coordinate
40 20 0 0
0.5
1
1.5 2 Tracking time (s)
2.5
3
Figure 2: System user interface.
each gait cycle, including Initial Contact (IC), Foot Flat (FF), Midstance (MST), Heel Raise (HR), Terminal Contact (TC), and Midswing (MSW) [26], based on processing the marker tracking result. First, without loss of generality, we denote the row (R) and column (C) coordinates of the hip (H), knee (K), and ankle (A) markers on the camera-facing leg in Frame 𝑇 as HR𝑇 , HC𝑇 , KR𝑇 , KC𝑇 , AR𝑇 , and AC𝑇 , respectively. From experiments, we conclude that a gait event/phase can be detected based on unique relationships among these six parameters. In particular, we formulate the autonomous gait event detection task as identification of frames where the following holds: C C {A𝑇 − A𝑇−𝜆 ≥ 𝜖; IC: { max {AC𝑇 , . . . , AC𝑇+𝜆 } − min {AC𝑇 , . . . , AC𝑇+𝜆 } ≤ 3𝜖; {
MST: C C {A𝑇 − H𝑇 ≤ 2𝜖; { max {AC𝑇−𝜆 , . . . , AC𝑇+𝜆 } − min {AC𝑇−𝜆 , . . . , AC𝑇+𝜆 } ≤ 3𝜖; { R R {A𝑇 − A𝑇+𝜆 ≥ 𝜖; HR: { max {AC𝑇−𝜆 , . . . , AC𝑇 } − min {AC𝑇−𝜆 , . . . , AC𝑇 } ≤ 3𝜖; { R R {A𝑇 − A𝑇+𝜆 ≥ 𝜖; TC: { AC − AC ≥ 2𝜖; 𝑇+𝜆 { 𝑇 C C {A𝑇 − H𝑇 ≤ 5𝜖; MSW: { AC − AC ≥ 𝜖, 𝑇−𝜆 { 𝑇+𝜆 (1)
FF: C C {A𝑇 − K𝑇 ≤ 2𝜖; { max {AC𝑇−𝜆 , . . . , AC𝑇+𝜆 } − min {AC𝑇−𝜆 , . . . , AC𝑇+𝜆 } ≤ 3𝜖; {
where 𝜆 = 3 and 𝜖 = 1 in our experiments. We follow the above heuristically set rules frame by frame and visualize the autonomous gait event detection result by labeling “𝑋”
Knee angle (deg.)
Row coordinate
Journal of Sensors
5 Marker trajectories
150
200 250 50
100
150
200 250 300 350 Column coordinate
400
450
Knee angle
40 30 20 10 0 0
0.5
1
1.5 2 Tracking time (s)
2.5
3
Figure 3: Visualization of the proposed autonomous gait event detection on marker trajectories and knee angle plot with ground truth vertical-line labels in a sample right-to-left trial.
select (reselect if required, erasing the previous selection) the marker-templates of the hip, knee, and ankle markers by mouse-click in the first frame of the video shown in the “Current frame” panel. The selected marker-templates are shown in the “Template” panel. Marker tracking is launched by clicking “Start tracking” in the “Initialization” panel followed by showing the tracked marker blocks in the “Tracking” panel and result visualization in the first two figures of the “Result” panel. Autonomous gait event detection is launched by clicking “Gait event detection” in the “Initialization” panel, followed by showing the visualized result in the subsequent two figures of the “Result” panel. The “Benchmark” panel is used for knee angle validation against Vicon, showing the knee angle data from Vicon side-by-side with that from the single-camera system in the second figure of the “Result” panel.
3. Results marks on both marker trajectories and knee angle plot, with a designated color for each gait event/phase: IC: black, FF: green, MST: red, HR: blue, TC: magenta, and MSW: yellow. For evaluation, we first manually label the most representative frame for each gait event/phase by closely following [26], using a vertical-line in the knee angle plot with the same colorization scheme as for the “𝑋” marks, which is assumed as the ground truth. That is, we use handlabeled ground truth for all six gait events/phases, since again a conventional force plate approach can only detect IC and TC [26]. Then we determine if detection is valid by comparing the identified frame by the proposed system with the corresponding ground truth; that is, if the difference between the frame number of a ground truth and that of its nearest same-gait-event detection instance is less than 𝜏 = 5 frames, this detection instance, along with its neighboring same-gait-event detection instances, is designated as a single valid detection instance. Otherwise, these detection instances are designated as a single invalid detection instance. Figure 3 shows the visualized autonomous gait event detection result in a sample right-to-left walking trial. In this example, the difference between the frame number of the ground truth for the first IC, labeled as a black vertical-line, and that of its nearest same-gait-event detection, labeled as a black “𝑋” mark, is less than 5; thus this detection instance, along with its neighboring same-color detection instances, is determined as a single valid detection instance. For each one-direction trial, we sum the number of valid detection instances and ground truth labels and calculate the detection rate as the evaluation metric:
The system is validated on 15 participants, including 10 stroke patients and 5 healthy volunteers. All stroke patients were recruited between June 2011 and July 2012 from 4 UK hospitals, and all healthy volunteers were recruited from the University of Strathclyde staff during May 2014. Each participant performed two pairs of left-to-right (LtR) and RtL walking trials; each trial included at least 2 consecutive gait cycles. Thus the test dataset included 40 trials for stroke patients and 20 trials for healthy volunteers. The knee angle data is downsampled from 210 fps to 100 fps, for fair comparison with Vicon (100 fps). In this section, we show the results of the validation against Vicon and evaluation of the autonomous gait event detection.
(2)
3.1. Validation against Vicon. Since the gait kinematics abnormalities of stroke patients make marker tracking very challenging, we separately validate the results for the stroke patients and healthy volunteers. We group the measurements of all 40 trials for stroke patients (20 trials for healthy volunteers) together forming a vector 𝑈𝑥 , 𝑥 ∈ {(P)roposed, (V)icon}. We then calculate the 𝑅-squared value, max. difference, and root mean square difference between 𝑈P and 𝑈V ; we adopt a Bland-Altman plot between 𝑈P and 𝑈V and calculate the mean difference, 95% confidence interval, and a linear fit, based on the constructed BlandAltman plot shown in Figure 4. The numerical result is as shown in Table 1. The root mean square differences are smaller than 5 degrees, and the 𝑅-squared values are larger than 0.95; the result of Bland-Altman plots shows mean difference smaller than 5 degrees, narrow 95% confidence intervals that are around 10 degrees, and nearly horizontal linear fit with small intercepts, all of which indicates very good agreement.
2.5. System GUI. The system GUI provides all control options and shows the visualization result on marker trajectories, knee angles, and gait event detection, as shown in Figure 2. Via the GUI, one can choose the video to be processed and
3.2. Evaluation of the Autonomous Gait Event Detection. The proposed autonomous gait event detection method detected all six gait events/phases with high detection rates, as shown in Table 2, where the average detection rates are 88.83% and 93.27%, for stroke patients and healthy volunteers,
detection rate =
number of valid detection instances × 100%. number of ground truth labels
Journal of Sensors 6 4 2 0 −2 −4 −6 −8 −10 −10
15 Difference (deg.)
Difference (deg.)
6
0
10 20 30 40 50 60 Mean of the two measurements (deg.)
70
80
10 5 0 −5 −10
0
Zero line Linear fit
Measurement Upper 95% CI Lower 95% CI
10 20 30 40 50 Mean of the two measurements (deg.)
Measurement Upper 95% CI Lower 95% CI
(a) Stroke patients
60
70
Zero line Linear fit
(b) Healthy volunteers
Figure 4: Bland-Altman plots for knee angle validation against Vicon. CI: confidence interval. Table 1: Knee angle validation against Vicon. Metric 𝑅-squared value Max. difference (deg.) Root mean square difference (deg.) Bland-Altman plot Mean difference (deg.) 95% confidence interval Linear fit Slope Intercept
Stroke patients 0.9817 −9.3376 2.6504
Healthy volunteers 0.9711 12.2055 4.0129
−0.9348 (−5.7961, 3.9265)
3.0127 (−2.1834, 8.2088)
−0.0698 0.4113
0.0162 2.7918
Table 2: Evaluation of the proposed autonomous gait event detection. Evaluation Gait event/phase Initial Contact Foot Flat Midstance Heel Raise Terminal Contact Midswing Overall
VD 84 75 87 81 69 73 469
Stroke patients GTL 90 92 94 89 83 80 528
DR 93.33% 81.52% 92.55% 91.01% 83.13% 91.25% 88.83%
VD 53 54 52 51 48 47 305
Healthy volunteers GTL 60 56 55 52 54 50 327
DR 88.33% 96.43% 94.55% 98.08% 88.89% 94.00% 93.27%
VD: number of valid detection instances; GTL: number of ground truth labels; DR: detection rate.
respectively; the minimum detection rate is 81.52% for FF in stroke patients.
4. Discussion We stress that our system is focused on analyzing knee angle and gait events/phases, that is, gait kinematics analysis. The knee angle validation against Vicon showed high correlation. The proposed autonomous gait event detection scheme detected each gait event/phase with high detection rate by comparing with the ground truth frames, and thus the proposed gait event detection scheme can replace manual
labeling effort. In practice, one can adjust the values of 𝜆 and 𝜖 (see Section 2.4) depending on the video camera lens parameters, frame resolution, frame rate, and capturing distance, for optimal autonomous gait event detection. Given the fact that stroke patients are more likely to have transverse plane abnormalities, for example, internal rotation due to weak hip musculature or external rotation due to compensatory movements, experimental results indicate the system robustness to gait kinematics abnormalities for stroke patients and the potential for clinical gait kinematics analysis. The average system operation time is 30 minutes for each participant, including 5-minute hardware assembly, that is,
Journal of Sensors setting up the digital camera with a tripod and attaching markers to joints, 5-minute data collection, data processing, and visualization. The camera height (0.5∼1.0 m) and the video-capturing distance (1.5∼3.0 m) can be flexibly adjusted, with no requirement of large laboratory space. In practice, to make sure that the camera is perpendicular to the walkway, one can set the walkway to be parallel to the horizontal edge of the wall and then align the camera scene with natural lines parallel to the same edge. The system does not require expertise to be installed and used. Thus the system can be used at local clinics and even homes. The gait parameters based on system measurements can be sent to physiatrists for near-real-time clinical consultation, which shows the potential for telerehabilitation [7–11]. Note that the proposed system is capable of measuring segment orientations in the sagittal plane, that is, shank-to-vertical and thigh-to-vertical angles, with added bullseye markers at the femur and tibia, which has potential to assist ankle-foot orthosis fitting and tuning. The proposed marker tracking scheme is more reliable than two state-of-the-art object tracking methods [29, 30], as shown in our conference paper [18]. In contrast to [12], the proposed system is robust to various background and study participant’s clothing colors and requires much less manual effort than Pro-Trainer and Siliconcoach. Overall, the proposed system has the potential to offer stroke patients a cost-effective and portable, full gait screening tool that can be used on the ward or in the community. Note that there are two sources of difference between Vicon and the proposed system in knee angle result shown in Table 1: (i) Vicon and our system have different knee angle calculation methodologies: that is, Vicon uses SWIFT Cast trial [23, 24] and Plug-in-Gait [25] protocols with multiple retroreflective markers for knee angle measure in 3D, whereas we adopt a portable single-camera system with only three bullseye markers for knee angle measure in 2D; (ii) as expected and similar to other 2D video analysis systems such as Pro-Trainer and Siliconcoach, based on the three bullseye markers, most of our 2D measurements are different from the corresponding true 3D knee angle due to the deviation between the interest-angle plane and the camera scene plane; that is, the parallax difference is the major source of difference. To further improve the results without sacrificing portability, a 3D-capable camera, such as Microsoft Kinect [1, 31, 32], can replace the conventional digital camera so that the parallax difference can be removed. Accordingly, one can leverage the 3D information to quantify a larger number of gait parameters such as hip, knee, and ankle angles in both the sagittal and frontal planes and pelvis tilt. This is part of our ongoing study.
5. Conclusions Emerging 2D single-camera gait analysis systems have the advantage of low cost and high portability compared to laboratory-based motion analysis systems. We proposed a portable single-camera gait kinematics analysis system with autonomous knee angle measure and gait event detection functionality. The proposed system automatically tracks
7 marker and calculates the knee angle, which is in contrast to current video analysis software, such as Pro-Trainer and Siliconcoach. Experimental results showed that the proposed system can measure the knee angle and detect gait events with high accuracy, provide objective visual feedback to patients and physiatrists, and thus offer an alternative, inexpensive, and convenient solution for clinical gait kinematics analysis and novel telerehabilitation options.
Ethical Approval The authors confirm that any aspect of the study covered in this paper that has involved stroke patients has been conducted with ethical approval of both the National Health Service (NHS) and University of Strathclyde and healthy volunteers with the ethical approval of the University of Strathclyde.
Consent All participants, including 10 stroke patients and 5 healthy volunteers, read the participant information sheets and completed the consent forms before data collection.
Disclosure This paper was presented in part at ISB-2013 [17] and IEEE ICIP-2013 [18].
Conflict of Interests The authors declare that there is no conflict of interests regarding the publication of this paper.
Acknowledgment The authors would like to greatly appreciate the effort of all recruited study participants.
References [1] A. Muro-de-la-Herran, B. Garc´ıa-Zapirain, and A. M´endezZorrilla, “Gait analysis methods: an overview of wearable and non-wearable systems, highlighting clinical applications,” Sensors, vol. 14, no. 2, pp. 3362–3394, 2014. [2] P. Langhorne, F. Coupar, and A. Pollock, “Motor recovery after stroke: a systematic review,” The Lancet Neurology, vol. 8, no. 8, pp. 741–754, 2009. [3] R. Baker, “Gait analysis methods in rehabilitation,” Journal of NeuroEngineering and Rehabilitation, vol. 3, article 4, 2006. [4] B. Toro, C. Nester, and P. Farren, “A review of observational gait assessment in clinical practice,” Physiotherapy Theory and Practice, vol. 19, no. 3, pp. 137–149, 2003. [5] F. Ferrarello, V. A. M. Bianchi, M. Baccini et al., “Tools for observational gait analysis in patients with stroke: a systematic review,” Physical Therapy, vol. 93, no. 12, pp. 1673–1685, 2013. [6] J. G. Richards, “The measurement of human motion: a comparison of commercially available systems,” Human Movement Science, vol. 18, no. 5, pp. 589–602, 1999.
8 [7] T. Johansson and C. Wild, “Telerehabilitation in stroke care—a systematic review,” Journal of Telemedicine and Telecare, vol. 17, no. 1, pp. 1–6, 2011. [8] K. E. Laver, D. Schoene, M. Crotty, S. George, N. A. Lannin, and C. Sherrington, “Telerehabilitation services for stroke,” The Cochrane Database of Systematic Reviews, vol. 12, Article ID CD010255, 2013. [9] D. Theodoros and T. Russell, “Telerehabilitation: current perspectives,” Studies in Health Technology and Informatics, vol. 131, pp. 191–209, 2008. [10] D. M. Brennan, S. Mawson, and S. Brownsell, “Telerehabilitation: enabling the remote delivery of healthcare, rehabilitation,” Studies in Health Technology and Informatics, vol. 145, pp. 231– 248, 2009. [11] P. Gregory, J. Alexander, and J. Satinsky, “Clinical telerehabilitation: applications for physiatrists,” PM&R, vol. 3, no. 7, pp. 647–656, 2011. [12] P. Soda, A. Carta, D. Formica, and E. Guglielmelli, “A lowcost video-based tool for clinical gait analysis,” in Proceedings of the Annual International Conference of the IEEE Engineering in Medicine and Biology Society (EMBC ’09), pp. 3979–3982, Minneapolis, Minn, USA, September 2009. [13] U. C. Ugbolue, E. Papi, K. T. Kaliarntas et al., “The evaluation of an inexpensive, 2D, video based gait assessment system for clinical use,” Gait & Posture, vol. 38, no. 3, pp. 483–489, 2013. [14] J. C. Wall, J. Devlin, R. Khirchof, and B. Lackey, “Measurement of step widths and step lengths: a comparison of measurements made directly from a grid with those made from a video recording,” Journal of Orthopaedic & Sports Physical Therapy, vol. 30, no. 7, pp. 410–417, 2000. [15] D. A. McDonald, J. Q. Delgadillo, M. Fredericson, J. McConnell, M. Hodgins, and T. F. Besier, “Reliability and accuracy of a video analysis protocol to assess core ability,” PM&R, vol. 3, no. 3, pp. 204–211, 2011. [16] S. Richardson, A. Cooper, G. Alghamdi, M. Alghamdi, and A. Altowaijri, “Assessing knee hyperextension in patients after stroke: comparing clinical observation and Siliconcoach software,” International Journal of Therapy and Rehabilitation, vol. 19, no. 3, pp. 163–168, 2012. [17] C. Yang, U. C. Ugbolue, B. Carse, V. Stankovic, L. Stankovic, and P. J. Rowe, “Multiple marker tracking in a single-camera system for gait analysis,” in Proceedings of the Congress of the International Society of Biomechanics, Natal, Brazil, 2013, https:// isbweb.org/images/conferences/isb-congresses/2013/oral/bglmat.05.pdf. [18] C. Yang, U. Ugbolue, B. Carse, V. Stankovic, L. Stankovic, and P. Rowe, “Multiple marker tracking in a single-camera system for gait analysis,” in Proceedings of the IEEE International Conference on Image Processing (ICIP ’13), pp. 3128–3131, Melbourne, Australia, September 2013. [19] R. E. Kalman, “A new approach to linear filtering and prediction problems,” Journal of Basic Engineering, vol. 82, no. 1, pp. 35–45, 1960. [20] G. Welch and G. Bishop, “An introduction to the Kalman filter,” Tech. Rep., University of North Carolina at Chapel Hill, Chapel Hill, NC, USA, 1995, https://www.cs.unc.edu/∼welch/media/ pdf/kalman intro.pdf. [21] Z. Wang, A. C. Bovik, H. R. Sheikh, and E. P. Simoncelli, “Image quality assessment: from error visibility to structural similarity,” IEEE Transactions on Image Processing, vol. 13, no. 4, pp. 600– 612, 2004.
Journal of Sensors [22] Z. Zhang, “A flexible new technique for camera calibration,” IEEE Transactions on Pattern Analysis and Machine Intelligence, vol. 22, no. 11, pp. 1330–1334, 2000. [23] V. M. Pomeroy, P. Rowe, J.-C. Baron et al., “The SWIFT Cast trial protocol: a randomized controlled evaluation of the efficacy of an ankle-foot cast on walking recovery early after stroke and the neural-biomechanical correlates of response,” International Journal of Stroke, vol. 7, no. 1, pp. 86–93, 2012. [24] E. Papi, U. C. Ugbolue, S. Solomonidis, and P. J. Rowe, “Comparative study of a newly cluster based method for gait analysis and plug-in gait protocol,” Gait & Posture, vol. 39, supplement 1, pp. S9–S10, 2014. ˜ [25] R. B. Davis III, S. Ounpuu, D. Tyburski, and J. R. Gage, “A gait analysis data collection and reduction technique,” Human Movement Science, vol. 10, no. 5, pp. 575–587, 1991. [26] D. C. Kerrigan, M. Schaufele, and M. N. Wen, “Gait analysis,” in Rehabilitation Medicine: Principles and Practice, J. A. Delisa and B. M. Gans, Eds., pp. 167–187, Lippincott-Raven, Philadelphia, Pa, USA, 1998. [27] C. M. O’Connor, S. K. Thorpe, M. J. O’Malley, and C. L. Vaughan, “Automatic detection of gait events using kinematic data,” Gait & Posture, vol. 25, no. 3, pp. 469–474, 2007. [28] J. A. Zeni Jr., J. G. Richards, and J. S. Higginson, “Two simple methods for determining gait events during treadmill and overground walking using kinematic data,” Gait & Posture, vol. 27, no. 4, pp. 710–714, 2008. [29] J. Ning, L. Zhang, D. Zhang, and C. Wu, “Robust object tracking using joint color-texture histogram,” International Journal of Pattern Recognition and Artificial Intelligence, vol. 23, no. 7, pp. 1245–1263, 2009. [30] Z. Kalal, K. Mikolajczyk, and J. Matas, “Tracking-learningdetection,” IEEE Transactions on Pattern Analysis and Machine Intelligence, vol. 34, no. 7, pp. 1409–1422, 2012. [31] H. M. Hondori and M. Khademi, “A review on technical and clinical impact of microsoft kinect on physical therapy and rehabilitation,” Journal of Medical Engineering, vol. 2014, Article ID 846514, 16 pages, 2014. [32] R. A. Clark, S. Vernon, B. F. Mentiplay et al., “Instrumenting gait assessment using the kinect in people living with stroke: reliability and association with balance tests,” Journal of NeuroEngineering and Rehabilitation, vol. 12, article 15, 2015.
International Journal of
Rotating Machinery
Engineering Journal of
Hindawi Publishing Corporation http://www.hindawi.com
Volume 2014
The Scientific World Journal Hindawi Publishing Corporation http://www.hindawi.com
Volume 2014
International Journal of
Distributed Sensor Networks
Journal of
Sensors Hindawi Publishing Corporation http://www.hindawi.com
Volume 2014
Hindawi Publishing Corporation http://www.hindawi.com
Volume 2014
Hindawi Publishing Corporation http://www.hindawi.com
Volume 2014
Journal of
Control Science and Engineering
Advances in
Civil Engineering Hindawi Publishing Corporation http://www.hindawi.com
Hindawi Publishing Corporation http://www.hindawi.com
Volume 2014
Volume 2014
Submit your manuscripts at http://www.hindawi.com Journal of
Journal of
Electrical and Computer Engineering
Robotics Hindawi Publishing Corporation http://www.hindawi.com
Hindawi Publishing Corporation http://www.hindawi.com
Volume 2014
Volume 2014
VLSI Design Advances in OptoElectronics
International Journal of
Navigation and Observation Hindawi Publishing Corporation http://www.hindawi.com
Volume 2014
Hindawi Publishing Corporation http://www.hindawi.com
Hindawi Publishing Corporation http://www.hindawi.com
Chemical Engineering Hindawi Publishing Corporation http://www.hindawi.com
Volume 2014
Volume 2014
Active and Passive Electronic Components
Antennas and Propagation Hindawi Publishing Corporation http://www.hindawi.com
Aerospace Engineering
Hindawi Publishing Corporation http://www.hindawi.com
Volume 2014
Hindawi Publishing Corporation http://www.hindawi.com
Volume 2014
Volume 2014
International Journal of
International Journal of
International Journal of
Modelling & Simulation in Engineering
Volume 2014
Hindawi Publishing Corporation http://www.hindawi.com
Volume 2014
Shock and Vibration Hindawi Publishing Corporation http://www.hindawi.com
Volume 2014
Advances in
Acoustics and Vibration Hindawi Publishing Corporation http://www.hindawi.com
Volume 2014