AGARD-CP-541
AGARD ADVISORY GROUP FOR AEROSPACE RESEARCH & DEVELOPMENT 7 RUE ANCELLE 92200 NEUILLY SUR SEINE FRANCE
SLECTE
.•JUN, 2,7,419951
B
AGARD CONFERENCE PROCEEDINGS 541
Virtual Interfaces: Research and Applications (Les Interfaces Virtuelles entre Recherche et Applications)
-•rIMoUrirN S-Trrafa-z
Paperspresented at the Aerospace Medical Panel Symposium held in Lisbon, Portugal,18th-22nd October 1993.
/F
w
-
NORTH ATLANTIC TREATY ORGANIZATION
19950626 015 Published May 1994 Distributionand Availability on Back Cover
The Mission of AGARD
According to its Charter, the mission of AGARD is to bring together the leading personalities of the NATO nations in the fields of science and technology relating to aerospace for the following purposes: - Recommending effective ways for the member nations to use their research and development capabilities for the common benefit of the NATO community; -
Providing scientific and technical advice and assistance to the Military Committee in the field of aerospace research and development (with particular regard to its military application);
- Continuously stimulating advances in the aerospace sciences relevant to strengthening the common defence posture; - Improving the co-operation among member nations in aerospace research and development; - Exchange of scientific and technical information; - Providing assistance to member nations for the purpose of increasing their scientific and technical potential; - Rendering scientific and technical assistance, as requested, to other NATO bodies and to member nations in connection with research and development problems in the aerospace field. The highest authority within AGARD is the National Delegates Board consisting of officially appointed senior representatives from each member nation. The mission of AGARD is carried out through the Panels which are composed of experts appointed by the National Delegates, the Consultant and Exchange Programme and the Aerospace Applications Studies Programme. The results of AGARD work are reported to the member nations and the NATO Authorities through the AGARD series of publications of which this is one. Participation in AGARD activities is by invitation only and is normally limited to citizens of the NATO nations.
The content of this publication has been reproduced directly from material supplied by AGARD or the authors.
Tor
Published May 1994
Jý]Alt i•
Sv i Dist
,, Y
0od81
Copyright © AGARD 1994 All Rights Reserved ISBN 92-835-0746-0
Printedby Specialised PrintingServices Limited 40 Chigwell Lane, Loughton, Essex IGIO 3TZ
Preface
The overall effectiveness of aerospace systems can be greatly improved by more efficient use of human performance and human decision making. Most aerospace systems that involve a human and a responsive machine appear limited by the design of the interface between them. These interfaces support the human's situational awareness and provide interpreted command and control for mechanistic implementation. Recent advances in technologies for information display and sensing of human movements, combined with computer based models of natural and artificial environments, have led to the introduction of so-called virtual interfaces. Virtual interfaces offer increased flexibility and naturalness, so are considered for use in several domains including aviation, training, design, simulation and robotics. Papers presented at this symposium considered issues of research and application in virtual interfaces broadly defined. Issues of technology integration for system development were considered separately from issues of movement monitoring or sensory display. Issues of human performance measurement were presented in the context of both research and application. A description of systems in engineering development for cockpit and for telesurgery was also presented.
Preface
L'efficacit6 globale des syst~mes a~rospatiaux peut &re consid6rablement am~lior6e par l'exploitation plus judicieuse des performances humaines et l'emploi effectif de la prise de d6cision humaine. La plupart des syst&mes a6rospatiaux qui mettent en pr6sence un 6tre humain et une machine interactive semblent 8tre limitds par le type d'interface qui les r6unit. Ces interfaces renforcent la perception de la situation par l'op6rateur humain et fournissent des 6l6ments interpr6tds de commandement et de contr6le pour application m6canique. Les progr~s r6alis6s r6cemment dans le domaine des technologies de l'affichage des donndes et de la d6tection des mouvements humains, alli6s aux mod6les informatis6s des milieux naturels et artificiels, ont conduit A la mise el pltace d'interfaces dites virtuelles. Les interfaces virtuelles offrent plus de souplesse et de naturel et elles sont donc envisag6es pour les domaines tels que l'aviation, la formation, la conception et la robotique. Les communications pr6sent6es lors de cc symposium examinaient certains sujets de recherche et de leurs applications dans le domaine des interfaces virtuelles dans le sens large du terme. Les questions concernant l'int6gration des technologies aux fins du d6veloppement des syst~mes ont 6t6 consid6r6es s6par6ment des questions de suivi des mouvements ou de l'affichage sensoriel. Les questions concernant l'6valuation des performances humaines ont 6tW pr6sent6es dans le double contexte de la recherche et des applications. Une description des syst6mes destin6s A l'habitacle et A la t~l6chirurgie et actuellement au stade de d6veloppement de l'ing6nierie a 6galement W fournie.
iii
Aerospace Medical Panel Chairman:
Prof. Dr Med. L. Vogt Institut fOr Flugmedizin DLR Postfach 90 60 58 Linder Hbhe D-51147 Kb1n 90 Germany
Deputy Chairman:
Colonel P. Vandenbosch VSM Director Aeromedical Services BAF Kwartier Koning Albert I er Raketstraat 70 B-1 130 Brussels Belgium
TECHNICAL PROGRAMME COMMITTEE Dr J.F. Tangney (Chairman) AFOSR!NL 110 Duncan Ave.- Suite B1 15 Boiling AFB DC 20332-0001 United States
Dr S. Hart Chief, Rotorcraft Human Factors NASA Ames Research Center Moffett Field CA 94035 United States
Dr K.R. Boff AL/CFH Bldg 248 - 2255 H. Street Wright-Patterson AFB OH 45433-7022 United States
Dr A. L6ger Sextant Avionique Rue Toussaint Castros BP 91 33166 Saint M~dard en Jalles France
Ms J. Davies British Aerospace Defence Ltd Military Aircraft Division Farnborough Aerospace Centre PO Box 87 Farnborough Hants GU14 6YU United Kingdom
Dr J. Smit Head, Research and Development National Aerospace Medical Center Kampweg 3 - PO Box 22 3769 ZG Soesterberg The Netherlands
Local Coordinator Major N.P. Ribeiro Base do Lumiar Centro de Medica Aeronautica 1600 Lisbon Portugal
Host Nation Coordinator Col. A. Entrudo Director - Direccao de Saude Forca Aerea Portugesa Av. Leite de Vasconcelos Alfragide - Amadora Portugal
PANEL EXECUTIVE Major R. Poisson, CAF Mail from Europe: AGARD-OTAN Attn: AMP Executive 7, rue Ancelle 92200 Neuilly-sur-Seine France
Mail from USA and Canada: AGARD-NATO Attn: AMP Executive PSC 116 APO AE 09777
Tel: 33(1) 47 38 57 60 Telex: 610176 (France) Telefax: 33 (1) 47 38 57 99 iv
Contents
Page Preface/Preface
iii
Aerospace Medical Panel and Technical Programme Committee
iv Reference
T
Technical Evaluation Report by J.F. Tangney
Keynote Address - A Research Agenda for Virtual Environments
K
by R.S. Kalawsky
SESSION I - SYSTEM INTEGRATION 1 Task-Specific Usability Requirements for Virtual Information Environments: Interface Design and Data Representation for Human Operators of Complex Medical Systems
1
by M.S. Nilan
Profile Analysis of After-Effects Experienced during Exposure to Several Virtual Reality Environments
2
by R.S. Kennedy, M.B. Jones, M.G. Lilienthal and D.L. Harm
On the Feasibility of Virtual Environments in Medicine
3
by A.C.M. Dumay and G.J. Jense
Interfaces Vocales pour les Systýmes Op~rationnels
4
par F. Marque, T. Labairrre et F. Neel
SESSION 11 - SYSTEM INTEGRATION 2 Le Grand Ecran Interactif: Un Outil de Dialogue Multimodal pour les Futures Cabines de Pilotage
5
par B. Barbier, E. Filliatre et I. Irigaray
Immersive Virtual Environments as Trainer: System Design from a Cognitive Stance
6
by M. Wierda, P.C. van Wolffelaar and W. van Winsum
Creation of a Virtual World to Study Human Spatial Perception during Sustained Acceleration
7
by T.L. Chelette, R.L. Esken and E.J. Martin
The DRA Virtual Cockpit Research Programme
8
by J.Ineson
Virtual Reality Evolution or Revolution by C. Grimsdale
9
Reference SESSION III - SENSORY TECHNOLOGY PLUS EVALUATION Manual Tracking Performance using a Virtual Hand Controller: A Comparison Study
10
by R.G. Eggleston, W.P. Janson and S. Adapalli
A Non-Intrusive Way to Measure Point of Gaze
11
by G.D.R. Zon, H.A. Mooij and J. Bouwens
Operator Gaze Position Control Interfaces: Investigation of Psychophysical and Operational Parameters
12
by D.M. Stampe, E.M. Reingold and J.J. Grodski
Orientation du Regard sous Facteur de Charge - Aspects M6thodologiques - R~sultats Pr~liminaires
13
(Gaze Orientation under Gz load - Methodological Aspects - Preliminary Results) par P.B. Sandor, I. Hortolland, F. Poux et A. LUger
A Comparison of Two Examples of Magnetic Tracker Systems by M. Williams
14
SESSION IV - HUMAN PERFORMANCE ISSUES Attenuating the Disorienting Effects of Head Movement during Whole-Body Rotation using a Visual Reference: Further Tests of a Predictive Hypothesis
15
by B.D. Lawson, F.E. Guedry, A.R. Rupert and A.M. Anderson
Some Side-Effects of Immersion Virtual Reality
16
by E.C. Regan
Visual Accommodation to Virtual Image Displays when Knowledge of Object Distance Conflicts with Optical Distance
17
by J.C. Kotulak, S.E. Morse and R.W. Wiley
Low Cost Software-Based Rendering and Stereoscopic Interfaces for Teleoperation and Virtual Reality
18
by D.M. Stampe and J.J. Grodski
Approche Exp6rimentale du Son 3D: M~thodologie et R~sultats Pr~liminaires
19
par L. Pellieux et autres
The Use of a Tactile Interface to Convey Position and Motion Perceptions by A.H. Rupert, F.E. Guedry and M.F. Reschke
Vi
20
T-1
TECHNICAL EVALUATION REPORT by John F. Tangney, Ph.D. Air Force Office of Scientific Research Washington DC US!A 20332-0001
1.
INTRODUCTION
The Aerospace Medical Panel held a Symposium on "Virtual Interfaces: Research and Applications" at facilities of the Portugese Air Force located in Lisbon, Portugal, 18-22 October 1993. Twenty papers were presented along with an invited address and three videotaped demonstrations of interface technologies, and some round table discussion of major issues for research and development. Papers represented contributions by five NATO countries, with ninety registrants in attendance representing twelve NATO countries, 2.
THEME
At the 72nd Business Meeting of the Aerospace Medical Panel, held October 1991 in Rome Italy, approval was obtained for a symposium to present the current state of research and development in synthetic interfaces with the goal of informing system designers who might be considering the use of such interfaces in aerospace environments,
goal of the planned symposium to consider virtual interfaces in aerospace application domains. 3.
PURPOSE AND SCOPE
The interface between humans and machines is changing dramatically in aerospace occupations with the introduction of new sensing technologies that permit continuous monitoring of human movements, and new display technologies that can provide substitutes for the normal experiences of vision, hearing, touch and other senses. When used in combination, these technologies can be used to create a "virtual interface" for human operators through the closed loop computerized control of their sensory experience.
Discussion of this topic at previous Business Meetings revealed a broad interest in the topic of virtual interfaces, but too few sustained efforts in research or development across the NATO countries to support lengthy consideration of the lessons learned or the research findings that might be used to inform efforts of other member countries.
Effective implementation of virtual interfaces presents a number of challenges to basic and applied research scientists. System designers must select components from a varied assortment of hardware and software for each job implemented. The specifications for these components can vary widely. Human factors scientists must specify the costs and benefits, in terms of human performance, of using these technologies for specific work environments and must adapt these technologies to different tasks. Basic researchers are challenged to develop more complex models of human performance that can be used to constrain the design process.
By fall of 1991, however, efforts using virtual interfaces were underway in several NATO countries. It also became increasingly clear that the multi-disciplinary nature of the research and the number of options possible for implementing any interface design were sufficiently large that a symposium for reports of progress would benefit all. A greater degree of coupling between these efforts then became a secondary
Papers were solicited on three broad topics of virtual interface: (1) the sensing of human movement and posture, (2) the display of information to human operators, and (3) the issues of system integration. Submitted papers were reviewed by the technical program committee, as approved by the Aerospace Medical Panel, consisting of Dr. K. Boff (US), Dr. J. Davies (UK), Dr. S. Hart (US), Dr. A.
Technical EvaluationReport on Aerospace Medical Panel Symposium on 'Virtual Interfaces: Research and Applications', October 1993.
T-2
This Leger (FR), and Dr J. Smit (NE). committee was assisted by a NATO-provided advisor, Dr N. Durlach (US). 4.
SYMPOSIUM PROGRAM
The symposium included a keynote address on the research agenda for virtual interfaces delivered by Professor Kalawsky of the UK, and four technical sessions: (1) System Integration I, chaired by Dr. J. Davies (UK); (2) System Integration II, chaired by Dr. J. Smit (NE); (3) Sensory Technology plus Evaluation, chaired by Dr. A. Leger (FR) and LCdr D. Dolgin (US); and (4) Human Performance Issues, chaired by LCol S. Porcu (IT)and Dr. K. Boff (US). Video-taped demonstrations were also shown, on the use of virtual interfaces for telesurgery, architectural design, and telerobotics. A general discussion capped the meeting in an attempt to reach consensus on conclusions and recommendations. 5.
TECHNICAL EVALUATION
In his keynote address, Professor Kalawsky surveyed the domain of virtual interfaces, including issues of definition, application, research, and business decisions affecting progress in the field. He proposed adopting a three part definition that includes computerbased models of an environment (autonomy) combined with an ability for human interaction (interaction) done in a way that supports natural modes of human interaction (presence). In this survey of application domains and research issues, he noted the relative maturity of visual display devices (for example) compared to other interface technologies of tactile displays or haptic sensing (for example). He concluded by emphasizing the need for truly collaborative multidisciplinary work at a system level to afford progress in the field. 5.1
System Integration 1
This session included descriptions of systems for training, medicine and general graphical user interfaces. A broad overview of interface design was provided by Nilan (paper #1), emphasizing an efficiency criterion to distinguish the value of one
Without interface design from another. mentioning specific ways that efficiency of two or more designs might be measured and compared, Nilan pointed to examples where guidlines for design were extracted from social psychological research and cognitive research to greatly improve the speed and accuracy of performance using the redesigned interfaces. Such general guidlines can be applied in different task domains by extensive first use of user surveys, for example. The paper describes one example involving the redesign of a graphical user interface that more naturally matches information requirements to operator inputs needed to gather the information. The Kennedy (paper #2) report on motion sickness is reported later in the section on Human Performance. Medical applications for virtual environments were surveyed by Dumay and Jense (paper #3), who presented a taxonomy of application domains (including medical education, training, surgery and radiology) that might take advantage of virtual interfaces. While generally optimistic about the potential for virtual systems, Dumay mentioned a current lack of commercial availability and suggested that this may be due, in part, to a lack of high precision devices for display (visual, tactile, and force feedback) and suitable models of medical objects. A system for training air traffic controllers was described in a paper by Marque and colleagues (paper #4). The system is not fully virtual, but relies extensively on voice recognition and artificial speech, combined with some expert systems, to replace the human teacher in a simulation environment. Performance of the speech recognition system is described in some detail, and provides an example of the ways that multi-sensory processing might be used to add value to existing training regimes. 5.2 System Integration 2 The combined use of multi-sensory virtual interface for pilots was described by Barbier and colleagues (paper #5), in an effort to increase the naturalness of the human machine interface by including vision, speech and gestural devices in a single system. Several experiments were described using the system in which the speed
T-3
execution was of decision-making or response measured for each of several interface design options. Novel approaches to system design were outlined by Wierda and colleagues (paper #6) and described in the context of a virtual trainer for vehicular control (driving). An approach based on cognitive engineering can intuitively be shown to provide a means for separating the design goals of a system from the implementation strategies for meeting those goals. For example, a complete model of the decision making during vehicular control could be used to automate certain portions through systems of expert aiding or through improvements to the human interface, An apparatus for measuring human performance under acceleration was described by Chelette and colleagues (paper #7) and used to assess the magnitude of the G-excess illusion under conditions of several constant G(z) loads and static head yaws. The apparatus, implemented on a centrifuge, includes helmet mounted virtual visual displays, combined head tracking, and a device for recording hand position to indicate perceived spatial attitude. The device permits experimental manipulation of the coupling between visual and vestibular inputs to human operators. Primary results concern the sensitivity of illusory tilt (pitch and roll) to head position under G-load. A prototype and testbed for a virtual cockpit was described by Ineson (paper #8), with emphasis on the implementing hardware and the display formats for primary flight control. The system features selectible display options (e.g. visual stereo, variable terrain features) and establishes an apparatus for assessment of primary design options and human factors issues in virtual flight control. One interesting human factor issue concerns the possible confusion of head and aircraft attitude change (given some transport delay in visual image generation). A product for high-realism in virtual visual displays was presented by Grimsdale (paper #9) with integrated hardware and software that support near real-time updates of realistically rendered complex objects (such as an automobile imaged with glints, reflections, shadows and texturing).
5.3 Sensory Technology plus Evaluation Performance with a novel virtual hand controller was compared with a standard joy-stick controller in a preliminary report of experiments by Eggleston (paper #10). Primary findings concern rough equivalence between controllers in a task of single axis continuous tracking. Methodological issues were also raised concerning techniques of comparing devices whose parametric descriptions may not be valid (in this case, in terms of underlying kinematics). A device for measuring point of gaze was used in an experiment reported by Zon and colleagues (paper #11) to assess the increased accuracy in reporting visual detail as dwell time of fixations increase. The device incorporates an infrared camera for tracking eye position (with respect to head) using the bright pupil method, and a six degree of freedom head tracking module. Calibration of the device and its specifications are described together with the data mentioned earlier. A second device for measuring point of gaze was reported by Stampe (paper #12) and used to demonstrate how calibrative functions could be performed continuously and adaptively in environments where the positions of some targets for eye-movements are known. Human factors issues of keyboard type visual displays were also discussed in the context of matched resolution both spatial (between precision of eye position measures and spacing of targets) and temporal (the optimal fixation dwell time to indicate selection of the target rather than search). Experiments demonstrate that, as an input device, visual selection could provide bandwidth sufficient for several special purposes. A device for head and eye position monitoring, installed in a centrifuge, was described by Sandor and colleagues (paper # 13). Eye movements were recorded using a corneal reflex technique, with head movements recorded by tracking helmet mounted infrared emitters. This technique does not use magnetic field sensing and so is well suited to the environment of a centrifuge. Preliminary results are reported in the tracking of continuous and saltatory visual
T-4
targets with combined head and eye movements under (up to) 6 G(z). Extensive data were reported on the relative performance of two commercially available position sensing devices by Williams (paper #14). Measured factors include stability, noise, cross-talk, linearity, and distortion caused by metallic interference. Some detailed discussion of the devices was presented together with a description of the evaluation scheme. Differences are reported that would affect the selection of one device over another for different operating environments or different design specifications. 5.4 Human Performance Issues A newly constructed centrifuge based flight simulator was described by Lawson and colleagues (paper #15). In a series of experiments to examine ameliorating effects of visual cues in disorienting situations of head movements under G fields, in this case produced by rotating supine subjects about a vertical axis passing through the head. Primary results concern findings similar to those found with other axes of rotation: in the dark, weaker disorientation during accelleration than during constant velocity; with visual stimuli, these effects are attenuated. Results are discussed in terms of potential problems with centrifuge based flight simulations. Two papers presented data suggesting that stomach awareness may develop when using virtual environments. Kennedy and colleagues (paper #2) described a scoring system used to assess the degree and the nature of motion sickness. Data support the notion that three types of effect (nausea, disorientation, and oculo-motor) may be produced. The pattern of effects appear stable at different installations, suggesting that each effect may be produced by a specific failure to provide fidelity in implementation. The second paper concerning motion sickness like reports was presented by Regan (paper #16), who described the frequency and magnitude of malaise in approximately 150 subjects. After twenty minutes, roughly five percent withdraw from the experiment due to malaise, with roughly half showing malaise at
level two or greater. Partially successful coping strategies are also reported. These include reductions in the frequency, speed and magnitude of head movements. Retinal image quality may be degraded under some conditions of virtual imagery. Kotulak and colleagues (paper #17) report non-optical factors can determine monocular visual accommodation in a fraction of viewers if the optical distance and physical distance of seen objects differs by a large factor (as can happen, for example, with vision aiding devices). Most virtual systems are binocular, however, so these results may not extend to the majority of those systems. A software suite of tools for generating virtual imagery on personal computers was described and offered by Stampe and Grodski (paper #18). The software provides the capability for wire drawings, and stereo displays at reasonable frame rates. The software includes a set of mathematical routines that provide multiple viewpoints of the same virtual objects for multiple viewers. Issues in three dimensional audio for virtual interfaces was described by Pellieux and colleagues (paper #20), using a facility for measuring individual Head-Related Transfer Functions (HRTF's) that describe the spectral weighting of sound sources at different locations. Experiments are reported on accuracy of locating virtual auditory sources in three space. Individual differences are reported. Greater accuracy in azimuth versus elevation is reported. The use of audio cues to enhance situational awareness and to localize threats was also discussed. A novel tactile display device was described by Rupert and colleagues (paper #20) and used to convey attitude information to pilots wearing the device (an array of tactile stimulators wrapped mainly around the torso). With the device, precision in maintaining fixed bank and roll could The be maintained after some practice. formatting of tactile displays to convey basic flight information was also discussed. 5.5 Demonstrations Several applications were demonstrated on videotape. These included telesurgery, medical
T-5
training, architectural input/output systems. 6.
design,
and
voice
CONCLUSIONS
No systems using virtual interfaces are yet fielded. With few exceptions (paper #8), system level development also is not yet underway among NATO laboratories reporting here. Conceptual designs and partial implementations, however, are easily found for applications in medicine (paper #3), training (keynote paper and paper #4), and design (paper #9). Impediments to system development currently appear to include three major factors, associated with technology, design, and research. Technological impediments include uncertainty about how best to monitor human performance (papers #4, 5, 6, 10, 11, 12, 13, 14). Design issues concern how to select among numerous design options, in a principled way, by measuring any performance benefits of virtual interfaces (papers #1, 3, 8, 18). Research issues concern how best to predict the perceptual effects of imperfectly rendered or symbolically encoded natural environments (papers #6, 7, 15, 17, 19, 20), how to provide necessary computational resources for virtual displays (papers #9, 18), and perhaps most important for general use, how to eliminate the malaise experienced by a portion of the population using virtual environments (papers #2 and 16). 7.
RECOMMENDATIONS
Aerospace medical applications for virtual interfaces are not sufficiently distinct from applications in other domains (e.g. command and control, training and simulation, design) to warrant a completely distinct research and development effort devoted to aeromedicine. The tools for construction of virtual interfaces derive from multiple disciplines. Research on tools can proceed independently of research on systems. Examples from this meeting include devices for monitoring head, eye and hand movements, and speech production. Other examples include visual, auditory, and tactile displays. Performance monitoring and display technologies have applications in domains broader than virtual interfaces. As a result,
other work needs to be done to adapt the tools for use in virtual environments. The constellation of tools used to implement a demonstration of virtual technology, even if readily available, do not sufficiently constrain the design options. As a result, additional research is needed on concept definition and performance evaluation (against technologies currently used) to demonstrate that virtual solutions to interface problems add unique capability or provide measureable performance benefits.
K-I
A RESEARCH AGENDA FOR VIRTUAL ENVIRONMENTS Professor R.S. Kalawsky British Aerospace Defence Ltd Military Aircraft Division Brough North Humberside UK HU15 1EQ
1. SUMMARY During recent years a great deal has been written and discussed about Virtual Reality. In fact Virtual Reality has received almost unprecedented press and media coverage. News and views of its capabilities have been made and along with films and amusement games, Virtual Reality has been portrayed to the general public as an experience within a fantasy world. Most people now associate Virtual Reality as a 'new' technology which consists of a helmet mounted display, a glove-like device and a high performance graphics system. They do not realise that Virtual Reality is not a new technology and the aforementioned description of it is only one type of a virtual interface system. Concepts underlying virtual environment systems look set to revolutionise the future aerospace business. With cutbacks in defence spending there is even greater need to employ cost effective measures to improve the efficiency of the business. Applications are likely to range from simulation, cockpit design studies, maintainability assessment, more cost effective training through to complete product visualisation. However, key issues have to be identified and addressed before being developed and applied to a specific task or application.
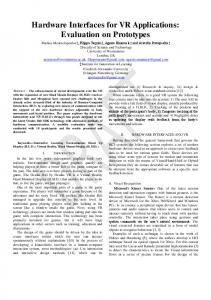
Most people associate Virtual Environments with a helmet mounted display, a glove-like device and a high performance graphics system, but such a system is only one type of a virtual interface system. Today, it is awkward and difficult to define a virtual interface system because as yet there are no clear or consistent definitions to guide us. Many definitions have been proposed, but probably the best abstract description for a virtual interface system is given by Zeltzer2 (1991). The definition is based on a model that 'assumes' that any Virtual Environment has three components: 1. A set of models/objects or processes. 2. A means of modifying the states of these models. 3. A range of sensory modalities to allow the participant to experience the virtual environment. Zeltzer represents these components on a unit cube with vectors relating to autonomy, interaction and presence. (Refer to Figure 1) Virtual reality (1.0.1)
This paper explains the difference between Virtual Reality and Virtual Environment systems and discusses the requirements of a Virtual Environment System. Moreover, key outstanding
(1,1.1)
(l00)
research issues are highlighted
(0,0,1)-
-------------
(0.1.1)
and recommendations for the way ahead are given. 2.
WHAT
DO
WE
MEAN
BY
VIRTUAL
Aut
Presence
ENVIRONMENTS ? Virtual Reality, Virtual Environments, Artificial Reality, Cyberspace, and Synthetic Environments are a few of the
terms used to describe the same concept. Although Virtual Reality is the term that has become the most popular, a great deal of research has to be undertaken before we can achieve virtual reality. Therefore, the term 'Virtual Environments' seems to be a more appropriate term to use. Ellis' (1993) suggests that virtual environment systems are a form of personal simulation system.
(0.0,0)
Interaction aci
(0.1,0) .. Cntional CAD
or automat[ion
Figure 1 Zeltzer's Autonomy, and Presence Cube Autonomy refers to a qualitative measure of the virtual object's ability to react to events and stimuli. Where no reaction occurs then the autonomy is 0 whereas for maximum autonomy a value of 1 is assigned. Scaling between 0 and 1 in this context is purely qualitative.
Presentedat an AGARD Meeting on 'Virtual Interfaces: Research and Applications', October 1993.
K-2
Interaction refers to the degree of access to the parameters or variables of an object. A rating of 0 applies to non real time control of the variables. For example, variables initialised during compilation or at the beginning of execution. A value of 1 is assigned for variables that can be manipulated in real time during program execution. Modem graphics systems allow a very high degree of interaction. However, it is necessary to consider the complexity of the application. A very complex application program may not be able to run in real time. Presence, or rather the degree of presence provides a crude measure of the fidelity of the sensory input and output channels. The degree of presence has a high dependency on the task requirements - hence the application has a bearing. At the point (0,0,0) on Zeltzer's cube is represented the very early graphics systems that were programmed in non real time batch mode. These early systems exhibited no interactivity. Examples include graph plotters and chart recorders. Diagonally opposite this point is our aiming point where we have maximum autonomy, interactivity and presence. This is virtual reality. The sensory simulation would be so complete that we would not be able to distinguish the virtual environment from the real world. The point (0,1,0) can be achieved today where the user can control essentially all the variables of an object or model during programm execution. This can be achieved in real time. A point approaching (0,1,1) probably represents the status of virtual environments where we can experience a high degree of interactivity with a reasonable degree of presence. Unfortunately, the degree of automation of the objects in the virtual environment is relatively low. The point (1,0,1) represents the situation where there is a high degree of presence and autonomy but the interactivity is low. An example of this would be a fully autonomous virtual environment where the human becomes a passive observer but is fully immersed in the virtual environment, The only freedom the observer would have is the ability to control their viewpoint. Any change of viewpoint would be oblivious to the objects in the virtual environment. When the author first attended one of Zeltzer's presentations he was not convinced that the abstract representation of a virtual environment would serve any purpose. However he now finds that when explaining the different categories of virtual environments, Zeltzer's conceptual tool is a very useful aid. 3. OUTSTANDING RESEARCH ISSUES There are a vast array of issues that relate to a virtual environment system. Whilst our understanding in many
areas is quite advanced, our overall understanding of the requirements of a virtual environment system are less clear. Even though we may not necessarily need to achieve virtual reality in the truest sense, we are unable to quantify the requirements of lesser capable systems. It is tempting to jump on the virtual reality bandwagon and deal only with the technology aspects of the field. However, if the technology is to move forwards then it is be necessary to examine the task before the technology is applied. Only by doing this will it be possible to consider what attributes a virtual environment system brings to the task that cannot be achieved by alternative and lower cost solutions. A business analysis will almost certainly be undertaken which will examine (to a 'first-order' assessment) the technological problems that may be encountered. In many respects the business case will provide the necessary justification for employing a virtual environment system. 3.1 Human Perception in Virtual Environments Our understanding of human perception and human factors issues regarding virtual environments is still in its infancy. A considerable amount of research in this area is very important because it is needed to focus the development of enabling technologies. Major research areas include: 3.1.1 Visual perception (i) Spatial resolution - What display spatial resolution is required for a particular task? (ii) Field of view is a difficult parameter to specify. However, to achieve an immersive virtual environment a field of view of 100' or more may be required. To achieve a wide field of view a very large optical system is required. The main aim will be to determine what field of view is needed to perform the task effectively. (iii) Binocular overlap - This parameter is related to the total display field of view. To achieve stereo displays a degree of binocular overlap is required. Partial overlapping binocular fields may be used to produce a very wide field of view. However, the amount of binocular overlap is important and must be 'tuned' to suit the application. Perceptual and human performance studies must be undertaken to determine if a partial overlap solution is appropriate. (iv) Temporal resolution - What display update or refresh rate is acceptable for a given task? The higher the update requirement the greater the computational performance will be needed. (v) Visual representationof the virtual environment must be investigated to determine the nature of the scene to be
K-3
used for the application. Some applications may require very high fidelity displays whilst other applications may suffice with simplified, cartoon like images. Obviously, there are large differences between these visual should the virtual How 'real' representations. environment appear? The answer must address the spatial and temporal fidelity of the virtual environment. Cost will be a determining factor. (vi) Is an immersive or desk top system required? (This question can only be answered after consideration of the task, the complexity of the system and the cost.) 3.1.2 Auditory perception (i) In auditory environments the area requiring a great deal more research is the field of 3-D audio localization, Generation of spatialised sound can be achieved with high performance digital signal processors. However, individual differences in pinnae shape can lead to errors when non-personalised head related transfer functions (HRTF) are used. Occasionally a sensation of nonexternalization can be experienced. This means that the listener does not perceive the sensation that the sound originates outside the head. Further work is required in characterising HRTF's and determining the causes for lack of externalization in some subjects. Simpler 3-D audio localizer systems do not take account of effects such as reflection and reverberation. These are characteristics of a real environment. Therefore, work must be undertaken to examine the importance of accurate modelling of the acoustical environment. Sound in a real environment undergoes multiple reflections from a range of material types before it reaches the ear. Moreover, sound can be received from a single source via a direct path and many indirect routes. These sound waves combine in the ear to give a very complex waveform, The importance of the secondary reflections and indirect path sound signals must be quantified. If these characteristics have to be modelled it will be important to develop second generation audio localizer systems with an order of magnitude improvement in performance. (ii) Improved HRTF - To achieve an acceptable degree of spatial auditory localization it is necessary to determine the individual's HRTF and use this in the audio localisation system. Ideally, a more generalized solution is required that works for many users and eventually becomes user independent, (iii) Cues for range and localization. It is known that to determine both range and orientation of the sound signal the type of auditory cue presented to the listener is very important. This is particularly so when first time recognition of sound is required.
(iv) Externalization - Many users of spatial sound systems complain that the sound appears to be localized within the head. In other words externalization does not occur. This effect may be a function of the HRTF not being compatible with the listener. 3.1.3 Haptic/KinaestheticSystems (i) In comparison to visual and auditory environments, haptic environments are still in their infancy. To maintain a high degree of presence in the virtual environment it is probable that there will have to be direct contact with virtual objects. Discrete approaches are currently being undertaken to stimulate the tactile and kinaesthetic senses. These are largely confined to force reflecting joysticks, hand/arm exoskeletons and tactile feedback gloves. On investigation, the human haptic system is considerably more complex than one realizes. To convey haptic stimulations it is necessary to take account of surface skin and sub-surface physical properties of the tissues. (ii) The human haptic/kinaesthetic systems need to be characterized and consideration must be given to temporal variations. Manipulation strategies in real world systems should be determined for a range of tasks. Object characteristics such as compliance and roughness must be defined in a way that these parameters can be encapsulated in a CAD/Virtual environment modelling program. To provide computer synthesised haptic responses it will be necessary to develop a computational model of the physical properties of the skin and underlying tissues. (iii) In order to apply forces to the hand and arm it is necessary to use a form of exoskeleton into which the hand and arm is inserted. The problem of safety must be addressed because forces of the order of 10 Newtons will be applied. There seems to be no alternative to the exoskeleton but to couple haptic and kinaesthetic forces to the operator. (iv) Work is required in the development of lightweight sensors and actuators to keep the overall mass of the exoskeleton at an acceptable level. The bandwidth and frequency response of a force reflecting system needs to be quantified by careful experimentation. Current tactile stimulation systems are essentially stand alone demonstrations of a field of mechanically activated (or pneumatic) 'points'. Depending on the technology used they either provide small reactive areas (each area covering several square millimetres) or an array of extendable points at a density of 1/2 mm. (v) A key element to the development of a haptic display system is a complete analysis of the biomechanical properties of the skin.
K-4
(vi) Bandwidth - To perceive detailed surface texture information it is important to characterize the haptic and kinaesthetic system in terms of bandwidth and dynamic response. If a haptic actuator system is to be built then it must have a bandwidth that exceeds that of the human perception system. A similar requirement exists for force reflective devices, except that the problems of supporting an exoskeleton must be addressed. The actuation system must not only provide the right level of force feedback but it must overcome the mass, inertia and friction of the exoskeleton system. (vii) Resolution - Equally important to the bandwidth of the haptic system is the resolution of the actuator system used to convey the sensation of touch. The spatial resolution and dynamic range are important parameters. (viii) Strategiesperformed by the human with haptic tasks must be analyzed in a way that allows the actuator technology to be simplified. It is probably impractical to replicate all the cues provided by picking up an object. Therefore it will be necessary to isolate the dominant cues and ensure that these are presented with a sufficient level of fidelity, 4. Performance Metrics The area of performance metrics is extremely important for determining the effectiveness of a particular virtual environment solution. Without any form of metric it is very difficult to match the human operator to the virtual environment. Moreover, it will be almost impossible to optimise the man machine interface because we have to rely on subjective opinion. The problems of defining suitable performance metrics is not unique to the field of virtual environments. Indeed the whole field of man machine interfacing is desperately calling for a set of standard performance criteria. If a suitable set of metrics were to exist then it would be easy to quantify the benefits that a virtual environment system brings over and above alternative approaches. The author encourages researchers to think very carefully about the advantages of applying a series of metrics to the field of virtual environments. Once a set of metrics has been established then hesitant potential investors may be convinced of the real benefits brought by virtual environment technology, 5. Virtual Environment Technology (i) Displays - Urgent research is required to assist the development of true 1000 x 1000 pixel colour displays. These should be full colour, high update rate and be contained within a small package size of about 25.4 mm square. High resolution - Future display resolution requirements are likely to approach the limiting resolution of the eye (1 minute of one) with several minutes of arc being a more practical requirement.
Variable resolution - It is well known that the human eye has excellent visual acuity in the region of the fovea. Outside this area the spatial resolution falls off dramatically. It may be possible to develop a display system that is matched to the resolution of the human eye. This will mean using an eye slaved high resolution insert. Eye slaved high resolution patches seem to offer the necessary resolution over relatively small angular subtenses. However, there is a question regarding the performance of the eye tracking technology and the dynamic response of the high resolution patch deflection system. Displays embodying this approach will be expensive. (ii) Space tracking technology Low phase lag - Without doubt one of the critical areas of space tracking systems (and virtual environments) is the requirement for low phase lag. The phase lag will probably have to be less than 5 mS if the lags are not to affect the performance of the operator. Particular care has to taken when interpreting what is meant by phase lag as described in Chapter 6. Resolution requirements for tracking systems probably do not need to exceed 0.1 mm in translation and 0.01 ° in angular terms. For many applications translation resolution of the order of 1 mm and angular resolution of 0.1' may be quite adequate. (iii) Multiple object tracking - It will be desirable to track multiple objects within a virtual environment. For example - the user's head, and possibly both hands. With most current tracking systems the effective update rate of each tracked object is divided by the number of tracking sensors used. This reduction in update rate is due to the synchronisation or multiplexing of trackers in the system. Unfortunately, this is a consequence of the technology used in the tracking system. A better method of tracking multiple objects is required that does not use multiplexed sensors. Moreover, if the whole body is to be tracked in terms of limb position then this amounts to a considerable number of sensors. Apart from the update problems, the large number of cables connecting the sensors to the tracking electronics becomes a significant problem. Ideally, a wireless tracking system should be used. In the future, image processing systems may be able to determine the position of multiple objects without the need to cable up the participant. However, this will demand considerable processing performance and high resolution imaging sensors. (iv) Image generators - Virtual environments place severe timing constraints on image generation systems. Whilst very high performance can undoubtedly be achieved there is a concern that the architectures of these systems do not lend themselves to the demanding performance required. As described in Chapter 6 the key parameter is the
K-5
system throughput time. This figure must be considerably better then current values of 40 mS -100 mS. Apart from designing graphic system architecture to suit the virtual environment application, benefits can also be obtained by employing predictive filtering techniques. Different algorithms must be studied to determine if they offer any real advantage, Low latency architectures - Current graphics platforms may need to be redesigned with low latency architectures in mind. This requirement derives from the need to couple head tracking systems to the later stages of the graphics system. It is tempting to employ the standard RS232 interface of the graphics system for the space tracking system. Unfortunately, this interface is not usually designed for real time applications. As a consequence, attempts to send large amounts of high speed data through this interface results in an unacceptable interrupt load on the host processor. This means that more time is spent servicing the interrupt than in dealing with graphics drawing operations. Update rate - The question of update rate is an interesting one. At the moment the computer graphics industry is concerned with increasing the spatial resolution of a display in preference to display update rate. However, for a virtual environment application this may be the complete opposite of what is required. Spatial resolution could be secondary to display update rate. Urgent research is required to determine whether high frame rate displays should be used in favour of high resolution displays. One factor in favour of the high frame display is the limitation in display resolution of current helmet mounted displays. There seems to be little point in wasting computational effort when the display device cannot resolve the fine detail. Motion prediction - There is some merit in being able to use motion prediction methods to compensate for inherent system lags. Provided the motion of an object can be expressed by means of a motion equation, it is possible that previous motion data can be used to predict where the object will be during the next few iterations. Parameters such as velocity and acceleration profiles are used in the prediction process. In the case of the user's head it will be necessary to determine the dynamics of the human head. Kalman filters could be used to predict where the object or head would be during the next few frames. 6. Virtual Environment Software Engineering (i) Visual programminglanguages - To build the synthetic environment from a collection of library routines, the majority of software tools for virtual environment applications rely on a competent 'C' programmer being available. In contrast to this the VPL RB2 virtual environment programming tools rely on visual programming techniques. These visual programming techniques allow people, with fairly minimal computer
literacy, to create and maintain a virtual environment. With these tools it is possible to create a fully interactive virtual environment without writing any software. The visual programmer constructs the virtual environment by linking objects in the virtual environment with behaviourial constructs. These are represented on screen by icons and simple 'wiring diagrams'. Whilst the highest performance virtual environments will be programmed at a basic level ,the use of a visual programming language will be of great benefit to the person interested in rapid prototyping. As computer graphics systems become more powerful, the performance difference between visual programming languages and conventional programming techniques will converge. As virtual environments become larger, then visual programming techniques may result in significant cost savings that far out-weigh conventional approaches. (ii) Databasestandards- All virtual environment systems rely on an underlying database standard on which to represent the objects of the environment. In some ways the database is rather like a CAD type database standard. (Some virtual environment software packages are actually based on well known CAD standards.) However, a virtual environment system will generally require considerably more data to describe the environment. Not only is it necessary to describe the geometrical and spatial relationships of objects, but other parameters such as behaviour must be specified. This includes responses to external events or stimuli such as collisions and also includes mass and feel. To date there are no standards in this area. A virtual environment standard is an obvious requirement. (iii) Virtual environment modelling. The whole area of modelling for virtual environments needs attention. At the moment there are no standards developing and there is a danger that future virtual environment systems will have to support multiple standards. If some measure of standardization does not come soon then organisations will have invested effort in their chosen standard and will be reluctant to move to another standard. With a virtual environment it will be necessary to store additional attribute information about an object such as texture (feel), weight, compliance and so on. Therefore, we have an opportunity to develop an open standard that can be used by everyone. (iv) Multiple participants - In order to create multiple participant virtual environments, it will be necessary to develop communication protocols so that consistent databases can be maintained for each user. This means that if one participant moves an object in his virtual environment, then the corresponding object in another participant's environment is updated accordingly. The problems of networking in database systems should be
K-6
reasonably well understood. However, some work will be required to ensure that efficient protocols are developed that allow real time operation. (v) Use of virtual environments inside the virtual environment systems - The high level of interactivity within a virtual environment is one of the strengths of the technology. However, this interactivity will only be of value if the design work that is undertaken within the virtual environment can be used outside the virtual environment. 7. PHILOSOPHICAL REFLECTIONS It is easy to become excited by virtual environments and the potential they offer. However, it is very important to resist this initial burst of enthusiasm and direct one's attention to the task of determining what the key issues of the system should be. It will be necessary to address the nature of the user interface and to understand the system requirements. Only when this has been undertaken should consideration be given to the type of technology that should be employed. Care must also be taken to address the human factors issues inevitably associated with complex man machine interfaces, An equally important issue that must be addressed along with the human factors and the associated engineering, is a thorough business analysis. Nearly all ventures in high technology systems will fail unless the business issues have been properly addressed. From the author's perspective there are many people who having heard of the term Virtual Reality believe that the subject is all about helmet mounted displays and glove like devices, However, virtual reality or virtual environments is much more than a helmet mounted display and glove device, The business decision makers must be made to understand the wider issues of virtual environments. They must realise that a virtual environment is a synthetic computer generated representation of a physical system. A representation that allows a user to interact with the synthetic environment as if it were real. One of the distinct advantages being that the user is not bounded by limitations presented by the real world. For instance, virtual environments could be used to prototype a product during the early part of its life cycle. The interactivity of a virtual environment would allow the user to explore alternative configurations before the product is manufactured. This approach means that design and development risks could be removed early in the manufacturing life cycle. In many respects the world is already moving towards rapid prototyping systems or synthetic design environments. The benefits of these systems are already established. A virtual environment system addresses the totality of such design and rapid prototyping systems by allowing the user to achieve a higher level of interactivity than can be afforded by
computer aided design (CAD) systems. It would be wrong to suggest that every prototyping system will require total immersion in the virtual environment. Some design tasks may be better served by a traditional CAD system but during the latter stages of design a more immersive system may be required. Therefore, a key requirement is the ability to move between these different prototyping systems by providing the designer with the right level of immersion for the task. Ideally the transition between the different prototyping stages would be seamless and extend into the manufacturing process. The concept of assessing ease of manufacture and ease of assembly is extremely exciting. This could be further extended into customer product training whist the product is being manufactured. Manufacturing processes based on a virtual environment could revolutionize the way we design and manufacture things in the future. 8. RECOMMENDATIONS FOR THE WAY AHEAD There is little doubt that current generation virtual environment peripherals are limited in terms of resolution. However, by conducting research into the human factors requirements it will be possible to match the technology to the human interface. The affordable high resolution full colour helmet mounted display is already on its way and so to are the high performance computer systems. Advances in the other technologies such as tracking systems and haptic/kinaesthetic feedback display systems are moving at a slightly slower pace. As people recognize the importance of virtual environments then improvements will be made. From a virtual environment scientist's point of view it will be necessary to provide human factor's guide lines so that the technology may be appropriately developed. Would be developers of the technology (including software) are advised to consider the standardization of interfaces. This will make it easier to take advantage of improved technology as it emerges. It is hoped that this paper will act as a baseline of knowledge which we can all build up our understanding of the next generation human to machine interface. 9. A STRATEGY FOR FUTURE RESEARCH The aerospace community is well placed to retain a leading position in the field of virtual environments providing that a coordinated research effort is maintained. Rather than undertake ad-hoc research without any clear objectives it is necessary to agree a research agenda with identifiable objectives and deliverables against clear business drivers. 10. REFERENCES 1. Ellis S.R., (1993) from forward in Kalawsky: The Science of Virtual Reality and Virtual Environments, Addison-Wesley, 1993.
K-7
2. Zeltzer D., (1992) Autonomy, Interaction, and Presence, Presence, Vol 1, Number 1 3. Research Directions in Virtual Environments, Computer Graphics, Volume 26, Number 3, August 1992 4. Kalawsky R.S. The Science of Virtual Reality and Virtual Environments, Addison-Wesley, 1993 11. ACKNOWLEDGEMENTS This paper is based on an extract from a book published by Addison-Wesley Publishers in 1993. Kalawsky: The Science of Virtual Reality and Virtual Environments Addison-Wesley Publishers Ltd © 1993. Finally, kind permission to publish this article by British Aerospace is gratefully acknowledged.
1-1
TASK-SPECIFIC USABILITY REQUIREMENTS FOR VIRTUAL INFORMATION ENVIRONMENTS: INTERFACE DESIGN AND DATA REPRESENTATION FOR HUMAN OPERATORS OF COMPLEX MEDICAL SYSTEMS Michael S. Nilan, Ph.D. 4-206 Center for Science & Technology School of Information Studies Syracuse University Syracuse, NY 13244-4100 USA Internet:
[email protected]
SUMMARY
1. INTRODUCTION - USABILITY CONCERNS
The National Research Council has identified "usability" as one of two major requirements for coherent development of computer and information systems over the next ten years [Ref7]. Theuse ofmultisensory virtual environment technology to display and provide access to system functions and data relevant to large-scale, complex, potentially volatile medical tasks (e.g., telepresence surgery) increases the (already critical) need for unobtrusive, transparent interface designs and data representations. Unfortunately, the medical community must take responsibility for providing requirements specifications to the computer industry or else be forced to adapt to existing technical constraints [Ref 10]. Recent research in interface design and data organization/ representation for two dimensional computer applications indicates that dynamic representations of the specific task or problem that the human operator is performing is very effective [Ref 8]. Employing a task-specific, "user-based" methodology, steps in the task resolution are organized into a dynamic model of the task. Linked to this model are the functional system requirements and information/data need requirements divided into specific content requirements, display requirements (including spatial organization), and system help requirements. The resultant model is readily interpretable by system designers and in addition, provides them with specific task-related system evaluation criteria. Usability advantages of dynamic task representations include: minimal system/application training requirements for operators; and coherent, comprehensible and uncluttered sensory field organization of system functions, relevant data and help information. Because of its ability to provide specific task-related requirements to system designers, this methodological approach will insure maximum usability of high performance computing (including virtual reality technology) for critical medical applications.
"It is becoming increasingly clear that the comfort of a goodfit between man and machine is largely absent from the technology of the information age." - John Sedgwick, The Atlantic Monthly, March 1993, p. 96 Everyone is becoming anxious to solve the usability problem, from popular writers like John Sedgwick [Ref 15] representing users in general to national policy groups like the National Research Council [Ref 71 representing the computer industry, federal policy makers, and academia. There are several conditions that have generated this interest in usability including: - a trend towards distributed computing along with the accompanying increase in complexity for users; - a general shift from a manufacturing economy to a service economy, i.e., a shift from a product orientation to a service orientation over the last twenty years or so and, in the computer industry, over the last couple of years; the current economic recession, particularly in computer related industries, e.g., the newest hardware platforms and software updates haven't sold very well; management in user organizations' concerns with the "hidden" cost of training associated with new applications, application updates or new workers; and • very widespread frustration of users in general with the lack of simple coherency in system design, particularly across applications.
Presented at an AGARD Meeting on 'Virtual Interfaces: Research and Applications', October 1993.
1-2
The introduction of the IBM Personal Computer just over ten years ago, in addition to stimulating the information explosion, was a major catalyst in the spread of computerized systems from laboratories and data processing departments to virtually every aspect of human activity. Until very recently, the concern for usability was primarily the concern of vendor marketing departments while the "real" system designers focused on smaller, faster, flashier, more gimmicks, etc. based upon the technology (e.g., the perplexing profusion of graphic icons in Microsoft Word, version 5.1 and just about all virtual reality applications). In essence, the range of capabilities of systems have not matched well with the range of user needs and system features have been represented to users in a confusing variety of cryptic forms. This is not to say that designers weren't interested inusabilitybutratherthat it was not as high on their agendas as it has been on users' agendas. And yet, the aphorism about hardware being ten years ahead of the software persists. Concurrent with this shift within systems development organizations towards more usable systems, the users were learning a few lessons as well. They have learned, for example, that their most important investment is in their data and being able to easily employ that data to solve problems, make decisions and plan rather than investing in the newest, fastest, highest resolution hardware. They are also getting a good sense of how much time and energy needs to be invested in learning/training to get existing systems to do even the rudimentary data manipulations that the systemsarecapableof, andthesesystemsstilldon'tdo what the users need. In spite of the incredible things that computerized systems can do, the feeling users are getting is that most of these systems are solutions running around looking for problems. Users already have problems and those problems are not adequately reflected in existing systems. While there are some very notable exceptions to this, e.g., Lotus 1-2-3, for the most part, the American free enterprise notion of inventing something and then marketing it has been a serious impediment to addressing users' needs, a problem originating at the management level of system design organizations. After all, if the market was buying the systems, why change? Consequently, usability in existing systems is quite poor. If this is the case for socalled "stand alone" applications, it is doubly so for distributed high performance computing and communications (HPCC) technology that might be able to facilitate complex medical problems.
2. SYSTEMS DESIGN: IN THE BEGINNING... A major source of assumptions and insight into computer system design comes from the seminal work of Herbert Simon and Alan Newell. In The Sciences of the Artificial [Ref 16], Simon established an approach to system design based upon simulation of human cognitive processes (i.e., creating systems which demonstrate the ability to arrive at a functionally equivalent solution to a problem or task) as a means by which designers can learn about designing systems and, at the same time, learn about human cognition. His justification for this "isomorphism" approach is that there are two sources of insight into human cognition, the internal (i.e., what actually goes on when people think) and the external (i.e., watching the actions people use to solve problems, etc. and developing functional simulations of the process and outcome). Simon argued that the internal source of insight is not available to designers but that is all right because the external is just as good. At least two generations of system designers (i.e., computer scientists, computer engineers, cognitive psychologists, programmers, etc.) have followed this assumption in their approach to design through their approaches to the user interface and data representation. Note that this is the era that led up to the current situation where usability has become much more essential to effective system design and even essential to the economic prosperity of the United States [Ref 7]. One way to interpret Simon's argument is that somehow, technology stands apart or is different from human behavior. I would propose a different picture of technology, i.e., that rather than being something separate from human cognition, I would argue that all technology is a derivative of human cognition. The etymological origin of the word "technology" stems from "technique" and even further back to the Greek "technos," both of which essentially refer to the process by which a problem is solved or something is accomplished. In fact, virtually all technological applications are an extension of human cognitive, sensory and motor capabilities [Ref 9]. Further, one of the most serious problems with systems development right now can be explained by a process that builds new technology on top of old technology without effectively checking back with the human problem that stimulated the application in the first place. A vicious circle is established where technological applications are supplying insight into design rather than the original human needs. This is particularly troublesome since we weren't very good at understanding
1-3
user needs when we designed the old technology. In this sense, it would seem that Simon's argument is a bit tautological and, with regards the usability problem, is not likely to provide much insight into users' needs. In other words, I disagree with Simon that the internal is inaccessible and I feel that the external is not sufficient for usability concerns. How can technology NOT be inherently tied to human perceptions of the problem being addressed by the system? One of the other assumptions of the user-based approach is that the ideal model for human-computer interaction is human to human interpersonal communication. This means that one of the essential "places" to search for insight into system design is internal; exactly opposite from the strategy espoused by Simon. One of the costs to usability that has resulted from the adoption of Simon's logic is that systems have been designed, presented to the user, and the user must adapt his/her behavior to the system, i.e., the user must become more like the system in order to effectively employ it. The user-based approach argues that systems must become more like users [Ref 3] and that this is not only do-able, it is imperative, Using a database application as an example, early database management systems (DBMS) were highly "structured" in that the user (after spending a lot of time learning the application) could do only a very few things that had been programmed into the system. The Simon-driven response to user dissatisfaction has been to create (relatively) "unstructured" DBMS systems that are supposed to allow the user to do anything the programmers could dream up plus anything the users could articulate indicating what they "wanted" (see [Ref 3]). Users are no more experts in knowledge acquisition than are system designers. As a result, the user is overwhelmed by the variety/complexity and has no idea how to proceed to make effective use of the system functionalities (even if the representation was comprehensive and somehow comprehensible through training). What is really needed is a design approach that emphasizes functions known to be useful to users which are then represented in a semi-structured manner so that the user has guidance from other users who have solved the same problem, made the same decision, etc., rather than menus or ranges established by designers and programmers. What is not clear in practice or in the literature is how designers might do this or whether users might more productively specify what they need because designers are obviously not doing this.
In practice, the focus on usability is often placed on the user interface and this remains a very vexing problem in system design: "Not only is there disagreement about how to arrive at a good user interface design, it is not even clear who, on the development team, should be responsible for this task. In short, wedon'tknow who or what kind of knowledge is most advantageous in producing good interface design. The responsibility for the user interface has been relegated to a variety of people with a variety of backgrounds (Bailey, [Ref 1]). There are other aspects of system design that effect usability, of course, including the logic by which the user cognitively organizes the various functions that the system offers (including which functionalities of solving the particular problem have been incorporated into the system), the way that data are organized in the system (both "help" data or documentation as well as data that are being manipulated by the system), and data representation or the form that the data are given to the user. The argument here is that we need to adopt a strategy forunderstanding users that is quite different from Simon' s if we are to coherently address usability. The reader should note that I am not quarreling with all of Simon's approach but rather those aspects that are not effective for usability concerns. 3. MEDICAL COMMUNITY NEEDS The medical community is notably behind other scientific counterparts in the deployment of computing technology. A number of reasons contribute to this lag in adoption including: • the relative lack of specialized systems appropriate for medical practitioner and administrative problems beyond office automation; • the already incredible intellectual demands on training physicians that leaves little or no room for specialized information technology training; - the expense of existing HPCC medical systems (e.g., CAT, NMRI); *
the high marketing pressure on and resultant confusion of physicians and hospital administrators for a wide variety of computerized (and non-computerized) systems;
1-4
"•the potential complexity of many medical task situations (both in terms of specific activities within a particular task as well as in terms of the complexities within an activity); and
"*the relatively large investment in existing systems
ever, that make medicine a perfect market segment to force the issue of usability: • the medical community lags behind other scientific and engineering professions in the use of high performance computing and communications; and
(so-called "legacy" systems). Not only are system designers not effectively representing the user in generalized applications, but they are philosophically and methodologically unable to understand the unique needs of the medical community. For example, from the technological perspective, the imaging needs of physicians and surgeons do not always (or even very often) require the very high resolutions that might be useful in other scientific contexts. The surgeon for example, needs to "see" what s/he is doing and what is behind the externally visible surface. A resolution of 640 X 480 would be quite sufficient if, what was underneath the tissue that is being cut with a scalpel is visible as well. The issue here is not one of resolution but making visible "hidden" aspects of the problem at hand. Processing speed of the image display may be an issue, but resolution is not (in the vast majority of cases). For the majority of surgical procedures that are carried out, the precision of the scalpel plus or minus 2 mm is sufficient. The "real" problem is revealing hidden layers accurately. Another example might be a physician examining MRI data. The problem is differentiating one tissue type from another (e.g., healthy from diseased tissue). Again, high resolution or three-dimensional views are not likely to address this visualization problem. Unfortunately, none of the existing work on visualization has addressed this specific combination of needs. On the administrative side, particularly in mobile military health care communities, maintaining patient record systems which include text as well as images and sound is an extremely difficult distributed problem. These records may be needed by a surgeon in an operating theater and at the same time by a specialist thousands ofmiles away. While the technical capability might be available, because of the relative crudeness of user interfaces, task-oriented data management systems, and ad hoc data representation, it is currently not feasible. So, in spite of the relatively impressive gains in computing power, speed, bandwidth, imaging, etc., the "fit" for a reasonable deployment of HPCC information and computing systems in medicine remains elusive. There are two very compelling reasons how-
the medical community represents a VERY large market (particularly of late due to the potential of HPCC to contribute to reducing the costs of health care reform). In a real sense however, most high performance computing and communications, including virtual environment technologies, represent "solutions looking for a problem" [Ref 10]. What this paper will argue however, is that if the concern is usability (as defined above), the idea is NOT to fit problems to available technology but to fit technology (and/or to develop technology) to address problems as those problems are understood by the users. To see how users understand problems, we need to look at knowledge acquisition and representation. 4. KNOWLEDGE ACQUISITION AND REPRESENTATION Basically, what is needed in system design is a way of interacting with users that generates lists of functions that users employ to solve their problems, etc. and a way to represent those functions to system designers so that the resulting system is inherently (or with minimal learning required to be) understandable to users. The most important "place" this must be done is where users cognitively interact with the system, i.e., at the user interface and where data is represented to the user (or the user employs an internal data representation to search for data relevant to the task at hand). Recently, there have been some interesting developments in conceptualizing approaches for understanding user needs (e.g., [Ref 18]). Among the more innovative approaches to understanding users, I would include Lucy Suchman's [Ref 17] efforts at Xerox to try ethnographic methods to find out what users need. She is immersing herself in actual problem or decision contexts (what Dennis Wixon [Ref 19] calls "contextual design") and observing the dynamics. Donald Norman, who is currently working with Apple, employs his "user-centered" design [Ref 14] via "cognitive engineering" so that he can make better design decisions. The Association for Computing
1-5
Machinery's Special Interest Group on Computer and Human Interaction (ACM/SIGCHI) has begun to discuss alternative approaches to figuring out exactly what it is that users want (e.g., [Ref 6] discussing ethnographic versus experimental psychological approaches). However, there is no agreement on "what" should be looked at in human behavior to insure usability nor is there an agreement on "how," i.e., methods. In terms of "what" to look at, the relationship between human beings and technology suggests that we look at how people perceive that they solve problems, make decisions, plan, etc. and see if there are any patterns across users; we start with the problem rather than with what the technology can or might be able to do. We cannot literally get inside peoples' heads, but we can develop very detailed and valid pictures of how people perceive their problem solving processes. We know we can do this because people teach each other through language (either in direct conversations or vicariously via books, articles, training manuals, etc.). Fortunately, there is a growing body of literature (e.g., [Ref 4], [Ref 8]) that indicates:
"*people experience a problem or decision as a sequence of actions or steps over time;
at that point in time, what tools were used at that point in time, what the user was trying to accomplish, etc. This approach has several advantages: the user-based researcher is asking the user to communicate his/her actual experience with a problem (i.e., one representation of the internal experience) rather than a hypothetical or experimental problem; because this structure is used to probe for detail in the user's internal experience, it allows for time-specific details to be probed in more detail; and all elaborations on the cognitive experience of the user are linked to this dynamic mnemonic structure (the utility of this analytically will be discussed below). The resulting knowledge structure has both temporal and spatial structural features. The arrangement of the steps in the problem in a time order should be able to help system designers know "when" the user will need system functions or help or specific kinds of data. The "what" the user needs is a spatial representation of the cognitive activities of the user's needs at that point in time. Note that the spatial features can be arranged according to their importance or their frequency of use across users, etc.
"*although there are some differences in the amount of detail between novices and experts in how they perceive a particular problem, there are also distinct patterns common to both, i.e., certain actions or steps that are taken in the same time order; and
"*there are also patterns in the language that users employ to refer to actions or steps (because they are trying to communicate). So, for the knowledge acquisition aspect of system design, the user-based approach has adopted observation techniques and strategies from clinical psychology, ethnomethodology and communication science. The resulting frame-based methodology (e.g., see [Ref 2]) has users describe their view of the problem solving process in the order that the actions or steps occurred to them (this can be done with recall techniques or in real-time). The researcher represents these "action objects" to the user as a sequence (on three by five cards for example) that is intended to be isomorphic with what the user actually did (or is doing) in solving the problem. This idiosyncratic model of the steps in the problem solving process is then used as a dynamic mnemonic device to elicit further details about what theuser was thinking, what information theuserneeded
One of the most common complaints that traditional knowledge engineers have at this point is that they feel that there is too much variance in the ways that human beings perceive their environments leading to the conclusion that we cannot use this kind of perceptual data to create knowledge representations suitable for system design. However, if there really is chaotic variance, language for communication should be impossible (and it obviously isn't) and technological applications would have to be different for each person (and they don't). So, the user-based approach employs users' dynamic descriptions of the way that they perceive their own problem solving, deciding, planning in a task specific context. There are some powerful advantages as a "side effect" of this source of insight into user needs. For example, when people talk, they have to talk about one thing at a time and they usually start at the beginning and end at the end. We know that conscious attention is serial, i.e., one thing at a time. We also know that people experience existence (and therefore problem solutions, decisions, etc.) as changes over time. The isomorphism here between cognitive functions, experience and communication is a powerful source of
1-6
validity. Another advantage of this approach is that users tend to employ language that is inherently meaningful to them and the person they are talking to (i.e., the user-based knowledge engineer). The communication capability is a significant usability consideration that is passes, along with the knowledge structure, to the system designer (as discussed below), Although there are a variety of specific methods suitable for in-person interviews, self-reporting, etc., there are also a number of semi-automated methods that could be employed as long as the user-based conceptual approach is taken as a guideline. For example, Maes & Kozierok at the MIT Media Lab [Ref 5] are working on neural network-based "intelligent agents" which collect data about how a particular user does things on the system, detects patterns in the user's behavior, and eventually does those things for the user. By employing such an agent at a "higher" level in the system, designers could learn about patterns across users in a real-time fashion. Another example is "CommTool" being developed for the New York State Center for Advanced Technology in Computer Applications and Software Engineering [Ref 13]. This is a system-level software tool that allows users to communicate with system designers from the rapid prototyping stage through the implementation stage and into the maintenance stage (referringtothe software life cycle). In addition, CommTool also provides analytic guidance for directing the user feedback to the appropriate system person (i.e., information/data providers, system maintenance people, system designers and analysts, managers, etc.). The way this type of knowledge is represented for system designers is identical with the analytic procedures used by researchers to interpret results across users (see [Ref 11] for a detailed example with a desktop publishing application). An "action by cognition" matrix is created where the steps in the problem solving process (in time order) that all users agreed upon constitute the horizontal dimension. This is the basic interface structure. All user access to system functions, to help information, to data created in the process of using the application, etc. are via this "action" dimension of the matrix. For each one of these steps, all of the activities across users in between and including the agreed upon step are set up as a secondary action level. At this level, an expert would see everything s/he needs to do at a particular point in the problem solving process and a novice would immediately get an idea of what kinds of things are possible. Linked (in a hypertext sense) to this secondary action level, are all the system functions necessary
for completing that particular step in the process. Included in system functions are network communications links, specialized display requirements, etc. Also linked are all help files so that a novice could get help directly oriented to the particular point in the problem solving process that s/he was at that point in time. Finally, supporting data either commonly used in the problem solving process or that is produced as a byproduct of the process are also managed from this secondary level. The range of system functions, help messages, and data that are linked to each action step represent the system assistance in the "cognitive" aspects of the problem solving process. While this description is obviously an abstract characterization and some of the nitty gritty details are left out (see [Ref 11] for a more detailed description), the "action by cognition" model is really a cognitive communication model because: • first it is used for establishing communications betweentheuser-basedknowledgeengineerandthe users; *
second, a derivation of the model is used to a communicate the users' needs to the system designer;
- then it is employed to represent the system to the user in the interface; and *
finally, the model can be used as a system evaluation tool with a variety of task-based evaluation criteria beyond the normal "time on task" or "percentage correct" measures (which actually measure user performance, not system performance).
Regarding virtual reality technologies and their incorporation into more complex task situations, a conceptual proof of concept of a "system design space" was implemented for the U. S. Air Force Office of Scientific Research [Ref 121. The purpose of this project was to illustrate how even extremely complex, distributed, high performance computing and communications architectures and performance requirements could be linked to complex user-based knowledge stmctures for specific tasks. The demonstration of the capability was implemented on virtual reality technology at Rome Labs (Griffiss Air Force Base) in New York State. While complexity per se is not the point of employing task-specific usability requirements as the foundation for system design, complexity in the form of detailed process, associated information needs, associated (both computerized and non-computerized) tools and sub-processes, data management across
1-7
a distributed organizational network, etc. can ALL be coordinated in this manner. In fact, this is the only manner in the literature where all system design considerations can be represented in the same "design space." 5. CONCLUSIONS The argument of this paper is that the user-based approach goes beyond the existing approaches to system design in the following ways:
"*the role of the user is seen as conceptually central to the design process because human-computer interaction itself is seen as a basic human-to-human process;
" instead of asking the users what they want or need and instead of observing users' external behaviors and then inferring what is going on inside their heads, users' knowledge/experience is an integral part of the user-based approach; and
"•users' descriptions of their perceptions of problem solving, decision making and planning processes are used to create dynamic knowledge structures that are used to stimulate the users' memory, to facilitate the communication between knowledge engineers and system designers, to provide a knowledge representation structure for interface design and data organization, and is used for subsequent system evaluation, The user-based approach to knowledge acquisition, knowledge representation and (recently) to information system evaluation, is a relatively new approach. It has, however, been tested, evaluated, and found to be extremely useful in addressing the usability problem in system design. The reader should be aware that the user-based approach represents another source of insight into the design process. Existing efforts by cognitive psychologists, computer engineers, software engineers, etc. need to be continued, but any system design team should have at least one user-based knowledge engineer to insure that users are adequately represented in the design process. For the medical community, this paper argues that historical forces (e.g., increasing demands for usability, health care reform), economic forces (e.g., recession in the computer industry, potential market that the medical community represents), the increasing gap between technological capabilities and the medical community's exploitation of that technology, and, most importantly, the needs of the medical community
itself can be well served by developing user-based descriptions of their needs for presentation to system designers in the computer industry. Coalitions among health care organizations (both public and private) as well as coalitions among categories of health care professionals (e.g., laproscopic surgeons, health care maintenance organization administrators, military health care administrators, etc.) can reduce the cost and dramatically increase the effectiveness of HPCC and virtual environments in solving their information and communication needs. While virtual environments represent great potential for addressing complexity issues and, as an emerging technology have their own technical constraints, the issue of usability is fundamental to the future of all computing technologies. The medical community can take the lead in usability improvements, help develop HPCC to address its own problems and at the same time facilitate improvements in usability for other user communities. ACKNOWLEDGMENTS The author would like to acknowledge the assistance of the School of Information Studies at Syracuse University, the New York State Center for Advanced Technology in Computer Applications and Software Engineering, the Alex Nason Foundation of New York City, and the U. S. Air Force Office of Scientific Research for their support of the various research projects reported on in this paper. The author would also like to thank the following Ph.D. students, without whom, these projects would have been impossible: Joanne Silverstein, R. David Lankes, Bob Travica, and Bhaskaran Balakrishnan. REFERENCES 1. Bailey, G. (1993). Iterative Methodology and Designer Training in Human-Computer Interface Design. In the Proceedings of INTERCHI, 1993 (Amsterdam, The Netherlands, 24 April-29 April, 1993) New York: ACM, pp. 198-205. 2. Dervin, B. (1983). An Overview of Sense-Making Research: Concepts, Methods, and Results to Date. Paper presented at the International Cornmunication Association Annual meeting (May 26 - May 30, 1983, Dallas). 3. Dervin, B. & Nilan, M. S. (1986). Information Needs and Uses. In M. E. Williams (Ed.), Annual Review of Information Science & Technology, 21, pp. 3-33.
1-8
4. Katzer, J. & Fletcher, P. T. (1992). The Information Environment of Managers. In M. E. Williams (Ed), Annual Review of Science and Technology, 27, pp. 227-263.
13. Nilan, M. S. & Travica, B. (in preparation). CommTool: A Tool of User-Based Software Design, Refinement and Evaluation. Copies are available from the author.
5. Maes, P. & Kozierok, R. (in press). Learning Interface Agents. Proceedings of American Association for Artificial Intelligence '93.
14. Norman, D.A.(1986). Cognitive Engineering. In D. A. Norman & S. W. Draper (Eds.), User Centered System Design: New Perspectives on Human-Computer Interaction. Hillsdale, NJ: Lawrence Erlbaum Associates, pp. 31-61.
6. Nardi, B., Gilbert, N., Mantei, M., & McCarthy, J. (1993). Mixing oil and water? Ethnography versus Experimental Psychology in the study of computer-mediated communication. In the Proceedings of INTERCHI, 1993 (Amsterdam, The Netherlands, 24 April-29 April, 1993) New York: ACM, pp. 3-6.
15. Sedgwick, J. (1993). The Complexity Problem. The Atlantic Monthly, 27:3, pp. 96-104. 16. Simon, H. A. (1969). The Sciences of the Artificial. Cambridge, MA: MIT Press.
7. National Research Council (1992). Computing the Future: A Broader Agenda for Computer Science and Engineering. Washington, D. C.: National Academy Press.
17. Suchman, L. (1987). Plans and Situated Actions: The Problem of Human-Machine Communication. Cambridge: Cambridge University Press.
8. Nilan, M. S. (1992). Cognitive Space: Using Virtual Reality for Large Information Resource Management Problems. Journal of Communication, 42:4, pp. 115-135.
18. Winograd, T. & Flores, F. (1986). Understanding Computers and Cognition: A New Foundation for Design. Menlo Park, CA: AddisonWesley.
9. Nilan, M.S. (1993). Speculations on the Impact of Global Electronic Networks on Human Cognition and Human Organization. Electronic Networking, (in press). Copies available from the author.
19. Wixon, D., Holtzblatt, K. & Knox, S. (1990). Contextual Design: An Emergent View of System Design. In Proceedings of the Conference on Human Factors in Computing Systems (Seattle, April 1 - April 5, 1990), New York: ACM, pp. 331-336.
10. Nilan, M. S., Silverstein, J. L. & Lankes, R. D. (1993) Whose Reality? The VR Technology Agenda in Medicine. Al Expert Virtual Reality '93: Special Report, pp. 33-37. 11. Nilan, M. S. (in preparation). User-Based Information/ Communication Systems: Using SenseMaking to Create a Desktop Publishing Help and Training System. In B. Dervin (Ed.), Methodology Between the Cracks: Theory and Method for the Qualitative and Quantitative Study of Human Communication. Copies available from the author. 12. Nilan, M.S. & Lankes, R.D. (1992). User-Based Requirements for Large-Scale Distributed Information Management Systems: Representations for System Designers. Report to the U. S. Air Force Office of Scientific Research.
2-1
PROFILE ANALYSIS OF AFTER- EFFECTS EXPERIENCED DURING EXPOSURE TO SEVERAL VIRTUAL REALITY ENVIRONMENTS Robert S. Kennedy, PhD Essex Corporation 1040 Woodcock Road, Suite 221 Orlando, Fl 32803 Marshall B. Jones, PhD Behavioral Sciences Department Milton S. Hershey Medical Center 500 University Drive Hershey, PA 1.7033 CDR Michael G. Lilienthal Defense Modeling and Simulation Office 1.901. N. Beaureguard Street, #5014 Alexandria, VA 22311 Deborah L. Harm, PhD Code SD-tJohnson Space Center Houston, TX 71058
SUMMARY Motion sickness symptoms are an unwanted by-product of exposure to This problem virtual. environments. is not new and was reported in the early flight simulators and experiments on ego motions and vection. The cardinal symptom of motion sickness is, of course, vomiting, but this symptom is ordinari].y preceded by a variety of other symptoms. In his classic studies of motion sickness conducted before and during World War II, G. R. Wendt introduced a three point scale to score motion sickness beyond a vomit/no--vomit dichotomy. Later, Navy scientists developed a Motion Sickness Questionnaire (MSQ), original.ly for use in a slowly rotating room. In the last 20 years the MSQ has been used in a series of studies of air, sea, and space sickness. Only recently, however, has it been appreciated that symptom
p].e, nausea is the most prominent symptom. In Navy simulators, however, the most common symptom is eye strain, especially when cathode ray tubes are employed in the simulation. The latter result was obtained in a survey of over 1,500 pilot exposures. Using this database, Essex scientists conducted a factor We found that analysis of the MSQ. signs and symptoms of motion sickness fell mainly into three clusters: 1) oculomotor disturbance, 2) nausea and related neurovegetative problems, and 3) disorientation, ataxia, and vertigo. We have since rescored the MSQ results obtained in Navy simulators in terms of these three components. We have also compared these and other profiles obtained from three different virtual reality systems to profil.es obtained in sea sickness, space sickness, and al.cohol intoxication. We will show examples of these various profiles and point out simularities and differences
patterns in the MSQ are not uniform but vary with the way sickness is
among them which indicate aspects of what might be called "virtual-reality
induced.
sickness".
In
seasickness,
for exam
Presented at an AGARD Meeting on 'Virtual Interfaces: Research and Applications', October 1993.
2-2
1.
INTRODUCTION
In many areas of advancing tech-nology,
it
is
not tuncommon
forces and, to some extent, the visual characteristics of the stimulus.
to find
unwanted by-products. These negative consequences can become serious problems if they are not anticipated and resolved early in the systems development process. Motion sickness like symptoms, disequilibrium and other post effects are examples of the probl.ems faced by the training device industry in the past ten years and have been termed simulator sickness (Crosby & Kennedy, 1.982). Simulators, by design, present rearranged and altered perceptual. worlds and are a sub class of the newly developing virtual reality (VR) systems. We bel.ieve that VR sickness is likely to occur and should be addressed as technologies develop. Simulator sickness was first reported over 30 years ago in two studies by Havron and Butler (1957) and Miller and Goodson (1960). Since that time, the numbers of studies and reports of simulator sickness have increased at an exponential rate; there was as much published on simulator sickness since 1990 as in all previous years. A simulator sickness program, sponsored by the U.S. Naval Air Systems Command, began in a formal. way in 1.982 and initially emphasized problem defi.nition. A series of simulators was surveyed and the incidence documented (Kennedy, Lilienthal, Berbaum, Baltzl.ey & McCaul.ey, 1987). Then the U. S. Navy sponsored two workshops attended by persons knowledgeable in visual vest .bul.ar interactions. Reports from the workshops, in the form of guidelines and suggestions for research (Kennedy, Berbaum, Lilienthal, Dunlap, Mulligan, & Funaro, 1987) resulted in a field manual (NTSC, Si.mul.ator Sickness, 1989) which is currently in use in the U.S. and some NATO countries, Since then, the emphasis has shifted to the identification of the nauseogenic properties of the stimulus, parl;i.' ,]arl.y the inertial
Crucial. to the design of simulators is specification of the equipment parameters that will. promote training effectiveness and realism, but also avoid simulator sickness. However, the technological. advances which have provided the opportunity for increased fidelity have, in turn, placed greater demands on other tol.erances on simulator subsystems (e.g., responses of visual. and motion base systems and their interaction). Visual display systems combine diverse methodologies for generating and enhancing visual. information, and sometimes through misalignment, fail.ure, or other factors, eyestrain and other symptoms related to motion sickness may be experienced. Yet pil.ots may be unaware of the source of these difficulties and are there-fore sometimes unable to provide enough information for the visual display engineer to identify and correct the problem. Needless to say, standards and specifications to address these problems are also lacking. As more and more facilities have begun human factors programs to develop virtual environments for training, operational and recrea-tional usage, aftereffects are increasingly being reported in much the same manner as was found in simulator usage. indeed, a recent issue of Presence (Vol 1, Number 3, Summer 1.992) had been devoted to articles which related simulator sickness applications to virtual reality systems and at a recent conference (Virtual. Reality Annual. International Sy~mposion, 1.993) on virtual reali.ty (VR) systems, several, papers alluded to the requirement for virtual reality technologists to attend to visual vestibular interactions since they are the likely source of VR sickness. We predict that VR sickness will. be sufficiently like other forms of motion sickness and simulator sickness that important
2-3
diagnostic i.nformation is available by making comparisons of the symptom data. Historically, scientists involved in the experimental study of motion sickness employ motion sickness symptomatology questionnaires (Kennedy, Tolhurst, & Graybiel, 1965) to handle the problem of different symptoms being The MSQ experienced by individuals. reflects the polysymptomatic nature of simulator sickness in that multiple symptoms are taken into account in the diagnostic scoring, The theory behind scaling motion sickness severity is that vomiting, the cardinal sign of motion sickness, is ordinarily preceded by a combination of symptoms (Lentz & Guedry, 1978; McNally & Stuart, 1942; Money, Therefore, in order to score 1970). motion sickness beyond merely a vomit/no-vomit dichotomy, Wendt (1968) initially employed a threepoint continuum scale in a series of This studies on motion sickness. scale was used to assess motion sickness symptomatology, whereby vomiting was rated higher than "nausea without vomiting" which, in turn, was rated higher than discom-.. Navy scientists developed a fort. Motion Sickness Questionnaire (MSQ) consisting of a checklist of symptoms ordinarily associated with motion sickness for use in sea and air sickness studies (Kennedy et al., These symptoms included: 1965). cerebral (e.g., headache), gastrointestinal (e.g., nausea, burping, emesis), psychological (e.g., anxiety, depression, apathy), and other less characteristic indicants of motion sickness such as "fullness A response was reof the head." quired for each symptom using a rating of "none", "slight", "moderate", or "severe" (or in some cases "yes" or "no"). From this checklist, a diagnostic scoring procedure was applied resulting in a single, fivepoint symptomatology scale, serving as a gl.obal. score reflecting overall The five point scale was discomfort. expanded in studies of seasickness conducted by the U. S. Coast Guard,
with the cooperation of the U.S. Navy, (Wiker & Pepper, 1978; Wiker, Kennedy, McCauley, & Pepper 1979a, b; Wiker, Pepper, & McCauley, 1981). These scoring techniques are useful in that they permit quantitative analyses and comparisons of motion sickness in different conditions, Howexposures, and environments. ever, a deficiency for the study of simulator sickness is that the single global score does not reveal information about the potential.ly separable dimensions of simulator sickness and it lacked statistical It was normalization properties. argued that such information could be informative about the nature of sim-ulator sickness and may also serve a diagnostic function; not just about the individual but to signal differences in the equipment factors (e.g., visual distortion; motion characteristics) which may differentially cause the sickness. 2
METHOD
Sim•lator
Sickness Questionnaire (SSQ)
In order to obtain information about separable dimensions of simulator sickness, >1000 Motion Sickness Questionnaires (MSQ) have been factor analyzed (Lane & Kennedy, 1988; Kennedy, Lane, Berbaum & Lilienthal, The results of that study 1993). produced three specific factors and The three facone general factor. tors form the basis for three SSQ These subscales or dimsubscales. ensions appear to operate through different "target" systems in the human to produce undesirable symScores on the Nausea (N) ptoms. subscale are based on the report of symptoms which relate to gastrointestinal distress such as nausea, stomach awareness, salivation, and burping. Scores on the Visuomotor (V) subscale reflect the report of ocu].omotor--rel.ated symptoms such as eyestrain, difficulty focusing, Scores blurred vision, and headache. on the Disorientation (D) subscale are related to vestibular disarrange-ment such as dizziness and vertigo.
2-4
of It was also found that the list symptoms could be abbreviated with little loss in accuracy. Subsequently, a Simulator Sickness Questionnaire (SSQ) was developed based on 16 symptoms only. In addition to the three subscales, an overall Total Severity (TS) score, similar in meaning to the old MSQ Each SSQ subscore, is obtained. scale was scaled to have a zero point and a standard deviation of 1.5. The scoring of the questionnaire is shown in Table 1. Figure 1 shows total simulator sickness scores for several simulators in the Navy's inventory,
Total Sickness Scores Simsick Database Figure 1 30
20
Anyone with a score care is used. over 15 (i.e., one standard deviation) should contact a flight surgeon or corpsman or be carefully debriefed by an experienced inWe also believe that structor pilot. the score attained by the 75th percenti.]e person may be a useful index in this regard. In addition to the total scores, it is possible to use the factor scores as a kind of profile. We find it informative to report factor scores for each of the simulators and to compare them to each other as well as to other forms We believe that of motion sickness. following differential diagnosis of simulator sickness inferences can be made about cause and remediation can be made from these comparisons. Figure 2 shows the profile score from five helicopter simulators (2B1i2 [#'s 2 and 4] NAS Milton FL; 2F]17 one in MCAS New River NC and one in MCAS Tustin CA & 2F1.20 in MCAS New River). Profiles of Simulator Sickness Helicopter Simulators
Figure 2
30-
0c
4,
'2ý
Note that sickness in simulators varies from an average near zero (2F132, a fixed base operational flight trainer for the F/A 18) to an average near 20 (2F64C, a moving base helicopter weapons system trainer for
020
1-
0
-
2B42
284
#2
#4
MNsurovaget.tive (N~u,,.,
the SH-3). These scores which are used to eva].uate the performance of the simulator are presently employed as arithmetic means but ordinarily the incidence of sickness is positively skewed. Therefore, even a simulator with a low score may still. place some pilots at risk after leaving the simulator (Kennedy et al., 1987). Therefore, we recommend the use of an addi.tional score to index the safety of a simulator. in our view, anyone with a score higher than 20 (i.e., 1.3 stand deviations) should be warned of his/her condition and not permitted to leave the simulator building unless extreme
,t
=11
2F12o
2F1 20
N-W RIN,
T-Utin
2F2
lOculornotor ElDl.orlentation (Ey. Sti~n, ,t
.1|
M1-zz.....
.t
.1|
It may be seen that the twin simulators in the same city show mirror images of symptoms as do the twin simulators with the same designator in different cities. The one simulator which is not the same as the two other pairs (2F1.20) also has a slightly different pattern. This set of profiles encouraged us to continue with our search for common and uncowmmon profiles, arguing that similar symptom mixtures may imply similar genesis of problems and the converse. We also elected to review other places where motion sickness like symptoms occur and to compare
2-5
these as well.
flighL simulatoc (21,'120 in three locales), hut these dalb are not yet analyzed.
Figure 3 shows Army helicopters and Figure 4 shows Navy helicopters. Note how most of these have similar
Figure 5 shows the application of
profiles.
this
In
general the nausea corn-
ponent is large but the oculomotor component is the largest.
methodology to space motion
sickness. Profiles of Simulator Sickness Figure 5
60
Army Helicopter Simulators Figure 3 30
50
....
10 -
~i
.... .....
...
40
PAT NASA 0
AH21
INou (N..
..A-..040
iEJOculomotor ElDisorlentatlon
MNsurovegottatv.
..... .C
-,•-10 l
CH-4.7 .
UH-60
y
-
-
~ri.
-1)
(OICCIn*,
t
Siok
Novy FI..
Spinning
Ch~ir
rovegotetive . .= *.
ElO oulonmotor (Ey. 6-r.n., .1)
ElDIiorlerntellon I
.
1
thi~s figure is the Pre flight Adaptation Trainer, a virtual - reali~ty system which is being employed to provide training in the illusory phenomena to be experienced Shown in
I)
-
- -
a P...
Navy Helicopter Simulators Figure 4 30
in space in order to increase
tolerance. 020-
----
---
-
-
The other data are from
actual. symptoms of space motion
sickness reported by 85 astronauts (and other crew members) in the past several years. Also shown is a
.210..
spinning chair test which is employed
for pretesting for space motion 2F117
2F120
HNeuroveget.tIve (N...........
)
2FI21
2FO40
Sk..Sl.k
ElOculomotor E:Dlsorlentation (Ey.
S .n.. ...... .
M....
.....
sickness by NASA as well as the U.S. Navy's average for a dozen simulnuatorl s (N1500).
Note first
that sickness
t .0i
incidence is higher here than iin the
When CRT based simulators are corpared to dome display simulators which are also fixed base, both of these symptom incidences are re--
previous figures and we have adjusted the Y axis to a maximum sickness score of 60 versus 30. Note also that there is a very good agreement between SMS and PAT sickness and that
duced. We would hypothesize that the reduction in nausea is related to the
these two are quite different from simulator sickness, but not much
moving base, and have begun studies where the moving base is turned off during operations and observed a slight lowering of this symptom
different from the spinning chair Lest. Based on these relations one might hypothesize that sickness in PAT would be more predictive of space
complex. strain to commented and, when
motion sickness than either of the other two environments and that spinning chair would be better than simulator sickness.
The relationship of eye CRT displays has been upon by Ebenholtz (1988) dome displays are used
appears to be somewhat reduced.
There is one system where a dome and CRT are used with the same basic
2-6
Figure 6 shows three virtual reality systems, all of which employ head mounted displays and the NASA PAT virtual reality system. HMD System Profiles Figure 6 70
shed light on the possible causes of the maladies, particularly if modifications to the devices can be made and then symptoms examined to determine whether and where changes in symptom mixture have occured. 3
.Crucial
0
40 ---
--
--
- - - - ---
3
- -
.. .effectiveness
....
is
DISCUSSION to the design of VR systems specification of the equipment
parameters that will promote training
and realism, but also avoid sickness. However, the technological advances which have
10
CSRDS (NASA)
PAT (NASA) (N .u
.i
AR, (US A-yi
AE.RE (UK)
.N11u(vegEtyt~v. .1t CIEys 8-Oo1footor 8t.In, .t .ll1EDoirnt (Dzte,
Note that the NASA Crew Station Research and Development System resembles the VR system from the UK and the NASA PAT system, but is slightly different from the U.S. Armiy Research Institute's VR system. Reasons for this may be uncovered by comparIng the various equipment features of the different systems. Figure 7 compares alcohol induced discomfort (at .15 mg/dL) with sea sickness and simulator sickness along with space motion sickness and sickness symptoms in the NASA VMS device, Figure 7
Spectral Profiles for Sickness ---
60 - - - - -----------
.
o
.
-cannot
ON
have,
in
turn,
on other
compromised,
and components and
subsystems may be purchased that be used, and so the buyer does not get good value for their acquidollars.
Our experience with system development suggests that assessing effects
20
on humans usually comes late in
"
-
S..... F-1 ........
fidelity
tolerances on simulator subsystems (e.g., responses of visual and motion base systems and their interaction). Misalignment or asynchrony among si.enulation modalities and channels and other failures may occasion eyestrain and other symptoms related to motion sickness. Yet, evaluators of these systems may be unaware of the complex nature of these causes and be unable to detect their presence and are, therefore, unable to provide enough information for the visual display engineer to identify and correct the problem. Needless to say, standards and specifications to address these In conseproblems are also lacking. quence, effective training may be
.sition
130 - - -
10
creased
placed greater demands
.1til *t
70- -.. -------------
provided the opportunity for in-
development process M. W
..
...... .t9ot.UV. (N ...... .11
..... Doo1,o.otor (Ey. 8t-1ý,
F et .10
M-....-......
DIo,,.,,,,,o(Dizzine..,
.t
.l1
the design
is
virtually
VR systems
are
brand
development. technical
Note that with motio _on, the VMS resembles space sickness, although the magnitude of the effects are stronger in the VMS. Note that the fixed base NASA VMS resembles sea sickness. We believe that using symptom profiles such as these can
step
in
frozen, new
We think
the
at a time when
but
and under
that
improving
the first systems
so that they do not induce sickness is to quantify, as accurately as possible, the problem(s) that are experienced by the humans who will use them. The causes cannot be determined until there is a suitable assessment of the "criterion". This
2-7
criterion
in
terms of which
engineering characteristics will. ultimately be evaluated, needs to be reliable and valid and sufficiently diverse so that differential stimu].us effects can be discriminated. In the case of simulator sickness, we have begun to measure the problem(s) experienced by the pilots as accurately as possible. We bel.ieve that this scoring system affords the opportunity to make comparisons over several different environments and stimulus conditions and provides a standardized method that can profit by widened usage in VR systems.
References Crosby, T. N., & Kennedy, R. S. Postural disequilibrium and (1982). simul.ator sickness following flights in a P3-C operational flight trainer. Preprints of the 1982 Annual Scientific Meeting of the Aerospace Medical Association (pp. Washington, DC: Aerospace 1-47-i48). Medical Association.
Kennedy,
R.
S.,
Berbaum,
K.
S.,
Lilienthal, M. G., Dunlap, W. P., Mulligan, W., & Funaro, J. (1987). Guidelines for alleviation of simulator sickness symptomatoloqU Orlando, FL: (NTSC-TR-87-007). DTIC Naval Training Systems Center. # AD A182 554 Kennedy, R. S., Lane, N. E., Berbaum, K. S., & Lilienthal, M. G. (1993). Simulator sickness questionnaire: An enhanced method for quantifying International simulator sickness. Journal of Aviation Psychoqhloy, 3(3), 203-220. Kennedy, R. S., Lilienthal, M. G., Berbaum, K. S., Baltzley, D. R., & McCauley, M. E. (1987). Syptomatology of simulator sickness in 10 U.S. Navyflight simulators Orlando, FL: Naval (NTSC-TR-87-008). Training Systems Center. Kennedy, R. S., Tolhurst, G. C., & The effects of Graybiel, A. (1965). visual deprivation on adaptation to a rotating environment (NSAM 91.8). Pensacola, FL: Naval School of Aerospace Medicine.
Sources of Ebenholtz, S. M. (1988). asthenopj.a in navy flighht Defense Logistics simulators. Agency, Defense Technical Information Accession Center. Al&.-~t
-~C
00
00
0r
0
0t
0
to
-
0 0
0)
to)
tO
w
0f
0
t
--
-V8
0)
2.11, p < .038). They
were able to make these judgments even though they experienced little or no motion sickness as a result of CONST HM (z = 1.62 at p = .10). Conversely, no consistent perceptual effects were identified for ACC HM (i.e., no ratings significantly different from the baselines and independent of direction of rotation). In fact, ACC HM tended to produce somewhat less motion sickness than rotation without any head movement at all (z > 2.12 at p < .034). The best measures for distinguishing ACC HM from CONST HM were the subject's judgments of how disturbing and startling the head movement felt (see items 1 and 2 described in "Methods"). These measures distinguished CONST HM from the baselines regardless of rotation direction (z > 2.11 at p < .034), and showed no difference for ACC HM versus the baselines or for one baseline condition versus another. Results of Experiment 1B (On Back in Dark): Of a total sixteen, six subjects judged CONST head movement as a more 'abnormal' experience than ACC HM in all four comparisons, while no subject found ACC HM more abnormal in all four comparisons. The Kendall coefficient of agreement X 2 = 11.39 for median of four comparisons was significant at cx < .001 for n = 16. 11/16 subjects did not tend to rate one direction of rotation as being more
15-5
2 = .25 for median 'abnormal' than another.50 (Xfor oftougmnsa> n = 16). of two judgments, Regardless of direction of rotation, subjects Regadles diectono o roatin, ubjcts usually rated the CONST HM as more disturbing, more startling, and more likely to induce abnormal perceptions of head and body orientation the baseline bodyorietaton versus vrsusthebaseine conditions. (z > 1.89, p _2.18, p < .029 for every contrast except CW rotation CONST HM versus CW rotation without head movement, where z = 1.81 at p = .07). Robust and consistent differences from the baseline conditions were not obvious during ACC HM. The best measure for distinguishing CONST HM from ACC HM was the subject's judgments of how disturbing the head movement felt (item 1 in "Methods"). This measure usually distinguished CONST HM from the baselines regardless of rotation direction (all z > 1.89 at p 5 .059), and showed no difference for ACC HM versus the baselines or for one baseline condition versus another.
Results of Experiment 2A (On Side with Visual Reference): Five of sixteen subjects judged the head movement made during constant velocity in the dark (DK HM) as a more 'abnormal' experience than the head movement made during constant velocity after viewing the visual reference (LT HM) in all four comparisons. No subject found the LT HM more abnormal in all four comparisons. The Kendall coefficient of agreement was X2 = 3.13 for the median of all four comparisons, which did not quite reach significance (ax = .08 for n = 16 subjects). However, 13/16 subjects found the DK HM to be more disorienting than the LT HM on the first opportunity they had to make a comparison, while 3 subjects could not distinguish any difference (X2 = 5.29 at a < .02, n = 16). Eight subjects did not tend to rate one direction of rotation as being more 'abnormal' than another. Of the 8 subjects who did tend to rate one direction as more abnormal, 3 chose the CCW (pitch forward) direction on both opportunities to compare, and none chose the CW (pitch backward) direction on both opportunities. Overall, there was no significant directional preference (X2 = 1.3 for median of two judgments, a > .20 for n = 16).
Subjective ratings of each head movement were highly variable, and consistent perceptual effects did not emerge from this analysis. Results of Experiment 2B (On Back with Visual Reference): Of sixteen, six subjects ViulRfrne:Osxtnixubcs judged the DK HM as a more 'abnormal' experience than the LT HM in all four experience HM found in allthefuLT comparisons,thate while no_ LT subject HM more abnormal in all four comparisons. The Kendall coefficient of agreement wasoX2 = 6.25 for the median of all four comparisons, which was significant at ax < .02 for all 16 subjects. Ten subjects found the DK HM more disorienting than the LT HM on their first opportunity to make a comparison (X2 = 1.75 n.s. at ox > .10, n = 16). Twelve subjects 1.7 n at at 0n 1 T ect s did not tend to rate one direction of rotation 2 as being more 'abnormal' than another (X = .05 for median of two judgments, ax > .50 for n = 16). Subjective ratings of each head movement were variable, and no consistent perceptual effects emerged from this analysis. DISCUSSION The Potential Benefits and Drawbacks of a Centrifuge-based Flight Simulator: Flight simulators are a safe and relatively low-cost way of supplementing flight training. It is reasonable to expect that they will become a more integral part of flight training as they become increasingly more sophisticated and realistic. For example, if a virtual reality interface could be successfully coupled with a centrifuge-based motion platform, trainers would obtain more flexibility in the choice and the combination of acceleratory and visual information, making it possible to simulate a greater variety of high performance flight profiles with increased realism. However, it is important to recognize that disorientation and nausea will be evoked by certain combinations of centrifuge rotation with movements of the trainee's head (or his simulator cabin), and with particular visual stimuli. It is not sufficient to ignore this problem by simply allowing simulator trainees to adapt to these effects. Some situations that would cause disorientation in centrifuge-based simulators would probably not be disorienting during the actual flight operations being simulated (Gilson, Guedry, Hixson, and Niven, 1973), thus trainees might adapt in ways that are not
15-6
appropriate to real flight (Kennedy, Lilienthal, Berbaum, Baltzley, and McCauley, 1989). If centrifuge-based flight simulation is to be feasible without the risk of such negative transfer in flight training, it will be necessary to systematically identify simulator scenarios that produce disorientation only when it would occur during actual flight, and also to test the extent to which certain kinds of vestibular and visual information can attenuate these disorienting effects in cases where they are unavoidable during simulator training, Head Movements in the Dark With and Without Acceleratory Information in the Plane of Body Rotation: The current study supports the idea that CCC stimulation will not be disorienting when it is immediately preceded by certain types of vestibular or visual information. Subjective reports concerning head movements in the dark were similar to previous research, suggesting that an antecedent acceleratory stimulus in the plane of rotation will attenuate feelings disorientation during CCC, regardless of whether the plane of body rotation tested is predominantly in the yaw, pitch, or roll plane of the semicircular canals. As summarized in Table 1, 100% of the subjects tested by Guedry and Benson (1978) judged the CONST HM as more disorienting than the ACC HM on their first (and only) opportunity to make a comparison, while 94% of the subjects in experiment IA (on side in dark) and 63% of the subjects in experiment 1B (on back in dark) said the same thing on their first comparison. This antecedent acceleratory stimulus was particularly helpful in ameliorating feelings of disturbance, abhorrence, or distress that accompany CCC stimulation. It appears that the acceleratory stimulus is most helpful during CCC stimulation following rotation in the yaw axis of the head and least helpful following rotation in the roll axis of the head. The subjective reports following multiple exposures to CCC stimulation also indicate that the roll axis shows the weakest results of the three. However, the differences between the roll and pitch axes of rotation should not be over-emphasized, since the ratings that subjects made concerning each head movement indicated that they did not feel greatly abnormal perceptual effects during CCC stimulation in either the roll or the pitch axes of rotation. It is likely that the mild CCC stimulus chosen for this study is
noticeably disorienting in the yaw plane, but only moderate effects exist in the roll and the pitch planes. This interpretation is consistent with the predominant feelings of body motion that subjects tend to perceive in each case. A subject sitting upright in the dark and rotating for a prolonged period at some constant velocity in the vertical axis tends to feel either a forward or a backward pitching sensation (depending upon the direction of rotation) if he executes a rightward head movement earthward. During normal circumstances, the detection of even the slightest real pitching motion while seated upright would be quite alarming and might be interpreted as a potential fall outside of the base of support. It would also require immediate postural compensation. On the other hand, a subject lying on his side or on his back making an earthward head movement during similar circumstances will tend to perceive rotation about his own longitudinal z-axis, as if he were simply rolling over in bed. The detection of a moderate motion of this type while lying securely restrained to a platform should not be quite as alarming or require the same postural adjustments. Head Movements After Prolonged Rotation With and Without a Preceding Earth-fixed Visual Reference: Providing subjects with a visual reference prior to CCC stimulation tended to attenuate the disorientation associated with head movement following prolonged constant velocity rotation. However, the visual reference often did not appear to exert as strong an attenuating effect as the antecedent acceleratory information had for the experiments conducted in the dark. Moreover, the extent to which a visual reference will ameliorate the effects of CCC seems to depend upon the subject's plane of body rotation prior to the head movement. Guedry (1978) found that, depending upon the subject's gaze instructions, 81-100% of subjects receiving CCC stimulation after rotation in the yaw plane of the canals found the DK HM to be more disorienting than the LT HM on the first (and only) opportunity they had to make the comparison (see Table 1). When subjects were positioned on their sides in the present study and rotated in the pitch plane of the canals (experiment 2A), 81% reported that a DK HM was more disorienting than a LT HM on their first opportunity to make the comparison.
15-7
However, when subjects were positioned on their backs and rotated in the roll plane of the canals (experiment 2B), only 63% reported that a DK HM was more disorienting than a LT HM on their first opportunity to make the comparison. Moreover, the percentage of subjects in experiments 2A and 2B who felt that the visual reference was helpful on all four of the opportunities they had to compare DK HM and LT HM was much lower. It appears that an antecedent visual reference is most helpful in attenuating the initial effects of a single CCC stimulus after yaw rotation and least helpful after roll rotation. The paired comparisons suggest that the attenuating effects of a visual reference during a single CCC stimulus are not necessarily maintained during repeated stimulation. It is possible that this is partially attributable to shifts in judging criteria over time or to the mild nature of the CCC stimulus employed, Lack of Trends in Subjective Ratings Data: The results discussed above focus mostly on the paired comparisons subjects made between DK HMs and LT HMs, that is, on their choice of which type of head movement was more perceptually abnormal. Subjective ratings were also made separately for each head movement in terms of the magnitude of the effect of CCC stimulation. These ratings were inconsistent and less likely to show significant differences than the paired comparison data. The specific subjective aspect of the CCC stimulation (e.g., disturbance, disorientation, motion sickness) that was attenuated by the visual reference tended to vary from subject to subject. The overall trend was for median ratings to be higher (i.e., more abnormal) for DK HM versus head movement without rotation, but this was also the trend for LT HM versus head movement without rotation. We draw three inferences from the collective trends in the paired comparisons and ratings data: a) although the particular subjective aspect of the CCC effect that is attenuated by visual stimulation will vary, subjects are nevertheless sensitive to an overall attenuation of the perceptual effects when they make paired comparisons; b) it appears that although a visual reference attenuates the effects of CCC stimulation, it does not abolish them altogether; c) the magnitude of the subjective ratings (especially for motion sickness) suggests that the particular CCC
stimulus used in this study was a fairly mild one for the body orientations tested (i.e., on side and on back) and may not be as amenable to measurement via subjective ratings as it is by a more sensitive paired comparison. Validation of Comparison With Past Research Findings: It is possible that the results of the current study are not directly comparable to the experiment of Guedry, 1978, since there were many differences in protocol (e.g., rotation profile and dwell velocity, amplitude and nature of the head movement, and the exact nature of the visual stimulus). This possibility was tested in a recent follow-up study (see experiment 3, Table 1). Subjects (n = 12) were seated upright and restrained by a lap belt and a bite plate which allowed for a 20-deg earthward head movement strictly in the roll plane of the canals (along with some lateral head translation towards the right shoulder). They accelerated in the yaw plane of canals at 3 deg/s 2 to 90 deg/s for 2 min, then decelerated at 3 deg/s 2 . They compared a head movement after 1 min of rotation in the dark (DK HM) to a head movement made (in the dark) after rotating for 1 min while viewing the illuminated interior of the polka-dotted chamber (LT HM). Most (92%) of these subjects found the DK HM to be more disorienting than LT HM on their first (and only) opportunity to make a comparison. These results further support the notion that a visual reference will be more helpful in ameliorating the effects of a single CCC stimulation for the original yaw rotations tested by Guedry. Testing for Directional Asymmetries Within a Given Axis of Rotation: Subjects in the current study did not report any difference between the CW and CCW directions of rotation in any of the four experiments conducted. It is possible that such differences exist, but that they do not become apparent until higher rates of rotation are employed. It is also possible that directional differences were masked by the instructions to the subject to consider the different head movements collectively when comparing the different directions of rotation. For example, a subject might typically make one DK HM and one LT HM during CW rotation, then compared both of these head movements to both head movements (DK HM and a LT HM) during CCW rotation.
15-8
This pooled comparison is of particular concern when we consider that the primary focus of the subject's attention would have been on distinguishing differences between the DK HM and the LT HM, and only secondarily on distinguishing differences between head movement during CW versus CCW rotation. These problems were addressed in four control experiments where the subject's only task was to compare head movements made in either direction of rotation. These experiments were identical to the four main experiments reported in this study, with some important exceptions. Subjects (total n = 47) were rotated (once in each direction) up to a constant velocity of 120 deg/s. Half of the subjects were rotated in the CW direction first, and half in the CCW direction first. In control experiments IC and ID, they compared a DK HM in the CW direction to a DK HM in the CCW direction. In control experiments 2C and 2D, they compared a LT HM in each direction of rotation. No prominent directional asymmetries were seen in the attenuating effects of antecedent vestibular or visual stimulation (X2 < 3.0 at a > .09, n = 11-12 in each control experiment), The Role of Neck Kinesthesia: We should note that the control and appreciation of normal head movements is not solely achieved by the integration of visual and vestibular information alone, but is also dependent on the rich source of kinesthetic information the muscles and joints of theavailable neck. from Moreover, the time jointsta of inthegt ne. Moreover,t imal constant of integration that renders small differences in the duration of each subject's head movements negligible from the standpoint of the angular impulse delivered to standpointofthe semic ular casmandelred ma the sem icircular canals may indeed m ake aais difference to the neck spindle receptors. To establish that effects reported so far result primarily from an outcome of the integration of visual and vestibular sources of information, we used a protocol in which the importance of active control of the neck musculature is diminished. Firstly, our subjects were rotated with their heads resting on a pad and strapped to a headrest. Secondly, they practiced making manuallytriggered passive head movements until subject and experimenter both agreed that the bectandoexperlooked and felt like a passive head movement lvisual drop. For example, when subjects were interviewed following (the first) experiment
1A, 15/16 said that all of the head movements they made felt passive. However, there is probably no such thing as a truly passive movement, especially of the head. In a further attempt to indirectly assess the possible role of neck information in this study, we ran an individual who presented as normal, except that he had suffered bilateral damage to the his labyrinths due to the administration of gentamycin 5 years earlier. This subject was unable to distinguish between DK HM and LT HM or between CONST HM and ACC HM during either onside or on-back rotation. We conclude that while neck information is important to the control and appreciation of head movement, the present study has been adequately controlled such that neck kinesthesia is probably not sufficient per se to account for the effects we have described. Nevertheless, conditions that produce altered kinesthetic control of the neck can influence an individual's spatial awareness. Lackner and DiZio (1989, 1992) found that increasing the load to the head (with a mass) increased the disorientation and motion sickness evoked by CCC stimulation and by sinusoidal rotation under conditions where the vestibular stimulus was kept constant (Lackner and DiZio, 1989; 1992). Summary: Our results collectively support the notion that the presence of an earth-fixed visual reference prior to a CCC stimulus tends to attenuate the disorientation an individual feels. We have extended the reseal f Weave e 9tend research of Guedry and Benson (1978) Guedry (1978) to previously untested axesand of rotation and found that the visual reference will tend to be most helpful in attenuating the efctofasnl C simuswnth effects of a single stimulus when predominant plane CCC of stimulation of the the vestibular y a system . Our O r prior o etov the t ohead s indicate i movement d c te that ht is inn yaw. observations while the designers of centrifuge-based flight simulator profiles may not be too troubled by differences in visual-vestibular integration in one direction of rotation versus another, they will have to address differences that exist for one axis of rotation versus another. It may also be necessary to take into account the amount of experience the trainee has had with the CCC stimulus. This makes the problem of centrifuge-based flight simulation a difficult one, indeed. Fortunately, group trends are consistent, that is, whenever the reference is less helpful in attenuating
15-9
the effects of CCC stimulation, it still appears to be of some benefit.
ocular reflex. Experimental Brain Research, 64: 208-216.
ACKNOWLEDGMENTS This research was sponsored by the Naval Medical Research and Development Command under ONR grant number
Gilson, R. D., Guedry, F. E., Hixson, W. C., and Niven, J. I. 1973. Observations on perceived changes in aircraft attitude attending head movements made in a 2-g bank and turn. Aerospace
N0014/90/J/1549.
Medicine, 44: 90-92.
The views expressed in this article are this of the authors and do not reflect the official policy or position of the Department of the Navy, Department of Defense, not the U.S. Government. Volunteer subjects were recruited, evaluated, and employed in accordance with the procedures specified in the Department of Defense Directive 3216.2 and Secretary of the Navy Instruction 3900.39 series. These instructions are based upon voluntary informed consent and meet or exceed the provision of prevailing national and international guidelines. REFERENCES Baloh, R. W., Richman, L., Lee, R. D., and Honrubia, V. 1983. The dynamics of vertical eye movements in normal human subjects. Aviation, Space, and Environmental Medicine, 54: 32-38.
Graybiel, A., Wood, C. D., Miller, E. F., and Cramer, D. B. 1968. Diagnostic criteria for grading the severity of acute motion sickness. Aerospace Medicine, 39: 453-455. Guedry, F. E. 1970. Vision during angular acceleration considered in relation to aerospace operations. In: Stahle, J. (Ed.), Vestibular Function on Earth and in Space. Oxford: Pergammon. 27-34. Guedry, F. E. 1974. Psychophysics of vestibular sensation. In: Kornhuber, H. H. (Ed.), Handbook of Sensory Physiology. New York: Springer. Vol VI/2, 3-154. Guedry, F. E. 1978. Visual counteraction of nauseogenic and disorienting effects of some wholebody motions: A proposed mechanism. Aviation, Space, and Environmental Medicine, 49 (1): 36-41. Guedry, F. E., and Benson, A. J. 1970. Tracking performance during sinusoidal stimulation of the vertical and horizontal semicircular canals. In: Busby, D. E. (Ed.), Recent Advances in Aerospace Medicine. Dordrecht, Holland: Reidel. 276-288.
Barnes, G. R., Benson, A. R., and Prior, J. 1978. Visual-vestibular interaction in the control of eye movement. Aviation, Space, and Environmental Medicine, 49: 557-564. Benson, A. J., and Guedry, F. E. 1971. Comparison of tracking-task performance and nystagmus during sinusoidal oscillation in yaw and pitch. Aerospace Medicine, 42L 593-601. Cohen, B., Matsuo, V., and Raphan, T. 1977. Quantitative analysis of the velocity characteristics of optokinetic nystagmus and optokinetic afternystagmus. Journal of Physiology (London), 270: 321-344. Collins, W. E., and Guedry, F. E. 1967. Duration of angular acceleration and ocular nystagmus from cat and man. I. Responses from the lateral and vertical canals to two stimulus durations. Acta Otolaryngolica, 64: 373-387. Darlot, C., Lopez-Borneo, J., and Tracey, D. 1981. Asymmetry of vertical vestibular nystagmus in the cat. Experimental Brain Research, 41: 420-426.
Fetter, M., Hain, T. C., and Zee, D. S. 1986. Influence of eye and head position on the vestibulo-
Guedry, F. E., and Benson, A. J. 1971. Nystagmus and visual performance during sinusoidal stimulation of the vertical semicircular canals. NAMRL-1131. Pensacola, FL: Naval Aerospace Medical Research Laboratory. Guedry, F. E., and Benson, A.J. 1978. Coriolis cross-coupling effects: Disorienting and nauseogenic or not? NAMRL-1231. Pensacola, FL: Naval Aerospace Medical Research Laboratory. Aviation, Space, and Environmental Medicine, 49: 29-35. Guedry, F. E., and Correia, M. J. 1971. Vestibular function in normal and in exceptional conditions. In: Masterson, R. (Ed.), Handbook of Behavioral Neurobiology. NY-London: Plenum Press, Vol. 1: 353-407. Guedry, F. E., Norman, J. T., Turnipseed, G. T. and Rupert, A. H. 1990. Vestibular responses and motion sickness during pitch, roll, and yaw sinusoidal whole-body oscillation. NAMRL-1352. Pensacola, FL: Naval Aerospace Medical Research Laboratory.
15-10
Guedry, F. E., and Oman, C. E. 1992. Vestibular stimulation during a simple centrifuge run. NAMRL-1353. Pensacola, FL: Naval Aerospace Medical Research Laboratory.
Reason, J. T. and Diaz, E. 1970. The effects of visual reference on adaptation to Coriolis acceleration. FPRC Report 1303. London: Ministry of Defence (Air Force Dept.).
Hixson, W. C., and Niven, J. I. 1969. Directional differences in visual acuity during vertical nystagmus. NAMI-1079. Pensacola, FL: Naval Aerospace Medical Institute.
Young, L. R., Oman, C. M., and Dichgans, J. 1975. Influence of head orientation on visually induced pitch and roll sensation, Aviation, Space, and Medicine. 46: 264-268.
Kennedy, M. A., Lilienthal, K., Berbaum, S., Baltzley R., McCauley E. 1989. Simulator sickness in U. S. Navy Hight Simulators. Aviation, Space, and Environmental Medicine, 60: 10-16. Lackner, J. R. , and DiZio, P. 1989. Altered Sensory-Motor Control of the Head as an Etiological Factor in Space-Motion Sickness. Perceptual and Motor Skills, 68: 784-786. Lackner, J. R., and DiZio, P. Altered Loading of the Head Exacerbates Motion Sickness and Spatial Disorientation. Presented at Aerospace Medical Association meeting, May 10, 1992, Miami, FL. Lawson, B. D. 1993. Human physiological and subjective responses during motion sickness induced by unusual visual and vestibular stimulation. Doctoral Dissertation. NASA NGT 50306. Waltham, MA: Ashton Graybiel Spatial Orientation Laboratory, Brandeis University. Lestienne, F., Soechting, J., and Berthoz, A. 1977. Postural readjustments induced by linear motion of visual scenes. Experimental Brain Research, 28: 363-384. Matsuo, V., and Cohen, B. 1984. Vertical optokinetic nystagmus and vestibular nystagmus in the monkey: Up-down asymmetry and effects of gravity. Experimental Brain Research, 53: 197-216. Money, K. E., and Friedberg, J. 1964. The role of the semicircular canals in causation of motion sickness in the dog. Canadian Journal of Physiological Pharmacology, 42: 793-801. Money, K. E., and Scott, J. W. 1962. Functions of separate receptors of non-auditory labyrinth of the cat. American Journal of Physiology, 202: 12111220. Money, K. E., Mc Leod, M. E., and Graybiel, A. 1965. Effect of vision on the two directions of vertical post-rotatory nystagmus. Proceedings of The Canadian Federal Biological Society, 8: 13. Nutall, J. B. 1958. The problem of spatial orientation. Journal of the American Medical Association, 166: 431-438. Raphan, T., Matsuo, V., and Cohen, B. 1979. Velocity storage in the vestibulo-ocular reflex arc (VOR). Experimental Brian Research, 35: 229-248.
15-11
FIGURE 1 CUT-AWAY SIDE VIEW OF THE EXPERIMENTAL APPARATUS
t
oil
The subject is shown lying on his right side in this case. His head is resting on a hinged headrest in the center of rotation. His left hand is on the triggering device which causes his head to drop passively. Subjects were restrained at their heads, torsos, hips, and ankes during rotation. In certain experiments, the subject gazed at the enclosure prior to making the head movement.
15-12
FIGURE 2 TOP-DOWN VIEW OF THE TWO BODY ORIENTATIONS TESTED
In experiments 1A and 2B subjects were rotated while lyin on their right sides. In experiments 1B and 2B they were rotated while lying on their backs. Experiments 1A and 1B were run in darkness. Experiments 2A and 2B were run with the chamber illuminated prior to each head movement.
15-13
FIGURE 3 DESCRIPTION OF THE 4 EXPERIMENTS THAT COMPRISED THE CURRENT STUDY
EXPERIMENT
ROTATION AXIS
HEAD MOVEMENT
CW
S@tCCW 1A
BODY POSITION
HEAD MOVEMENT TOWARD GROUN
( (0-4
....... .
".PITCH" ROTATION
ON SIDE
Gz Earth
1B ~III~1I~
HEAD MOVEMENT TOWARD GROUND~
"-ROLL" ROTATION ON BACK Gz Earth
EXPERIMENT 1A: Subjects (n=16) were positioned ont their sides and accelerated in darkness at 15 dg/s2 to a constant velocity of 90 dg/s for 2 mins, then decelerated at 3 dg/s2 to a stop. They compared an earthward head movement made immediately upon reaching constant velocity (ACC HM) to a head movement performed after 1 minute of rotation at constant velocity (CONST HM). The Coriolis cross-coupling (CCC) stimulus was the same in either case, but the acceleratory information available to the vestibular apparatus was not (see Guedry and Benson, 1978). EXPERIMENT 1 B: The protocol of experiment 1A was followed with subjects (n=16) lying on their backs. EXPERIMENT 2A: Subjects (n=16) were positioned on their sides and accelerated at 3 dg/s2 to 90 dg/s for 2 mins, then decelerated at 3 dg/s2. They compared a head movement after 1 minute of rotation in the dark (DK HM) to a head movement made (in the dark) after rotating for 1 minute while viewing the illuminated interior of the polka-dotted chamber (LT HM). The CCC stimulus was the same in either case, but visual information about the rotation was available to the vestibular nucleus during the LT HM (see Guedry, 1978). EXPERIMENT 2B: The protocol of experiment 2A was followed with subjects (n=16) lying on their backs.
15-14
TABLE 1 SUMMARY OF RESULTS FROM GUEDRY AND BENSON (1978),
GUEDRY (1978), AND THE CURRENT STUDY Freq. During
Experiment
Sample
Freq. Unanimous
1st Comparison
PAST STUDIES:
During 4 Repeated
Comparisons Frequency reporting
CONST HM more disorienting than ACC HM
Upright in the Dark -- Guedry and Benson (1978) n = 12
100%
n.a. Frequency reporting
DK HM more disorienting
than LT HM Upright with Visual Reference -- Guedry (1978) "Schedule 1" "Schedule 2"
n= 16 n= 6
81 % 100 %
PRESENT STUDY:
n.a. n.a. Frequency reporting CONST HM more disorienting than ACC HM
Experiment 1A -On side in dark
n =16
94%
88%
Experiment 1 B -On back in dark
n= 16
63%
38% Frequency reporting DK HM more disorienting than LT HM
Experiment 2A -On side with a visual reference
n = 16
81%
31%
Experiment 2B -On back with a visual reference
n= 16
63%
38%
Experiment 3 -Upright with a visual reference
n = 13
92 %
n.a.
16-1
Some Side-effects of Immersion Virtual Reality E C Regan Special Psychology Research Group, Army Personnel Research Establishment, Ministry of Defence, Famborough, GU14 6TD, United Kingdom
SUMMARY Virtual reality (VR) has become increasingly well-known over the last few years. However, little is known about the side-effects of prolonged immersion in VR. The main study described in this paper set out to investigate the frequency of occurrence and severity of side-effects of using an immersion VR system. Out of 150 subjects 61% reported symptoms of malaise at some point during a 20 minute immersion and 10 minute post-immersion period. These ranged from symptoms such as dizziness, stomach awareness, headaches, eyestrain and lightheadedness to severe nausea. Some research which has been conducted which attempted to identify those factors that play a causative role in the side-effects of the VR system is discussed. Finally, some areas for future research are highlighted,
1
BACKGROUND
Immersion VR has become increasingly well-known over the last few years. In an immersion VR system the user wears a headset which projects the virtual world, usually through two Liquid Crystal Displays (LCDs) which are mounted in the headset, and presents the illusion of actually being present in, or immersed in, the virtual world. Several companies, primarily in the UK and the US, now manufacture and supply VR systems, and the market for such systems is developing. With this developing market a whole host of applications for VR systems ranging from military training to medical practice - have been suggested. Many current simulators have side-effects on users. The most prevalent side-effect of modern simulators is 'simulator sickness' which occurs with many high performance simulators. Incidents of simulator sickness have been reported since 1957 when Havron & Butler (1) provided the first account of simulator sickness in aircraft simulators. Symptoms of simulator sickness are often similar to those of motion sickness, but generally affect a smaller proportion of the exposed population and are usually less severe. There is a possibility that similar sickness may occur with immersion VR systems. Furthermore, given other characteristics of immersion VR systems such as low resolution, display update lags, and full visual immersion in VR, side-effects such as visual problems and problems of disorientation and dizziness may be more likely to occur. However, at present there appears to be no documented literature concerning this.
The primary aim of the study which will be described next was therefore to document the frequency of occurrence and severity of side-effects of immersion in a VR system.
2
HARDWARE AND SOFTWARE
Hardware 2.1 A PROVISION 200 immersion VR system was used. This is a VR development platform based on Intel i860s and dedicated image generation processors. It can be expanded for multiple VR peripherals and multiple participants. A Virtual Research Flight Helmet was used to present the visual information. The Flight Helmet uses LCDs each with a resolution of 360 x 240 pixels. The field of view of the Flight Helmet is approximately 110' horizontally by 60' vertically. A 3D mouse was used for interaction with the system. This is a 60 of freedom pointing device that allows the user to move forward and backwards, pick up and manipulate objects. Both hand and head position were tracked using a Polhemus Fastrak tracking system. Software 2.2 For each subject the virtual world consisted of a corridor off which there were several doors leading into rooms. The subject was able to go into all of these rooms, and whilst in a room was able to interact with the objects in the room (for example, by picking them up and moving them). The rooms all contained different objects. One room, for example, contained a large chess board with pieces, and another contained a bar with bar stools and television with remote control unit. Each subject was given information about each room entered, and the ways in which the items in the room could be interacted with. Every attempt was made to ensure that all subjects underwent similar experiences in the virtual world. The photograph below shows an individual immersed in virtual reality. The virtual world can be seen on the monitor.
Presentedat an AGARD Meeting on 'Virtual Interfaces: Research and Applications', October 1993.
16-2 Figure 1: The PROVISION 200 virtual reality system
3
METHOD
One hundred and fifty subjects participated in the experiment. They consisted of 80 civilian subjects, 20 military subjects, and 50 firefighters. There were 106 male and 44 female subjects. Each subject was tested individually. The experiment lasted for approximately one hour per subject.
on the subject's head. The helmet was tightened and was then switched on. The stopwatch was started and the subject was told to proceed through the virtual world. After twenty minutes the helmet was switched off and removed.
4
RESULTS
Of the 150 subjects, 4 were excluded from the analyses. The subjects initially completed a 27 item symptom checklist (2), frequently used in simulator sickness research. This was also completed at the end of the immersion period. Each subject was then immersed in the VR system for twenty minutes. Prior to the immersion the system was calibrated to the height of each subject, and the principles of the system and interaction with the system were explained to the subjects. A malaise scale was also described to the subjects and they were informed that they would be asked to rate themselves on this scale at 5 minute intervals during the twenty minute irmnersion period, and at 5 and 10 minutes post-immersion. The malaise scale had six categories as follows:1 = No symptoms 2 = Any symptoms, but no nausea 3 = Mild nausea 4 = Moderate nausea 5 = Severe nausea 6 = Being sick A pre-immersion rating on the malaise rating scale was given by each subject and then the VR helmet was placed
These subjects had reported some symptoms at the preinunersion rating on the malaise scale, and were thus not regarded as being in their normal state of health. Consequently the analysis of the data was carried out for 146 subjects. 4.1 Malaise scale results Eight subjects withdrew from the experiment (4 of these were civilian subjects and 4 were firefighters). These subjects withdrew due either to severe nausea or severe dizziness. For the purposes of the analysis, those subjects who did withdraw during the experiment were given subsequent immersion ratings on the malaise scale which were equal to the rating on which they withdrew. This was felt to be a conservative approach to predicting the missing immersion ratings, given the likelihood of these subjects reporting increasingly higher ratings had they not withdrawn. The post-immersion ratings (5 minutes postirmmersion and 10 minutes post-immersion) were scored as missing for these subjects. The pie chart below illustrates the percentage of subjects reporting each of the ratings on the malaise scale as their highest across the full immersion and post-immersion period.
16-3 Figure 2 : Percentage of subjects reporting each of the malaise scale ratings as their highest
EINo symptoms UAny symptoms,no nausea EMild nausea * Moderate nausea
E]Severe
39%
nausea
33%
7
2% 5% 21%
As can be seen from this graph, 61% of the subjects reported ratings greater than 1 as their highest at some stage in the study. Only 39% reported a rating of 1 throughout.
The first bar chart below illustrates the frequency of occurrence of each of the ratings on the 1-6 malaise scale at each of the seven time periods. The ratings are illustrated on the legend for the graph. Ratings of 2 were most commonly associated with dizziness, stomach awareness, headaches, eyestrain, and lightheadedness. The second bar chart presents the data with all the ratings of greater than 1 combined. This illustrates more clearly the progression of symptoms with increasing immersion time.
16-4
ElJNo symptoms
- - - - - - - -
- - - - - -
OAny symptoms,no nausea
EModerate nausea
150 140
Esevere nausea
130
SEBeing sick
1 2 0--
~Mild nausea
----------- -------
110' 100 90 Number of subjects
80
70'--60 50 40' 30 20' 100
---
---
za
0v
0
,
5
10 15 20 (minutes) Time
5 10 os pot
Figure 3 Frequency of ratings on the malaise scale for all subiects
ElNo sym ptom s-FAII other symptoms
150---1404
- -- - - - - - - - - - - - - - - - --- ---------------- ------------
100 90 Number of subjects 80
70 60' 50 40'
10
post post Time (minutes) Figure 4 Frequency of ratings on the malaise scale for all subjects (ratings of I and greater than I illustrated')
16-5 The pattern of reported symptoms across the time periods was very similar for the three groups of subjects - civilian, military and firefighters. A series of analyses of variance were carried out on the data for the groups of subjects in order to see if there were any significant differences between the three groups in terms of ratings on the malaise scale across the immersion and postimmersion periods. These all yielded non-significant results suggesting no significant differences between the three groups of subjects. 4.2 Pre-immersion and post-immersion symptom checklist results Following the standard procedure of Kennedy et al (1993) (2), 16 of the questions on the pre-immersion and postimmersion symptom checklists were scored. Scoring the data in this way yields three subscales - Nausea, Oculomotor and Disorientation - and a Total Severity measure,
According to Kennedy, scores on the Nausea subscale are based on the report of symptoms which relate to gastrointestinal distress such as nausea, stomach awareness, salivation and burping. Scores on the Oculomotor subscale are based on the report of symptoms such as eyestrain, difficulty focusing, blurred vision and headaches. Scores of the Disorientation subscale are related to vestibular disarrangement such as dizziness and vertigo. The standard procedure is to consider the post exposure profile because of the assumed poor reliability of the difference/change scores that would result from analysis of both pre and post exposure data. However, in view of the large number (54%) of the 146 subjects in this study that reported symptoms on the pre-immersion symptom checklist (this is much higher than other studies of simulator sickness), change score profiles as well as post score profiles were produced. These profiles are illustrated below.
Figure 5 : Pre-immersion. post-immersion and change profiles for all subjects
Mean scale score
D Nausea El Disorientation
20
U Total
.. .. ... .. ... .
. . . . . . . ..
REOculo mo to r Sickness Score 15
10
5
Pre
Post
Change
16-6 The profiles were very similar for the three groups of subjects in terms of the pattern and magnitude across the subscales. These profiles suggest that, with the PROVISION 200 system, nausea is the most significant problem, followed by disorientation and then oculomotor problems.
5.
DISCUSSION
This data would enable the side-effects of the VR system used in this study to be compared with the side-effects of other VR systems and other simulators assessed using the same material. The results from this study suggest a high incidence of self-reported malaise resulting from the use of the immersion VR system. The incidence did not differ in a statistically significant manner for the three groups of subjects employed in this study, which suggests that the results found in this study can be generalized to most subject populations. However, there are two reasons why the data must be treated with a degree of caution. Firstly, it must be stressed that the level of symptoms reported in other VR systems may be higher or lower than the level reported in this system. The data presented here can only be cited wit*h reference to the PROVISION 200 VR system with the peripherals used in this study, although the data may be suggestive of a more general incidence of malaise likely to occur with the use of all current VR systems. Secondly, the present experimental procedure could be viewed as having encouraged subjects to dwell on their internal states, and, through constant prompting, to report symptoms that might otherwise have gone unobserved (it is interesting to note in this context that 54% of the subjects reported symptoms on the pre-immersion symptom checklist), Notwithstanding these reservations, however, it would appear that adverse side-effects are sufficiently common to threaten the success of further studies using the VR system and of applications for the technology in its present state of development - 61% of the subjects in the present sample reported some symptoms of malaise which ranged from symptoms such as headaches and eyestrain to severe nausea; 5% of the subjects had to withdraw from the experiment due to severe nausea or severe dizziness, Consequently some further research has been conducted which has attempted to identify those factors that play a causative role in the side-effects of the VR system. This will be discussed next. This will be followed by a discussion of some areas for future research. 5.1 Further research Interaction with the environment Whilst every attempt was made in the experiment detailed above to ensure that all subjects underwent similar experiences during their immersion, differences between subjects in terms of behaviour whilst in the virtual world inevitably occurred. Subjects were free to control their head movements and their speed of interaction with the system. Consequently some subjects clearly moved more slowly and cautiously through the virtual world than others and made fewer head movements. These 'cautious' subjects frequently reported that they would have felt more nauseous had they engaged in more rapid movements. Thus they
appeared to have developed coping strategies which enabled them to tolerate the system for the given time period. Interestingly it has been reported that pilots may develop strategies such as restricting head movements to reduce simulator sickness symptomatology. The extent to which encouraging pronounced head movements and rapid interaction with the system may produce increased nausea was investigated by requiring a new group of 44 subjects who did not take part in the previous study to undergo a fixed set of actions whilst in the VR system. This set of actions was designed to maximise head movements and speed of interaction with the system. The immersion lasted for 10 minutes. The malaise scale ratings of these subjects were compared with the malaise scale ratings of the subjects in the previous study (up to the 10 minute period) who were free to control their head movements and speed of interaction with the system. However, analyses of variance on the data for the two groups yielded non-significant results at the 5% level (even when the subjects scoring 1 (no symptoms) throughout were removed from the analyses). However the analysis at 5 minutes was significant at the 10% level. It would appear therefore that no statistically significant difference in malaise scale ratings occurs at the 10 minute immersion point between subjects who are engaging in pronounced head movements and rapid interaction with the system and subjects who are making head movements at their will and moving at their own speed. At 5 minutes some differences may exist. Thus whilst pronounced head movements and rapid interaction may initially cause higher levels of symptoms, subjects appear to adapt to these requirements at 10 minutes. It would consequently appear that factors other than subjects' method of interacting with the virtual environment must be largely responsible for the level of side-effects reported. Sitting versus standing 28% of the subjects in the study detailed above were found to experience mild, moderate, or severe nausea. Such nausea is a classic symptom of simulator sickness, which is frequently acknowledged as having much in common with motion sickness. We are quite accustomed to motion sickness inducing situations (ie. situations in which information presented to the visual and vestibular systems is contradictory) when seated (eg. in cars and trains) but not when standing up. In addition, when standing up and interacting with the virtual environment subjects have the facility to make natural walking movements (within a restricted area) as well as movements via the 3D mouse. Some people in the previous study took advantage of this facility and frequently made small physical movements. Such movements may act as a source of confusion when made in conjunction with movements via the 3D mouse and may partly contribute to subjects' experience of adverse sideeffects such as dizziness and disorientation. On the other hand, however, such movements may provide useful kinaesthetic and vestibular cues to body position and movement which may attenuate such adverse side-effects.
16-7 Consequently it is possible that seating subjects during a VR immersion may affect levels of reported malaise. 44 subjects were immersed in the VR system for 10 minutes. 24 subjects stood during their immersion and 20 subjects were seated. However, analyses on the data for the two groups yielded non-significant results (even when those scoring 1 (no symptoms) throughout were removed from the analyses) suggesting no significant difference between the two groups of subjects in terms of their ratings on the malaise scale across the immersion period, It would appear, therefore, that no statistically significant difference in malaise scale ratings occurs between subjects who are standing during their immersion and subjects who are sitting during their immersion. Inter-pupillary distance 33% of the subjects who experienced symptoms in the initial study reported ocular associated problems - these were eyestrain, difficulty focusing, blurred vision, headaches and visual fatigue. In the PROVISION 200 system the two LCDs in the headset are a fixed distance apart, with the difference between the images projected to these LCDs set in the software to the average male inter-pupillary distance. The experimental hypothesis was that the subjects who did report ocular problems in the previous study would be those with the greatest inter-pupillary distance deviations from the fixed system configuration. The inter-pupillary distance of 50 of the subjects in the initial experiment was measured using an inter-pupillary distance ruler. The hypothesis was not found to be supported for the group of 50 subjects as a whole. The only significant finding was related to subjects with an inter-pupillary distance less than the system configuration (which was the majority of subjects). For these subjects there was some suggestion that those subjects with ocular problems did have the greatest deviations from the system configuration. 5.2 Future research Movement in the virtual environment One of the areas for future research concerns subjects' method of movement through the virtual environment. It is likely that the method of movement in the virtual world, via the 3D mouse, makes a significant contribution to the level of reported nausea. It produces a classic motion sickness type situation in which the inputs of the visual, vestibular and kinaesthetic systems are incongruent with each other and previous experience - the visual system suggesting body movement and the other systems suggesting a static body position. The contribution of the method of moving through the virtual world to the reported nausea could be investigated by facilitating more natural methods of movement through the virtual world. One possibility would be to couple subjects' movements on a treadmill to their movements through the virtual world. This would allow subjects to actually walk through a virtual environment thus providing them with all the normal vestibular cues to movement. Levels of nausea would be
expected to fall in such a situation. Habituation A second area for future research concerns the issue of habituation to the side-effects of immersion in VR. Immersion in VR is an unusual and novel experience. It takes some time to become accustomed to wearing the VR Flight Helmet and to the methods of movement and interaction with the virtual environment. It is possible that repeated immersions in the VR system will produce a decrease in side-effects as subjects become more accustomed to, and confident about, interaction with the system. Clearly there would also be the possibility of a systematic desensitization occurring with repeated exposure. Further research could address the issue of whether subjects will habituate with repeated immersions in VR. There is some suggestion that habituation may lead to reduced symptoms during immersion, but greater levels of post-immersion symptoms. After effects of simulator exposure have been observed in experienced simulator users. Consequently it would be appropriate for research investigating habituation effects to assess levels of malaise amongst subjects over longer post-immersion periods than those employed in the first study reported. Levels of concentration Finally, some evidence appears to suggest that concentration levels are related to severity of simulator sickness, with relatively greater degrees of concentration being associated with relatively lower levels of sickness. Some subjects appeared to have to concentrate more than others during the immersion, particularly when using the 3D mouse to pick up and manipulate objects. The effect of varying levels of concentration on adverse side-effects of the system could be experimentally investigated. Clearly if increasing concentration does reduce the severity of sideeffects of the system then any further uses of the technology for experimental research purposes or for particular applications should attempt to maximize the concentration levels of the users. Research into these issues would provide further information on the side-effects of immersion in VR reported, and may help in the identification of methods of reducing these side-effects.
6.
CONCLUSION
In conclusion, the main study described in this paper set out to investigate the frequency of occurrence and severity of side-effects of using an immersion VR system. The results of this study suggested that adverse side-effects are sufficiently common to threaten the success of further research using VR and of applications for the technology in its present state of development. Some further research has consequently been conducted which attempted to identify those factors that play a causative role in the sideeffects of the VR system. This research and areas for future research have been discussed.
British Crown Copyright 1993/MOD Published with the permission of the Controller of Her Britannic Majesty's Stationary Office
16-8 7.
REFERENCES
I.
Havron M D & Butler L F, 1957: Evaluation of training effectiveness of the 2FH2 helicopter flight trainer research tool. Naval Training Device Center, Port Washington, New York, NAVTRADEVCEN 1915-00-1.
2.
Kennedy R S, Lane N E, Berbaum K S & Lilienthal M G A, 1993: Simulator sickness questionnaire (SSQ): a new method for quantifying simulator sickness. International Journal of Aviation Psychology, 3 (in press).
17-1
VISUAL ACCOMMODATION TO VIRTUAL IMAGE DISPLAYS WHEN KNOWLEDGE OF OBJECT DISTANCE CONFLICTS WITH OPTICAL DISTANCE by
John C. Kotulak, Stephen E. Morse and Roger W. Wiley US Army Aeromedical Research Laboratory PO Box 577 Fort Rucker Alabama 36362-0577 United States SUMMARY
INTRODUCTION
In virtual image displays, the image is typically at or near optical infinity, while the object may be at any distance. This can create a conflict between the known distance of a target and its optical distance. If accommodation is drawn to the known distance of the object rather than the optical distance of its image, considerable retinal image blur can result. To determine whether this actually occurs, we measured the accommodation of seven young adult subjects with a dynamic infrared optometer. The subjects viewed a collimated virtual image of a target monocularly through third generation night vision goggles (ANVIS). Although the target itself was positioned randomly at either 6.0, 1.0, 0.5, or 0.33 m from the observer, its image was maintained at infinity by compensatory adjustments of the ANVIS objective lens. The observer was aware fully of the actual distance of the target. A simulated clear starlight night sky condition was used in order to degrade image quality such that the accommodative feedback loop was "semiopen," an intermediate state between the closed and open loop conditions of previous experiments, The results show that for some subjects, knowledge of object distance is a more powerful cue for accommodation than the image's optical distance; however, for the majority of subjects, this is not the case. The subjects who were susceptible to the knowledge of object distance cue reported severe blur when the object was nearby. We also found that these same subjects, i.e., the susceptible ones, tend to have a more proximal dark focus than those whose accommodation is not influenced by knowledge of object distance. The linkage between dark focus and susceptibility to proximal influences has not been previously demonstrated and needs to be explored further.
During ordinary viewing, the observer typically sees a real object, and a clear image of this object is formed on the observer's retinas. The process of changing the focus of the eyes such that the retinal images remain clear at varying viewing distances is called "accommodation." Accommodation is guided by both physiologic and psychologic stimuli. Retinal image blur is the principal physiologic stimulus (1), and perceived object distance is the principal psychologic stimulus (2). Normally, retinal image blur and perceived distance act in harmony in that when both cues are available, accommodation is more accurate than when only one of them is present (3). However, under virtual reality conditions such as in flight simulators or in aircraft equipped with helmet mounted displays, a mismatch can occur between retinal image blur and perceived distance. This is because the observer no longer sees the real world, but instead views an optical image of the world. Although the image typically is placed at or near optical infinity, it may convey a psychological sense of nearness. This sense of nearness may derive from the object which is being imaged, if the object is something that the obser'ver would expect to find close by, such as the flight controls in a simulator (4). The sense of nearness also could derive from the close proximity of the display to the eye. Under optimal conditions accommodation can deal effectively with the mismatch between conflicting physiologic and psychologic cues (5-7). Such conditions are referred to as "closed loop," which describes the state of the negative feedback loop of the accommodative control system when target contrast and luminance are high, and when the quality of the
Presentedat an AGARD Meeting on 'Virtual Interfaces: Research and Applications', October 1993.
17-2
retinal image is not degraded otherwise. Under closed loop conditions, the physiologic cues predominate over perceived nearness and the retinal image remains clear when there is a conflict between cues (5-7). When cues from retinal image blur are removed, such as by increasing the depth of focus of the eye by viewing through a small artificial pupil, the situation is quite different. When this happens, the perceived nearness of the target is highly influential in determining the level of accommodation (3, 8, 9). Such conditions are referred to as "open loop" because negative feedback information about retinal image blur is denied to the accommodative control system. During the viewing of virtual reality displays, however, the accommodative loop is probably neither completely closed nor open, but rather "semiopen." The semiopen loop state is the result of the limited spatial resolution that is found in such displays, and perhaps due to reduced luminance and contrast, and the presence of dynamic visual noise. These characteristics result in decreased accommodative accuracy (10), presumably because they make it difficult for the visual system to detect retinal image blur, and thus respond to it by changing accommodation.
display under night sky conditions. The night vision goggle image creates the semiopen loop condition which we desired for this experiment because of its relatively low luminance (1 cd/m 2 ), its low spatial frequency content (the -3 dB rolloff of the spatial modulation transfer function is at 5 cycles/degree), and the presence of uncorrelated dynamic visual noise (11). The night vision goggle display luminance was achieved by adjusting the ambient luminance to the level of clear starlight. The visual stimulus was a Bailey-Lovie visual acuity chart. Due to its design, this chart provides targets of the same visual angle at each test distance that was used in the experiment (6, 1, 0.5, and 0.33 m). The Weber contrast of the letters on the chart, when viewed through the night vision goggles, was 65 percent. Accommodation was measured monocularly under steady-state conditions with a dynamic infrared optometer. The steady-state values were calculated from the mean of 600 samples (20 samples/sec X 30 sec/trial). In addition to measuring accommodation during instrument viewing, we also measured accommodation in complete darkness. The so-called dark focus of accommodation is the resting point of the accommodative control system (12).
Our purpose in the present study was to determine the extent to which accommodation is influenced by psychological factors under viewing conditions similar to those found in virtual reality systems. To do so, we performed an experiment in which accommodation was measured during viewing through an optical instrument which creates the semiopen loop condition that is typical of virtual reality displays. In this experiment, we created a conflict between cues from retinal image blur and perceived distance by varying target distance over a wide range, while holding the image of the target constant at optical infinity.
Object distance was varied randomly over the test range, while image distance, size, luminance, and contrast were held constant. The instrument eyepieces were set to 0.0 D and the objective lenses were focused for the object distance. The subject was informed of object distance and was instructed to observe as the test distance was measured out. The subject's task was to view through the instrument and keep threshold-sized letters clear. Seven young adult volunteer subjects were used. All subjects were either 20/20 or corrected to 20/20 for the target distance, and were free from eye disease or other ocular
METHODS
anomalies.
The optical instrument was a pair of night vision goggles (ANVIS), which are unity magnification devices that electronically amplify ambient light and provide a photopic visual
RESULTS Figure 1, in which each plot represents a different subject, shows how instrument accom-
17-3
modation varied with object distance. Negative values of accommodation represent accommodation which is less than that required to fully compensate for a hyperopic refractive
C
error. The subjects seem to fall into two dis-
°
tinct groups, that is, those affected by changes in object distance (n = 2), and those unaf-
E
fected (n = 5). The affected subjects readily
perceived target blur at the nearer object distances, but reported that they were unable to n =7
0
Susceptible
0
Not susceptible
2 2
0 -_
.
Object distance ()
0
Figure 2. Accommodation as a function of object distance when the subjects are grouped according to susceptibility to
E
proximal cues.
S2
01
E o
0
U ___-________
_ -1
, 0
,showed
,, 1
2
-
3
4
Object diance (D
Figure 1. Accommodation as a function of object distance when the data of each subject are shown individually,
is predictable from earlier works which no proximal effect for closed loop conditions, but a pronounced effect for open loop conditions. Perhaps more significant is that the proximal effect appears to be all or none, rather than graded. This is not predictable from previous studies, and neither is the apparent relationship between susceptibility to the proximal effect and dark focus magnitude. Current theory does not explain why individuals with proximal dark focuses should be more susceptible to perceived nearness than individuals with distal dark focuses.
eliminate the blur. In Fig. 2, the responses of the subjects within each group are averaged, and the mean dark focus of each group is shown. The error bars indicate one standard deviation. The dotted line with arrow indicates the mean dark focus of the susceptible group, while the solid line with arrow indicates the mean dark focus of the nonsusceptible group. Thus, the group with the more proximal dark focus is the one that was affected by changes in object distance.
Caution must be used in extrapolating from the results of the present experiment to most existing virtual reality systems. This is because virtual reality displays are typically binocular, and our experiment was done under monocular conditions. Under binocular con-
The subject who exhibited the most suscept-
ditions, accommodation tends to be more accurate, and probably less susceptible to psy-
ibility to the effect of object distance was retested on a subsequent day. There was no statistically significant difference in instrument accommodation for this subject between the 2 days (t = 1.23, p = 0.31). In addition, the dark focus of each subject was measured immediately pre- and posttest. There was no evidence of a change in dark focus (t = 0.33, p = 0.75).
chological influences, than under monocular conditions. This is due to "vergence accommodation," which is present under binocular but not under monocular conditions. However, the effects of vergence accommodation vary among subjects, so that subjects in whom vergence accommodation plays little or no role may be influenced by perceived nearness even during binocular viewing.
DISCUSSION REFERENCES Our results indicate that knowledge of object distance can influence the level of accommodation under semiopen loop conditions. This
1. Campbell, F. W., and Westheimer, G., "Factors Influencing Accommodation Re-
17-4
sponses of the Human Eye," J. Opt. Soc. Am., 48, 1960, pp 568-571.
gence Eye Movements?" Arch. Ophthalmol., 60, 1958, pp 355-357.
2. Ittelson, W.H., and Ames, A., "Accommodation, Convergence, and their Relationship to Apparent Distance," J. Psych., 30, 1959, pp 43-62.
8. Rosenfield, M., and Gilmartin, B., "Effect of Target Proximity on the Open-loop Accommodative Response," Optom. Vision Sci., 67, 1990, pp 74-79.
3. Kruger, P.B., and Pola, J., "Dioptric and Non-dioptric Stimuli for Accommodation: Target Size Alone and with Blur and Chromatic Aberration," Vision Res., 27, 1987, pp 555-567.
9. McLin, L. N., Schor, C. M., and Kruger, P. B., "Changing Size (Looming) as a Stimulus to Accommodation and Vergence," Vision Res., 28, 1988, pp 883-898.
4. McCauley, M. E., and Sharkey, T. J., "Spatial Orientation and Dynamics in Virtual Reality Systems: Lessons from Flight Simulation," in "Proceedings of the Human Factors Society 35th Annual Meeting," 1991, pp 13481352. 5. Hennessy, R. T., "Instrument Myopia," J. Opt. Soc. Am., 65, 1975, pp 1114-1120. 6. Morgan, M. W., "Accommodation and Convergence," Am. J. Optom. Arch. Am. Acad. Optom., 7, 1968, pp 417-454. Alpern, M., "Vergence and Accom7. modation: Can Change in Size Induce Ver-
10. Kotulak, J. C., and Schor, C. M., ""The Effects of Optical Vergence, Contrast, and Luminance on the Accommodative Response to Spatially Bandpass Filtered Targets," Vision Res. 27, 1987, pp 1797-1806. 11. Riegler, J. T., Whiteley, J. D., Task, H. L., and Schueren, J., "The Effects of Signal-tonoise Ratio on Visual Acuity through Night Vision Goggles," U.S. Air Force Armstrong Laboratory Technical Report No. AL-TR1991-0011, 1991. 12. Leibowitz, H. W., and Owens, D. A., "Anomalous Myopias and the Intermediate Dark Focus of Accommodation," Science, 189, 1975, pp 646-648.
Human use: Human subjects participated in these studies after giving their free and informed voluntary consent. Investigators adhered to AR 70-25 and USAMRDC Reg 70-25 on Use of Volunteers in Research.
18-1
Low Cost Software-Based Rendering and Stereoscopic Interfaces for Teleoperation and Virtual Reality Dave M. Stampe SR Research 55 Oakmount Rd. Ste. 1108 Toronto, Canada M6P 2M5
[email protected] Julius J. Grodski DCIEM, Toronto, Canada
SUMMARY Many interface systems require generation of 3D graphics, whether as the entire display in virtual reality systems or as an overlay on live video in teleoperation. Costs must be kept low to make such systems practical, but real-time response speed must not be sacrificed,
time stereoscopic computer graphics is a capability that is much more recent then stereoscopic video, as twice the drawing rate or a second set of rendering hardware is required to produce both eye's views. Stereoscopic computer graphics are an essential part of Virtual Reality (VR) applications, while in teleoperation it is advantageous to have the capability to overlay stereoscopic computer graphics on stereoscopic video. Computer-generated imagery has seen limited use in teleoperation due to the cost and limited power of graphics generators and workstations capable of producing real-time threedimensional graphics. Stereoscopic graphics are rarely used, as they are expensive in terms of computer resources and require careful attention to real and virtual (computer setup. ra graphicsrsi ulated) cam
Described here is a very low-cost rendering and VR support package for 386 and 486 PCs, which requires no added hardware to achieve real-time drawing rates (20 to 60 It includes integral support for frames per second). generation and display of stereoscopic graphics in many formats, including field-alternate displays using LCD displays. shutter glasses, and wide-angle head-mounted Many common PC interface devices are supported, including mouse, joystick, 6D pointing devices, and head 2. Augmented Teleoperation trackers. Inexpensive PC multimedia cards allow output to be Early uses of stereoscopic computer graphics in Inexprednsiv P a cardsoallowroutputo videoincluteleoperation beve focused on the simulation of a manipulator recorded on a VCR, or overlaid onto live video, including operating in a remote task environment [1,2,3]. Fully stereoscopic TV images from teleoperated remote cameras. immersive systems using head-mounted displays (HMD), Full source code is available, allowing the software to be such as the Virtual Reality Systems [4] and the Virtual customized for any application. Interface Environment Workstation (VIEW) [5,6] were 1. Introduction
state of the art as of the mid-late 80's, and inspired the development of totally computer-generated virtual environments, as in today's VR systems.
Generation of three-dimensional computer graphics is a basic requirement of many computer interfaces, from CAD design tools to scientific visualization and virtual reality (VR). Such graphics range from simple wireframe drawings to photorealistic raytraced images used in computer art and movies. The most demanding of all computer graphics applications are those that require images to be produced in real time, such as flight simulators and VR. Expensive special-purpose hardware is often needed to achieve required drawing speeds of 10 to 60 frames per second.
Concurrently, low-budget methods involving the combination of remote stereoscopic video and real-time computer graphics were evolving [7,8]. The graphics were generated by a Commodore Amiga computer, which used a M68000 processor and included custom graphics hardware ped iefra ndeing. A ge apokcoerlyddvic to allowed display of the graphics overlaid on stereoscopic video on the computer monitor, and LCD glasses were used remotero two view the image. Vid o and color CCD cameras, and could be recorded for later analysis.
In applications where depth judgments are important, stereoscopic imaging of live video or computer-generated graphics is advantageous. It requires the generation of suitable left and right eye images from two video cameras or by the computer such that when viewed by an observer, they simulate the process of left/right "live" viewing of the environment. The observer interprets differences between the left and right eye images as depth information in the scene.
Although the Amiga was the fastest low-budget solution for real-time stereoscopic graphics available at the time, more imaging power was needed to render complex moving images. Advanced hardware such as the Silicon Graphics IRIS graphics workstations have been used more recently in the work at the Jet Propulsion Laboratory [9] and at the University of Toronto [10,11], but at a substantial increase in system cost. One advantage of the IRIS for graphics
Stereoscopic imaging using video has been in use for decades in the field of teleoperation and telerobotics. Real-
generation is that extensive graphics support libraries are available, whereas the Amiga software had to be written by hand.
Presented at an AGARD Meeting on 'Virtual Interfaces: Research and Applications', October 1993.
18-2
3. Low-Cost Rendering Systems The most common personal computer in use today is the IBM PC family: there are almost 10 times as many IBM PC compatible computers in use as any other design. The newer designs based on Intel i386 and i486 processors (and the latest Pentium processor) have computational power exceeding many low-end workstations. There is a very large base of programming talent available for these machines, and therefore this would be the ideal platform for development of graphics systems. Until recently, there was little general-purpose three-dimensional tools and no real-time graphics software available rendering for these machines. no ealtim oftareavalabe grphis or hes mahins. The PC is a difficult platform for real-time graphics due to its hardware design, and the techniques needed were proprietwary todeoig, gamdthe autehorqus andweril developers.
much of this must be coded in assembler to achieve the needed speeds. The renderer project was undertaken by D. Stampe and B. Rochl [13] and evolved into the REND386 graphics and VR programmer's toolkit. The software is written in assembler and C, and runs on 386 or 486 PCs. A math coprocessor is not required.
4.2 3D Renderer The core of REND386 is a real-time 3D graphics renderer, written in assembler and C. It consists of a highly optimized softwaretransformations, pipeline whichclipping, performs visibility testing, coordinate lighting, and depth sorting of polygons. Drawing of polygons is dephorted of plygs. Drawingo polygos is performed by display-specific software video drivers, which also support display operations such as image clears, copies, and display of text. The standard drivers support the PC-standard VGA card in 320 by 200 pixel resolution, which is ideally suited to the resolution of most headmounted displays. Some users have written drivers to support higher resolution displays or graphics accelerator boards. The renderer is implemented entirely in software, and its
Ideally, a low-budget rendering system for general purpose use would be based on the 386 or 486 IBM PC, would require little or no special hardware, and would allow substantial modifications to be made by the programmer. This would require the availability of most or all of the source code, and enough information to write support software for newabl interface andimge displayt devices. It should be performance dependsdriver on theand speed of card the computer on todra inrea tie: eas 10fraes er the type of video VGA used. Aandvery able to draw images in real time: at least 10 frames per powerful yet inexpensive graphics generation system may second. Photorealistic rendering and high resolution may be sacrificed to achieve drawing be built for US$2000, using a 66The MHzsystem i486DX2 wireframe graphics should bethese avoided at they speeds, decrease but 3D processor andunder a local-bus VGA card. can depth cues such as interposition. Software support for achieve rendering speeds of over 15,000 cosine-lit polygons generation of stereoscopic graphics and drivers for common per second, drawing a minimum of 35 frames per second stereoscopic display devices i s n is is oneof with up to 500 polygons visible on screen. This speed is 3p dsufficient to allow generation of both left and right eye the most difficult and least-documented aspects of images on the same PC at speeds sufficient for real-time graphics implementation. stereoscopic VR.
4. REND386 A software toolkit for real-time three-dimensional and stereoscopic graphics has been developed, and is available ome nd some apablites and he capabilities hare t prorarunes. free of charge tofreeof programmers. The o RED38 beow.time-intensive applctins aredesribe
4.1 Background The REND386 project began as part of a worldwide effort by experimenters on the Internet to develop low-cost using widely available and personal virtual reality systems ow-ostheadmouted uiling low-cost low-osttecnoloy. low-cost technology. Building head-mounted displays and other interface devices turned out to be much easier than generating stereoscopic graphics in real time. The Amiga was considered to be the fastest graphics computer available, but its internal graphics accelerator seedanddetal he speed hardarewasunsutedto hardware was unsuited to the and detail oof 3D 3D graphics required for VR. The PC has one of the largest hardware and programmer bases of any computer, and was the system of choice for the project. Developing real-time graphics software for the PC requires extensive knowledge of the complex interactions between the PC's VGA display system and the processor, and carefully optimized assembly code is required to implement drawing and rendering kernels. Extensive use of mathematics is required for 3D rendering as well [12], and
Speeds are dependent on how many objects are visible on screen, as objects that are not visible are eliminated early in the rendering pipeline. The pipeline has many visibilitycallyp runin g a 3000 polyg pi s based p min polygon tolss than 250 valod less than 250 polygons before reaching the world to ihigaddaigsae.Plgn virtual tm-nesv a lighting and drawing stages. Polygons may be rendered in metallic and pseudo-glass styles as well as solid or lit colors. Lines and wireframe rendering are also supported. The imagesby are rendered as seen a virtual specified either position andfrom Euler angles viewpoint, or by a ntled by a nderer i T homogenous matrix. iewpontrdaa es el a vi ew ort des ription c t ning containing viewpoint data as well as description viewport the size and position of the window on the display into which the image is to be drawn, and the field of view of the display. The field of view is used to set the correct degree of perspective to match the display device: a small desktop a onitorcime may he aifield ofview o 150, wes monitor image may have a field of view of 15', while a head-mounted display image may cover in excess of 120'. The renderer is also capable of offsetting the center of the image in the view window, required to adjust apparent depth in stereoscopic viewing. It can also render images that are horizontally or vertically inverted to match display devices that use mirrors. The renderer is capable of displaying a two-color horizon background, and a three axis "compass" to help orient the viewer during exploration. Lighting of objects is very important to 3D rendering and VR, as it increases the apparent depth of objects and
18-3 prevents masking of objects against similarly-colored The renderer supports two point or backgrounds. directional light sources and one diffuse light source for Lighting is computed as illumination of objects. independent of distance and is proportional to the cosine of the angle between the light source and each polygonal facet of objects. Each polygon has a reflectance and hue value that are combined with the computed lighting strength to determine which of the 256 available colors in the VGA palette will be used to draw the polygon.
as the distance from the viewer to the monitor screen. The images from the cameras are displayed on the monitor alternately, with LCD shutter glasses used to ensure the images reach the proper eyes. The parameters of the system are then eye and camera spacing, convergence distance, stereoscopic window size, and viewer distance. Internal calculations also require the world scaling factor, in order to relate the arbitrary numerical scale of the virtual world to the real world. A scale of 1.0 unit to 1.0 mm is often chosen.
4.3
The calculation of viewport parameters from these factors is documented in [14]. Exaggerated depth is obtained by which in increasing the eye spacing parameter,
Stereoscopic Support
One of the most important tools available in REND386 is integrated stereoscopic imaging support. Given information about the display such as screen size and the distance from the viewer, it will compute the proper field of view, left and right viewpoint positions, and offsets of images in the view window to create an orthoscopic stereoscopic display. Orthoscopic displays show objects in the world at proper depths relative to the viewer, as if the monitor were a window into the virtual world, but may cause eyestrain when viewed on small monitors. Non-orthoscopic views are often required, for example to exaggerate the sense of depth or to make objects float in space in front of the These may be achieved by modifying the monitor. stereoscopic model that REND386 uses to compute the view parameters.
combination with changes in world scale can make objects appear miniaturized and close to the viewer. Objects can also be brought out of the monitor by increasing the A wider field of view and convergence distance. exaggerated perspective may be achieved by decreasing the All stereoscopic model screen distance parameter. parameters can be changed through the renderer configuration file without recompiling the code. Fine tuning of these parameters is often needed to suit different viewers, and may be done interactively from the keyboard.
RFLJ
etD
____
b)
[
Figure 2.
Some of the stereoscopic display modes
supported by REND386:
Figure 1. The REND386 stereoscopic model computes imaging parameters based on physical dimensions: e=eye spacing, D=screen distance, W=screen width, C=convergence distance. These are used to compute perspective (field of view), left and right viewpoint coordinates in virtual world, and offset of left and right images on screen.
The stereoscopic calculations used by REND386 are based on the camera/monitor system often used in teleoperation, shown in Figure 1. The two cameras are spaced by the same distance as the viewer's eyes, and are pointed so their optical axes converge at a known distance, usually the same
c)
) dd
wit lRs~terasb
.
]
a) Time-multiplexed stereo
b) Side-by-side stereo with LCD shutter glasses. windows for stereopticon viewers. c) Vertical stereo such as windows for double-speed viewers Stereographics CrystalEyes. d) Seperate VGA displays for head-mounted displays.
4.4 Stereoscopic Display Devices Time-multiplexed stereo is directly supported by REND386: all that is required is to connect a pair of LCD glasses to one of the computer's serial ports through an inexpensive driver circuit and to enable the stereoscopic display. REND386 supports other types of stereoscopic displays in addition to the time-multiplexed monitor display, some of which are illustrated in Figure 2. Two windows for left and right eye images may be displayed, for
18-4 use with lens or mirror viewing devices. The windows may also be stacked vertically for use with scan-doubling viewers such asalsothe supports Stereographics The renderer VGA CrystalEyes display cardssystem. with fherenerep VGe orts ato o i s eth independent video buffers, fathe left and right eye views for head-mounted displays. Special display to support devices, control all of parameters which mayare beavailable controlled through these the configuration file.
world. The world can also be split into smaller areas for visibility control and navigation.
The stereoscopic model used by REND386 assumes that the left and right eye images will be displayed in the same window on the screen. If separate screen windows or separate displays in an HMD are to be used, the left and right eye images must be offset horizontally to compensate. This correction is also useful in HMDs to compensate for differences in user's interpupillary spacings. Some optical systems may produce images that are tilted, such as the wideange inFigue HM 3 an wide-an gle HM D in Figure 3, and reqirecompnsaory require com pensatory rotation of the image plane during rendering. Such rotation may be set independently for the left and right eye images.
positions of objects. Specifying angles of joints is much more computing positions of each of animation or tracking of real-world
The choice of the PC as the platform for REND386 has made a number of inexpensive multimedia products available for use with 3D graphics. Inexpensive videooverlay boards such as the VideoBlaster from Creative Labs can combine live video with 3D graphics from the VGA display for augmented teleoperation. With special drivers, these cards can be adapted to overlay stereoscopic graphics from REND386 onto standard field-sequential stereoscopic video images, or to convert multiplexed stereoscopic video vido toconertmuliplxedsteeosopi iage, o vieo into left and right eye images for head-mounted displays. VGA-to-video converters such as the AVerKey from ADDA-Teholo convertertsuchas VG the Aages p rodueb ADDA Technologies convert the VGA im ages produced by REND386 into video for driving HMDs or for recording of normal and field-sequen.tial stereoscopic images on videotapel
REND386 actually moves each object in the world when it is rendered, and caches the new positions of the objects. Because the actual position in the world of all objects is available, collision detection can be performed efficiently. REND386 contains extensive fixed-point libraries for
.
For motion control, objects may be connected together by articulated joints into hierarchical figures. For example, robot arm in Figure 4 could be created by attaching gripper fingerIfobjects to a wrist object, and the an arm object. the arm-wrist joint is rotated, thewrist wristtoand gripper fingers will move as an indivisible object. Joints may also be moved as well as rotated to change the relative figure configuration by useful than explicitly the parts, and makes objects much easier.
h ejoin manis iscimemente by cascaing homogenous matrices to describe each object position. Each figure is arranged as a tree of joints and objects, which helps to organize motion and allows efficient updating of ob e t p s i n . In m t r nd i g sy e s, uc object positions. In implemented most rendering hierarchical figures are duringsystems, renderingsuch by cascading viewing transforms from each joint matrix.
Trixoopera function tionsuc areasiveion and including form Trigonometric also available, fourquadrant arctangent, and Euler angle to matrix and matrix to angle translations. The fixed-point formats were tosane fixe-point fr mats were designed totranlion achieve near efloating-point precision and range, while matching or exceeding the 387 floating-point co r es rin p ed F r ex m l , at x e ti s a d coprocessor in speed. For example, matrix entries trigonometric results are accurate to 8 decimal places, and and world coordinates have a range of more than 7 significant digits. These libraries and the articulated figure support are essential for tools for creation and manipulations of virtual environments, or for representation of real-world events for augmented reality presentations.
Figure 3. Example of a display which requires imaging with rotated image planes. The angled configuration of lenses allows a much greater peripheral field of view and allows larger display devices to be used than otherwise possible.
4.5 Environments and Simulation Airto a wEND386orld consists of a al tion of .Objects llocation, into REND386 for viewing or manipulation. Objects consists of polygons, and are loaded from PLG files containing lists of vertices and polygon descriptions. Multiple objects can be loaded and arranged under control of a WLD file, which describes a complete REND386
Figure 4. Example of an articulated figure for simulation. Each of the objects in the figure pivots around the lettered with respect to the object above it in the hierarchy shown on the right. The "fingers" e+f are translated rather than rotated with respect to the "wrist" d. All joint oiin n nlsmyb e ydt rmara-ol by data from a real-world set be may angles and positions robot arm.
18-5
4.6 Virtual RealityToolkit REND386 was developed especially to provide a means for creation of simple virtual reality systems. The renderer easily produces the 10 frames per second required for usable VR systems [15] even when producing both left and right eye images for stereoscopic presentation via HMD. Support for three-dimensional manipulation devices and even an inexpensive gestural interface device (the Nintendo PowerGlove) is built in. Navigation and manipulation devices such as mouse, trackball, and joystick are supported, as are head trackers. New devices can be interfaced by writing loadable drivers or by modifying the
Stereoscopic displays are easily created with REND386, and can support a variety of display devices, including LCD glasses and HMDs. Video overlay boards allow stereoscopic graphics and stereoscopic video to be combined for operator aids or comparisons. For example, wireframe outlines of a moving virtual object could superimposed on video of the real object to judge the match between modeled and actual motions. REND386 supplies a substantially complete software base for 3D graphics and stereoscopic displays for the IBM PC and compatible computers. These computers can provide a cost-effective and widely supported platform for experimentation and applications. Unlike other rendering or graphics packages, full source code is available to the programmer, allowing new display modes or new interface
Head-mounted displays are supported by modifying the devices to be added. stereoscopic display model to match the field of view and display spacing of each device. There is little standardization in HMD design, and parameters may vary 6. Availability even between eyes of the same display. Special video cards onvrtes VA-t-vieoma te~REND386 is available in the form of a demonstration or VGA-to-videoorconverters may beuse be used todrie to drive the HM D e e ual ra or ec d yF o e ea o r e dispays Th steeosopi rederig sppot isdesgne to executable or as source code by FTPPffrom several sources displays. The stereoscopic rendering support is designed toare always be flexible enough to support almost any display device. onilhe from frnet.sunee.uwaterloo.ca. Temost Dcumentare ale available Documentation on file REND386 includes a mechanism to integrate head tracker data into viewpoint control for proper image generation to the HMD. The articulated-figure mechanism is used to build a body for the viewer, to which head-viewpoint and hand-manipulators can be attached. The head tracker then controls the head-body joint, and the 3D manipulation device controls the hand-body joint. The body can then be moved through the virtual world, with the hand and viewpoint properly attached. The body can also be attached to moving"rid" objects allowing the viewer to o tbjctbin the mveworld, i cmpextrajectories. "ride" objects or to be moved in complex trVol Creation and control of autonomous objects in the world can be performed through a simple animation control language that allows objects perform cyclic motions, to react to the presence of the viewer or to be triggered by the manipulation device. More complex motions, such as copying the motions of a real-world device, can be implemented by adding C code to the system to directly control joint positions.
formats is included with the demonstration software and is explained in detail in [14]. The software and source code is available free of charge for non-commercial uses.
7. References (1)
T.B. Sheridan, "Supervisory Control of remote manipulators, vehicles and dynamic processes: Experiments command and displayResearch, aiding", Advances in in Man-Machine Systems 1, 1984, pp. 4 9 -13 7 .
(2)
(3)
5. Conclusions
K. Fernandez & E. Hinman, "The use of computer graphic simulation in the development of on-orbit telerobotic systems", Robots 11: 17th International Symposium on Industrial Robots, April 1987,21:45-53. W.S.Kim, F. Tendick & L.W.Stark, "Visual enhancements in pick-and-place tasks: Human operators controlling a simulated cylindrical manipulator", IEEE J.Robotics & Automation, Vol. RA-3(5), Oct. 1987,418-425.
Virtual reality, visualization and teleoperation augmented with stereoscopic graphics require real-time threedimensional rendering of graphics. Low cost is important for many applications, but development of rendering software from scratch is out of the question in most cases.
(4)
K.B. Evans, "Head Mounted Telepresence and Workstations", Workshop on Military Robotics Kingston, Ont.,Canada, 8-11 Aug, 56.
REND386, a software toolkit for realtime graphics on the IBM PC platform, includes many features to make experimentation and development of new systems easy. Virtual worlds and environments are easily created and modified, and can contain autonomous objects. It is possible to interface the virtual world to the real world by adding object-control code: for example, an articulated model of a robot arm could be moved in synchrony with a real arm by transferring real joint angles to the model. This could be used in an augmented teleoperation application.
(5)
S.S. Fisher, E.M.Wenzel, C. Coler, and M.W. McGreevy, "Virtual interface environment workstations", 32nd Proc. Human Factors Society, 1988, 91-95.
(6)
J.D. Foley "Interfaces for advanced Scientific American, Oct.1987, computing", 127-135.
(7)
P. Milgram, D. Drascic, and J.J. Grodski, Stereoscopic Video + Superimposed Computer
Displays for Proc. Second Applications, 1989, pp. 50-
Stereographics: Applications in Teleoperatrion", Proc. Second Workshop on Military Robotics
18-6 Applications, Kingston, Ont., Canada, Aug, 1989, pp. 20-25.
8-11
(8)
P. Milgram, D. Drascic, and J.J. Grodski, "Enhancement of 3-D video displays by means of superimposed stereo-graphics", Proc. 35th Annual Meeting of Human Factors Society, (pp. 14 57 - 14 6 1). San Francisco, CA., 1991.
(9)
W.S.Kim and A.K.Bejczy, Graphics Displays for Operrator Aid in Telemanipulation", IEEE SMC, 1991, pp. 105 9 -10 6 7 .
(10)
J.J.Grodski, P. Milgram, and D. Drascic, "Real and Virtual World Stereoscopic Displays for Proc. 31 DRG Seminar on Teleoperation", Robotics in the Battlefield, NATO/DRG, Techn. Proc. AC/243-TP/3, C2.0-C2.16
(11)
D. Drascic, J.J. Grodski, P. Milgram, P.Wong, S. Zhai, and K. Ruffo, "SV+SG: Stereoscopic Video Video with Stereoscopic Graphics", Proc. INTERCHI'93, Amsterdam, 25-29 April 1993.
(12) J.D.Foley, A. van Dam, S.K.Feiner, and J.F.Hughes, "Computer Graphics: Principles and Practice", Addison-Wesley. 1990 (13) D.M. Stampe and B.Roehl. "The REND386 Project -- History and Current Status." In Virtual Realities: Anthology of Industry and Culture.(In press) (14) D.M. Stampe, B.Roehl, and J.Eagan. "Virtual Reality Creations", Waite Group Press, Corte Madera CA. 1993 (15)
S. Bryson "Implementing Virtual Reality: SIGGRAPH '93 Virtual Reality Hardware" Course Notes #43, pp. 1.3.1-1.3.26. 1993
19-1
APPROCHE EXPERIMENTALE DU SON 3D :METHODOLOGIE ET RPSULTATS PRELIMINAIRES L. PeIlieux*,
C. CGulli",
*CENTRE
P. Leroyer*,
B.
Piedecocq*,
A. Leger**,
J.P.Menu*
DETUDES ET DE RECHERCHES DE MtDECINE AtROSPATIALE BP 73 91223 Bretigny sur orge cedex France ** SEXTANT AVIONIQUE B.P.91 St Medard en jalles cedex France
SOMMAIRE Le Principe du son 3D, ses domaines d'application et les m6canismes utilis~s par ihomme pour localiser un son, sont rappelbs. Les travaux r6alis6s sont dbcrits. Le but est ]a mesure des performances humaines en localisation d'une source sonore simul6e I'aaide d'un casque stbr6ophonique. L'6tude peut atre d6compos6e en 2 parties : mesure individuelle des caract6ristiques de diffraction acoustique de la tate (fonctions de transfert de tate) de 4 sujets, puis test des performances en localisation, les sujets 6coutant des sons 61aborbs 'a partir de leurs propres fonctions de transfert. Le sujet doit viser ]a source perque, le plus prdcis6ment possible, le temps de r6ponse n'6tant pas pris en compte. Les sources ne sont pas mat6rialis6s et le sujet est dans une quasi obscurit6. Les r6sultats montrent que ]a localisation en gisement est facile POUr les 4 sujets. Par contre, la localisation en site est tr~s difficile pour 2 sujets. Pour le meilleur sujet, l'erreur sur la ligne de vis6e est de 6' en valeur efficace. INTRODUCTION A forigine des travaux prbsent6s, il y a la constatation de la quasi saturation des fonctions visuelles du pilote d'avion de chasse d'oj l'idbe d'utiliser l'ouYe pour transmettre au pilote des informations concernant les menaces.
DOMATNES D'APPLICATION DU SON 3D (ref 3) Le son 3D a deux grands domaines d'applications qui sont li6s kala nature des informations 'a transmettre. Lc premicr domaine est cclui dc la transmission des messages contenant essentiellement une information de position dans l'espace. Dans le cas d'un pilote d'avion de chasse, il peut s'agir de la position d'un missile qui le menace. La menace peut &Tre 6galement due 'a la trop grande proximit6 d'un avion ami. Le son 3D) devient alors un syst~me anticollision. Dans ce type d'application, ii s'agit done de transmettre Ie plus rapidement possible I' information de position. Le syst~me auditif est la voie Wdale pour transmettre ce genre d'information, puisque finalement on ne fait qu'exploiter un rbflexe de d6fense de l'homme. A 1'coute d'un son inqui6tant, ou inhahituel, l'auditeur tourne sa tate dans la direction du son, afin de pouvoir affronter de face une 6ventuelle menace. Pour lc pilote cela peut 8tre un moyen rapide de lui indiquer ofi regarder . Le deuxibme grand domaine d'application concerne les cas o le message 'a transmettre est plac6 dans lespace, afin de le rendre plus intelligible. Le son 3D) permettra probablement
d'am6liorer les possibilit6s de Qu'est ce que le son 3D? 11s'agit de faire entendre, 'a laide d'un casque stereophonique, des sons ou des paroles qui soient perqus par l'auditeur comme issus d'un point particulier de l'espace. Le son 3D fait partie du concept de r6alit6 virtuelle.
REALISATION
Une remarque peut 8tre faite. L'6coute au casque st6r6ophonique n'est pas nouvelle. Toutefois, jusqu'a cc jour, l'6coute souffre de d6fauts importants : - la localisation est impr~cise.`:c%, - Le son est perqu 'a l'int~rieur de Ia tate, il n'est pasdwmn - L'image sonore se d~place avec Ia tate du sujet, rendant impossible le repe~rage d 'unesource par rapport 'a un
surveillance
simultan6e de
plusicurs communications audio en attribuant 'a chaque communication radio et 'a chaque avertissement audio une localisation dans une direction diff6rente. D'UN SYSAtME 3D (figure 1)
ffiatruteursonre
ret
roeetiwm r
Prcseriarl
Ce soot l'a des d~fauts auxquels il faut imp~rativement rem6dier POUr qu'un syst~me son 3D existe.
Afin d'apprbcier les possibilit6s du son 3D), nous avons
Picp usn3
dbcid6 de mettre au point un outil permettant un son 3D) de Ia
Fgr Fgr L iuain3 s eopsbee ocin L'illustrateur sonore. A chaque type d'information 'a transmettre, ii associe un son particulier. II peur s'agir d'un son synth6tis6. Ii peut s'agir 6galement d'une voix humaine. L'Orienteur. partir des positions de lavion, de la menace et de Ia tate du ii calcule les coordonndes du point de lespace oil doit 8tre localis6 Ie signal sonore. Le Processeur binaural.
m cilleure
qualit6 possible :simulation individualisbe, qualit6
Haute-Fidelit6 pour les convertisseurs, le filtrage en temps r~cI et les 6couteurs. d'aordles exos6 prsentron Dansn~tenou terons dbr lesPicp ous pr6se xpossbes dusn3D Dansicatrons p etsibles du on 3D.Nos dbcri~rons lepryiqueipe applications31 des sosparaLe physiq Nucsqu erons raloappls 3t dun sstmen epesrmetnt Ialocaiostation des sons pardihtomme. NosA expoeros aorsnostraaux t nus cs iscterns.pilote,
Presentedat an AGARD Meeting on 'Virtual Interfaces: Research and Applications', October 1993.
19-2 A partir d'un signal monophonique, fourmi par l'illustrateur sonore, il fabrique deux signaux, un pour chaque oreille, tels qu'a l'6coute, l'auditeur localise le son dans l'espace "r~el" it trois dimensions, 'a l'emplacemcnt fourni par l'orienteur. Ce processeur est le coeur du syst~me. MECANISMES UTILISES PAR L'HOMME POUR DIPTERMINER LA DIRECTION D'UN SON (ref 2) En premier lieu, il y a le retard interaural: -Le signal issu d'une source sonore parvient 'a des instants diff6rents aux deox oreilles. - Les rotations 6ventuelles de la tate, maine celles de petite amplitude et qui sont plus ou moins conscientes am~Iiorent sensiblement les possibilit6s de rep~rage par one technique proche de la goniomatrie. En deuxi~me lieu, il y a le spectre des signaux. - Le contenu fr~quentiel des signaux parvenant aux deux oreilles est en g~n6ral diff6rcnt car ]a tate et le torse
font obstacle aux ondes sonores. Cet effet d'obstaclc d6pend bien entendu de la fr~quence. -Les pavilions dcs oreilles r~alisent 6galemcnt on filtrage (ref 1). On appelle foniction de transfert dc tate, le rapport des transform6es de fourier des pressions acoustiques 'a lemplacement de la tate do sujet , avec et sans le sujet. La figure 2 pr6sente on exemple de ces caract6ristiques relev6es dans le plan horizontal, sur une tate artificielle. Ce filtrage, notons le, vanec d'un individo I'aautre, notamnment do fait de Ia diversit6 de forme des pavillons des oreilles. L'effet est surtout sensible sur Ia localisation en site (ref6). C'est pourquoi nous avons d6cid6 de mesurer individuellement, en 3D), les caract6ristiques do filtrage acoustique r6alis6 par le thorax, la tate et les pavillons d'un sujet.
~
Fonction de transfert.T~te artificielle~oreille droite.
3a00
6
k
k.4
k
50
250
degh
2Figureg2
TRAAU
otisrsdn
ReALSScngat-smcohns.Lsbuhn
21 Lapemig
osc~
epri-entetaala6t
'aIameur desgaatitqe-e4sjt. 15La deuxg epri--t osc~ d usjtd oaie d 120e I s dege rprscrc~sius 90thti~ det'gatr'apati degrc-siusdnate ue.Ateetdt otae 30etdcuentgi- vclospvlos a 0redegn-bnir
vn nut sjts. Nous Xl6srmsr
e
odisadtf
uxts e os ot e exdn
e bouchons
qisn
htus
oettlmn
edsoitfd
apooIp~et
eue
nHu-alu
edpaesru al e ao aepoe ipreqe pitdn phr et~ u att u ue si ucnr etetaeetatmts rcsu del ic.L L
iga
6limnten
ectto
no~dn suolaoie
ehu-alu ecapacutqe~i
s
n
parler et dens les mcarophones.iLes douchautsn
19-3 microphones. Ceci est rendu possible par une r6p6titivit6 tri~s pr6cise du positionnement du haut parleur puisque lerreur est largement inf6rieure au degr6. La position absolue du sujet, en gisement, est fix~e par une m~thode acoustique en annulant le d6phasage interaural lorsque le haul parleur est plac6 au gisement 0. Quant au site, c'est le sujet lui mn~me qui ddtermine sa position horizontale. Les positions absolues 6tant rep&r~es, le sujet contr6le lui mn~me ]a fixit6 de sa posture grace 'a un syst~me de deux cameras video et kalaide de marqueurs video de face et de profil. Les mesures sont faites en trois seances consdcutives, durant chacune environ 1 demi heure. Au total on a une base de donndes de 450 paires de funictions de transfert par sujet. Les rdponses impulsionnelles correspondantes sont ensuite charg6es dans un PC 6quip6 d'un processeur Convolvotron (ref 5). 11 devient alors possible de r6aliser Ie filtrage en temps r6el d'un signal audio. On fabrique ainsi 'a partir d'un signal monophonique un signal spatialis6 'a lemplacement voulu par l'op~rateur. C'est ce signal st&r6o que l'on envoie dans Ie casque d'un sujet.
experimentation psychoacoustique. Nous avons d6cid6 dans ces exp6riences pr6liminaires d'appr~cier la pr6cision qu'il est possible d'obtenir lorsqu'il est demand6 'a un sujet de faire face ii une source sonore simulde halaide du casque. Le signal sonore 'a localiser, une voix, est 6mis pendant tout le temps de la recherche. Le sujet prend tout son temps pour r~pondre, car c'est ]a pr6cision que i'on veut 6valuer (en fait, le temps de recherche est limit6 'a 30 secondes). Plus prdcis6ment, le sujet doit viser la source halaide d'une croix collimat6e solidaire du casque. Ainsi, la direction du regard est fixe par rapport au casque. Sur celui ci est fix6 un ddtecteur de position 6lectromagndtique Bird. Les indications du bird asservissent les signaux audio afin que la source sonore simul~e garde une position constante dans le rep~re Hi6 au local. Le bird a 6t6 soigneusement 6talonn6 :les diff6rents rep~res ont Wt harmonis6s 'a laide de vis6es optiques par thdodolites et d'un deuxi~me rdticule collimat6 'a l'infini et plac6 dans le local. Le sujet est assis au ni~me endroit que dans la premi~re partie, dans one semi obscurit6, afin de minimiser le r6le des rep~res visuels.. Les tests sont limit~s 'a un ensemble de 12 points simulds, dont les gisements sont espac6s de 30 degr6s et dont les sites sont :0',+36* et -36'. Chaque emplacement est pr6sent6 3 fois au cours du test, et de faqon al6atoire. On a ainsi 36 r6ponses par test. Le test dure environ 20 minutes. Les rort'ions de la tate sont relev6es tuutes les 4Oms et stock~es. Cela permet l'analyse 6ventuelle des stratdgies de recherche des sujets. Notons que tous les r6sultats que nous pr~sentons ici ont 6t6 obtenus lorsque les sujets 6coutaient avec leurs propres pavillons. R6sultats de localisation en izisement (figure 3). Chaque graphique correspond 'a un sujet. On a en abscisse le gisement rdeI, et en ordonn6e les r~ponses do sujet. Les droites correspondent aux r~ponses Wdales. Les r~sultats du haut sont bien regroupds autour de Ia droite Wdale, l'erreur d'appr~ciation commise par les sujets est rddoite. Ce sont les deox meilleurs sujets. En bas, c'est momns bien. 11 y a des impr6cisions, voire des erreurs. Milueperformances en gisement (en degr6)
Sj Erermoyenne
Erreor RMS Ecr ye Errur ax8
LUC ICOR 3 3
f4
2
JJUS
j13
jI
6J
4
j27
71
3 11
124 1148
4 1
Tableau 1 Les valeors statistiques sont pr~sent~es sur le tableau 1. L'erreor rms est de 4 degr~s, pour les deox meilleors, l'6cart type est de 2 'ou 3 '. Les plus mauvaises performances correspondent 'a one erreur rms de 270 avec un 6cart type de 240.
photo 1
R~sultats de localisation en site (figure 4). L'a encore, on retrouve les rdsultats de nos 4 sujets, disposes de la mame faqon. Les droites correspondent aux r6ponses Wdales. 11 n'y a que 3 s~ries de valeur puisque l'on n'a test6 que 3 sites 0,+360 et - 360. En haul, les rdsultats sont group~s et centr6s autour des bonnes valeurs. Chez JUS, les points ne
19-4
00
o
I
0
E
zz zz 0
C)U
C)
m.
0
a
CC) a)
m0C
co0
C)
C:)
(3))
0
2
0
2
oo
0D0
oPC
Lu
Lu
z
zD 00 0
o
o
C
C.) 0,
o
CCC-c
flCLedas!B
U)
n5a asIO
19-5 90
90
*451
45
Sjl LC perso
Srrjer COR 33perso
*i -90
-45
45
X
90
-
-90
-45
45
-45
-45
-90
-90
90
site reel
site reel
90
90
45
45I
perSO
srrjet:JUS perso
*
-45
*
-90
-45
-90
site r~eI
site reel
Localisation. en site. Figure 4
sont pas trap diSperS6S, mais les valeurs centrales surtaut it +360 sont d6ca1~es. Les sans venant du haut sant alars per~us mains haut qu'ils ne le sant. Natre dernier sujet, qui 6tait le mains entrain6 semble r6pondre de faqon al~ataire. pro st (ndeT)Erreur nese Meleue Su
e
t
Erreur Rma enn Ecr ye3
Erreur ma
14
vis~e (en degr) JUS IBIS 26 26 33 37 21 26 98 118
BI
Tableau 3
i...125...
36
L'erreur sur ]a limne de visee (tableau 3) est certamnement le crit~re de localisatian. Cette erreur carrespand hs
5
27langle
O
(LUCG 4 Errer R5
Meilleures performances en ii ne de Suiet LUC ICOR Erreur ma ernie 5 6 Erreu RMS 6 8 Ecart type 3 5 18 15 max
JUS
.Z.......J2~.......J 18
14
~ 48
.-4meilleur
98...
Tableau 2 Les valeurs statistiques sant pr6sentdes sur le tableau 2 L'erreur nrms est 50 et 7 'avec des 6carts type de 3 et 5' paur les 2 meilleurs.
farmtS par la direction visee par le sujet et la vraie
directian de la saurce. Paur 2 sujets, lerreur rms est de 6 et 8' avec un 6cart type de 3 et 5'. Paur les 2 autres sujets, les r6sultats sant mains bons :260 avec un 6cart type d'une vingtaine de degrds.
19-6
DISCUSSION Les r6sultats de nos deux meilleurs sujets, tels qu'ils sont pr6sent~s semblent atre du m~me ordre. Et pourtant, ils correspondent ' des strat6gies de recherche du site tout ' fait diffdrentes. En effet deux strat6gies se d6gagent: - une stratdgie "visuelle". Pendant ]a recherche en site, le sujet conserve un gisement proche de celui de la source. Disons qu'il place la source dans son champ visuel. - une stratdgie "auditive". De fayon ddlib&r6e, le sujet tend sa meilleure oreille vers la source. C'est la stratdgie des aveugles. Une fois le site d6termin6, le sujet vient se placer face ' la source, ainsi que cela lui est demand6. Le premier sujet, LUC, a une strat6gie visuelle. I1 a atteint ses meilleures performances d~s la 26me s6ance et ses mouvements de t~te sont assez limitds. COR par contre n'a atteint les performances indiqu6es qu'apr's avoir adopt6 la strat6gie auditive et en faisant beaucoup d'efforts. CONCLUSION Mis ' part le fait qu'il y a encore beaucoup de travail ' fournir et de nombreux tests psychoacoustiques ' rdaliser, il apparait que si Ia localisation en gisement est facile, celle en site est nettement plus difficile. Certains sujets 6tant nettement plus aptes que d'autres, des problkmes de sdlection vont apparaitre, cette sdlection ne pouvant se faire ' partir des tests audiom6triques classiques. Quant h ces tests classiques, ils devront 6largir la bande de fr6quence analys6e car une bonne localisation en site n~cessite une audition intZgre dans les hautes fr6quences, au delh de la bande conversationnelle habituellement test6e. Enfin, sachant que la sensibilit6 en haute fr6quence est souvent la prcmiere atteinte lors de lexposition au bruit, voilh encore une raison pour renforcer Ia protection du personnel. REMERCIEMENTS Les travaux pr6sentfs ont 6t6 r6alisds dans le cadre d'une 6tude financ6e par la DCAE / STTE / AVI (Direction des Constructions A6ronautiques, Service Technique des T6l6communications et des Equipements a6ronautiques ).
BIBLIOGRAPHIE 1 Batteau D.W. . The role of the pinna in human localisation. Proceedings of the royal society of London,Series B,168, pp 158-180 ( 1967 2 Blauert J. Spatial hearing. MIT Press, Cambridge, MA (1983) 3 Doll T.J.: Development of simulated directionnal audio for cockpit applications, rapport AAMRL TR 86014 (1986). 4 Posselt C. Schroter J. Opitz M.,Divenyi P.L. , Blauert J. . Generation of binaural signals for research and home entertainment. 126me congr~s d'acoustique. B1-6 Toronto (1986). 5 Wenzel E.M., Wightman F.L., Foster S.H. A virtual display system for conveying three-dimensionnal acoustic information. Proceedings of the human factors society 32nd annual meeting(pp8690).Santa Monica,CA:Human Factors society. 6 Wenzel E. ,Wightman F. , Kistler D. , Foster S.:Acoustic origins of individual differences in soun Suppl 1 Vol 84, Fa111988. 7 Wightman F.L. Kistler D.J. . Headphone simulation of free field listening. l:Stimulus synthesis.J.Acoust.Soc.Am.85(2)pp858-867 February 1989
20-1
THE USE OF A TACTILE INTERFACE TO CONVEY POSITION AND MOTION PERCEPTIONS A. H. Rupert 1,2 F. E. Guedry 1,3 M. F. Reschke 2 1 Naval
2
Aerospace Medical Research Laboratory Acceleration Division 51 Hovey Road Pensacola, Florida 32508-1046
NASA Johnson Space Center (SDS) Space Biomedical Research Institute Mail Code SD-5 Houston, Texas 77058-1113 3 University of West Florida
Department of Psychology Building 13, Room 201 11000 University Parkway Pensacola, Florida 32514 USA
SUMMARY Under normal terrestrial conditions, perception of position and motion is determined by central nervous system integration of concordant and redundant information from multiple sensory channels (somatosensory, vestibular, visual), which collectively yield veridical perceptions. In the acceleration environment experienced by pilots, the somatosensory and vestibular sensors frequently present false information concerning the direction of gravity. When presented with conflicting sensory information, it is normal for pilots to experience episodes of disorientation. We have developed a tactile interface that obtains veridical roll and pitch information from a gyro-stabilized attitude indicator and maps this information in a one-to-one correspondence onto the torso of the body using a matrix of vibrotactors. This enables the pilot to continuously maintain an awareness of aircraft attitude without
reference to visual cues, utilizing a sensory channel that normally operates at the subconscious level. Although initially developed to improve pilot spatial awareness, this device has obvious applications to 1) simulation and training, 2) nonvisual tracking of targets, which can reduce the need for pilots to make head movements in the high-G environment of aerial combat, and 3) orientation in environments with minimal somatosensory cues (e.g., underwater) or gravitational cues (e.g., space). INTRODUCTION In our day-to-day terrestrial activities, position and motion perception is continuously maintained by accurate information from three independent, overlapping, and concordant sensory systems: the visual, the vestibular (or inner ear), and the somatosensory systems (skin, These joint and muscle sensors). complementary and reliable sources of information are integrated in the central
Presented at an AGARD Meeting on 'Virtual Interfaces: Research and Applications', October 1993.
20-2
nervous system to help the organism formulate an appropriate motor response. The relative contribution of the various senses involved in the perception of one's orientation can be significantly altered by exposure to unusual sensory environments, resulting in perceptions that are no longer veridical. For example, somatosensory pressure cues are markedly reduced underwater, while in the military aviation environment, the almost continuous changes in acceleration and direction of aircraft motion expose aircrew to a resultant gravitoinertial force that is constantly changing in magnitude and direction. Under such circumstances, somatosensory and vestibular information concerning the direction of "down" may be incorrect, and increased reliance must be placed on visual information, Unfortunately, varying gravitoinertial force fields can also produce visual illusions of motion and position. Thus, in unusual sensory environments, the central nervous system has the added responsibility of determining which sensory information is valid. Understandably, the typical spatial disorientation mishap occurs when the visual orientation system is compromised (e.g., temporary distraction, increased workload, transitions between visual and meteorological conditions, or reduced visibility). The central nervous system must then compute orientation with the remaining vestibular and somatosensory information that is at its disposal, however, this information is frequently incorrect. It is no wonder that spatial orientation is markedly impaired in the underwater and aerospace environments. Indeed, it is a physiologically normal response to experience spatial disorientation in such circumstances. Virtual reality displays offer the opportunity to "correct" the position and motion illusions that occur in unusual acceleration and proprioceptive environments. Current simulators and virtual reality devices use visual displays to adequately convey the perception of static position and attitude.
However, a veridical awareness of dynamic motions (e.g., changes in attitude, velocity, and acceleration) is inadequately maintained by visual information alone and requires the addition of proprioceptive (somatosensory and vestibular) cues. For example, motionbased simulators attempt to simulate maintained acceleration either by utilizing 1) transient linear acceleration with "washout" of motion cues accompanied by visual representation of acceleration, or 2) change of pitch (tilt) to convey prolonged linear acceleration. Both methods possess inherent deficiencies. The former method is restricted by the limited linear travel available in current simulators, and in the latter method, linear motion perception is "contaminated" with the unavoidable canal stimulus produced in affecting a change in pitch. The current models of perception are capable of predicting responses for simple conditions of static vision and constant acceleration, however, the experiments required to extend the model to include the dynamic conditions experienced in aviation have not yet been carried out. Cutaneous sensory information is not currently used to provide position or motion information to pilots. We propose that spatial orientation can be continuously maintained by providing information from the aircraft attitude sensor to the pilot through the nonutilized sensory channel of touch (Rupert, Mateczun, and Guedry, 1990). One approach is to use a torso harness fitted with multiple electromechanical tactors that can continuously update the pilot's awareness of position. This is analogous to the way our brain obtains orientation in the terrestrial environment. Thus, the pilot should be able to maintain orientation information in the absence of a visual horizon or during inevitable gaze shifts from the aircraft instrument panel. This device should free the pilot to devote more time to weapons delivery systems and other tasks requiring visual attention. The rationale for utilizing touch to convey position and motion perception and to overcome vestibular, visual, and auditory
20-3
illusions produced by unusual acceleration environments is based largely on knowledge about the ontology of sensory development In most vertebrates, the (Fig. 1). proprioceptive tactile system is the first sensory system to develop, followed by the vestibular system, then the auditory system, and finally the visual system (Gottlieb, 1971). In fact, the proprioceptive systems of somatosensory and vestibular function develop a rich interaction in utero. This follows logically since the somatosensory system needs information very early in development concerning the direction of the gravity vector in order to properly control the antigravity and gravity muscles. It is only much later in development that the auditory and visual systems are integrated into this already well-functioning proprioceptive system. The primacy of touch and somatosensation in the development of orienting behavior has been demonstrated in several neurophysiological and anatomical studies (Meredith and Stein, 1986a,b). We propose that by providing veridical somatosensory orientation information the illusory effects present in unusual acceleration and proprioceptive environments can be reduced to improve human performance in many facets of the military theater. INITIAL AND PROCEDURES OBSERVATIONS We constructed a series of prototype devices to determine whether a pilot could maintain normal orientation and control over an aircraft using tactile cues. Multiple tactors were placed on a torso suit to represent all directions of roll and pitch (Fig. 2). An aircraft attitude sensor (Fig. 3) provided roll and pitch information to an IBM portable computer that selected (via circuit designed in-house) the appropriate pattern of stimulation for a given combination of pitch and roll. The circuit takes data from an IBM (or compatible) PC parallel printer port and expands it to drive a matrix of stimulators (Cushman, 1993). Although the current matrix is an 8 x 24 (146 element) array, the user can define a maximum of 16 x 16 elements.
The tactors in the prototype display are miniature electromechanical speakers 1/8 of an inch in thickness and 1 inch in diameter. The stimulus waveform consists of 10 pulses of a 150 Hz rectangular pulse train operating at a 10% duty cycle, followed by a break of approximately 450 ms. A stretch lycra suit maintains an appropriate interface pressure between the tactor and the skin. The software programs to drive the tactors evolved continuously in response to feedback from each user and have been tailored to meet the requirements of each community (e.g., attitude awareness for aircraft vice vehicle velocity information for diving submersibles). One program that we developed and tested in an aircraft conveys the direction of "down," or the gravity vector. To experience in the laboratory the sensation of roll and/or pitch as presented to the pilot, the gyro-attitude sensor was replaced with a joystick, which permitted subjects to experience the same tactile sensation on the ground and visually observe the equivalent aircraft orientation changes represented on the computer by standard aircraft attitude indicator symbology. In this configuration, most subjects could learn within 30 min how to ascertain within 5 deg the pitch and roll information presented on their torso display. The pitch and roll limits of the current display are ±15 deg and ±45 deg respectively. Alternatively, subjects using the device in a closed-loop configuration could position by tactile cues alone the simulated attitude of the aircraft to within 5 deg of accuracy in pitch and roll. Similar accuracies were attained in actual flights in aircraft with no reference to instruments or outside visual cues. When used to convey constant velocity, the column in the direction of the desired perception was stimulated first and followed by sequential activation of the three paired columns to each side of the first column stimulated. The perception was similar to the feeling of directed flow of fluid over the torso with the direction defined by the first column stimulated and the velocity
20-4
determined by the stimulus interval between activation of column pairs. DISCUSSION Preliminary results both in aircraft and in the laboratory indicate that orientation awareness can be maintained nonvisually in environments known to produce spatial disorientation. This device has many applications in addition to aircraft control. When used in aircraft simulators (either with or without a motion base) to indicate attitude and changes in attitude or velocity, it will provide the pilot or trainee with additional cues that can be used for aircraft control, when transferring to the aircraft. Studies by the U.S. Army (Simmons, Lees, and Kimbal, 1978a,b) indicate that pilots in instrument flight conditions spend more than 50 % of their visual scan time attending to two instruments, the ADI/attitude indicator and the directional gyro. By presenting this information nonvisually, pilots will be free to attend to other tasks and instruments that do require vision attention. Thus, not only will the introduction of spatial orientation information offered by tactile cues reduce spatial disorientation mishaps, it will also improve the mission effectiveness of the operator. A person who is tapped by another on the shoulder or torso reflexively turns his attention to the area stimulated. The torso suit can take advantage of this basic reflex to direct attention to any target that is on sonar or radar or is being electronically tracked. Currently, for pilots, naval flight officers, or radar operators to acquire targets, they must devote their attention to the radar screen, cognitively ascertain the direction to which to direct their gaze, and then carry out the motor act of acquiring the target. In high workload environments with multiple targets, it is possible to represent one or possibly more targets tactually and aid pilots/operators in the rapid identification of friend or foe. An increasingly prevalent training technique in the military is interactive simulation of war theaters with multiple pilots engaged in the same dogfight, but with each in their own simulator. Tactile
cues will improve the situational awareness of all participants. This device has obvious applications to personnel in command and control centers who need to maintain an awareness of geographic location of incoming information from a wide variety of platforms (ship, aircraft, tanks, infantry, satellite systems, etc.) from multiple geographic sites. Civilian applications include air traffic controllers and dispatchers. Space applications to improve astronaut performance fall into several categories. In space, astronauts are deprived of any constant proprioceptive reference to indicate down. An appropriate model of our torso suit could be interfaced with an accurate inertial platform reference to give astronauts a continuous perception of orientation at a low level of awareness, in a manner analogous to the situation on Earth. In extra vehicular activities (EVA), this device could be used to present a constant point of reference, such as the floor of the space shuttle, the position of a satellite or telescope being repaired, or even the direction of the center of the earth. During EVA activities, the only sensory indication of velocity is currently provided by vision. Using the velocity presentation mode mentioned earlier, the astronaut can have indications of motion as good or even better that those available on Earth. This device can thus overcome the limitations of the vestibular system, which does not detect constant rotation or constant velocity, and instead of providing "virtual" reality, can go one step further to "hyper-reality" or better than normal maintenance of orientation. This device offers a countermeasure to the sensory-motor disorders associated with adaptation to the microgravity conditions in space and readaptation to 1 G on returning from earth orbit. Space motion sickness, or space adaptation syndrome, has been attributed either wholly or in part to a rearrangement of proprioceptive sensory information, especially the absence of continuous vestibular otolith stimulation and reduced somatosensory information. Some astronauts have indicated that it is discomforting on entering orbit to lose the
20-5
sense of orientation awareness. By providing astronauts with a somatosensory reference to "down," and an enhanced awareness of motion (velocity information), they should be able to maintain an accurate perception of position and motion during transition periods. Finally, the problem of sensory-motor incoordination on return to 1 G may be reduced by providing continuous position and motion cues throughout the mission. For example, we may be able to attenuate the otolith tilt-translation reinterpretation effect (Parker, 1985) that develops in space and disturbs an astronaut's sensory-motor readaptation to 1 G upon reentry. The torso suit would provide accurate somatosensory information that would not confirm the troublesome vestibular signals that cause this effect. Thus, we would expect that if astronauts were trained to attend to this reliable source of information, the magnitude of this problem could be significantly reduced. There are a variety of well-known tactile illusions that will serve to enhance the effectiveness of tactile torso and limb devices. When using multiple stimulators, as in the torso vest, it is possible to take advantage of basic psychophysical principles to effect changes in perceived magnitude, position, and motion of the stimulus. For example, the perceived magnitude of a pair of vibrotactile stimuli presented in close temporal succession is dependent on the relative frequencies of the two stimuli (Verrillo and Gescheider, 1975). The perceived position of two tactile pulses presented in rapid succession at different spatial locations will appear as a single moving source (Kirman, 1974). The latter principle was used in the torso suit to create the sensation of motion or directional flow over the thorax. Using these and other sensory illusions, it is actually possible to create compelling position and motion perceptions using fewer tactors than in our current prototype suit. Hans-Leukas Teuber (1956) demonstrated that the number of dimensions of a perception will exceed that of the physical stimuli. By varying only the frequency and intensity, his subjects
experienced changes in pitch, density, volume, and loudness. Given the large number of available stimulus parameters (intensity, frequency, body position, interstimulus interval, multiple tactors, etc.), it will be possible to tactually present a wide variety of perceptions to convey position, motion, and target information in a way analogous to the observations of Teuber. This tactile interface will contribute to basic research concerning haptic contributions to the interaction and integration of sensory information and vestibular brainstem reflexes, as well as the perceptual phenomena perceived at the cortical level. Inclusion of the haptic component will permit us to further refine and extend our model of sensory-motor interaction. The ultimate practical goal is to provide accurate predictive information to enhance the effectiveness of human factors engineers in the design of improved man-machine interfaces. ACKNOWLEDGMENTS This research was sponsored in part by the Naval Medical Research and Development Command under project number 63706N M0096.002-7056. The views expressed in this article are those of the authors and do not reflect the official policy or position of the Department of Defense, the Department of the Navy, nor the U. S. Government. Volunteer subjects were recruited, evaluated, and employed in accordance with the procedures specified in the Department of Defense Directive 3216.2 and Secretary of the Navy Instruction 3900.39 series. These instructions are based on voluntary informed consent and meet or exceed the provision of prevailing national and international guidelines. REFERENCES Cushman, W. B. 1993. A parallel printer port to matrix driver with high current DAC output. Behavior Research Methods, Instruments, and Computers. 25 (1): 48-52.
20-6
Gottlieb, G. 1971. Ontogenesis of sensory function in birds and mammals. In: Tobach, E., Avonsen, L. R., and Shaw, E. (Eds.) The Biopsychology of Development. New York: Academic Press.
Rupert, A. H., Mateczun, A. J., and Guedry, F. E. 1990. Maintaining Spatial Orientation Awareness. AGARD CP-478; Symposium at Copenhagen, Denmark, 2-6 October, 1989.
Kirman, J. H. 1974. Tactile apparent movement: The effects of interstimulusonset interval and stimulus duration. Perception and Psychophysics. 15: 1-6.
Simmons, R. R., Lees, M.A., and Kimball, K.A. 1978a. Visual Performance/Workload of Helicopter Pilots During Instrument Flight. In: AGARD Operational Helicopter Aviation Medicine.
Meredith, M. A. and Stein, B. E. 1986a. Visual, auditory, and somatosensory convergence on cells in superior colliculus results in multisensory integration. Journal of Neurophysiology. 56: 640-662.
Simmons, R. R., Lees, M.A., and Kimball, K. A. 1978b. Aviator Visual Performance: A Comparative Study of a Helicopter Simulator and the UH-1 Helicopter. In: AGARD Operational Helicopter Aviation Medicine.
Meredith, M. A. and Stein, B. E. 1986b. Spatial factors determine the activity of multisensory neurons in cat superior colliculus. Brain Research. 365: 350-354.
Teuber, H.-L., and Liebert, R. S. 1956. Auditory Vection. Am. Psychol. 11: 430.
Parker, D. E, Reschke, M. F., Arrott, A. P., Homick, J. L., and Lichtenberg, B. K. Otolith Tilt-Translation 1985. Reinterpretation Followin Prolonged Weightlessness: Implications for Preflight Training. Aviation,56: Space, and Environmental Medicine. 601-6.
Turner, D. C., and Bateson, P., (Eds.) 1988. The Domestic Cat: The Biology of Its Behaviour. Cambridge: Bath Press. Verrillo, R. T., and Gescheider, G. A. 1975. Enhancement and summation in the perception of two successive vibrotactile stimuli. Perception and Psychophysics. 18: 128-136.
Visual cues used to locate mother
Vestibular Sensitivity Tactile
Auditory
Hearing well
Sensitivity
Orientation
developed
Weeks
-9 -8 -7 -6 -5 -4 -3 -2 -1
Conception
0
Birth
I
I
1 2
3 4
5
6 78
9 10 11 12
10mos. Se xual Maturity
Gestation Figure 1
Timetable outlining sensory development of the domestic cat. (Turner and Bateson, 1988)
20-7
Fig 2 a) Tactor placement on torso vest with b) grid replacement of external environment superimposed.
SOFTWARE
GYRO
SYNCRO GYRORESOLVER
SENSOR
PARALLEL
SERIAL
PORT
PORT COMPUTER 486SX25
GENERATOR __ _
ROLROLL
MATRIX
I
DRIVER VIBRATOR SELECTION
I
PROCESS
I
I
PULSE
ACTUAL
ATTITUDE
PERCEIVED
ATTITUDE
ADJUSTMENT
ATTITUDE
VIBROTACTILE SUIT
PILOT CONTROL
Figure 3 Schematic illustrating components of prototype tactile orientation system.
REPORT DOCUMENTATION PAGE 1. Recipient's Reference
2. Originator's Reference
AGARD-CP-541 5. Originator
3. Further Reference
4. Security Classification of Document
UNCLASSIFIED/ UNLIMITED
ISBN 92-835-0746-0
Advisory Group for Aerospace Research and Development North Atlantic Treaty Organization 7 rue Ancelle, 92200 Neuilly sur Seine, France
6. Title
VIRTUAL INTERFACES: RESEARCH AND APPLICATIONS
7. Presented at
the Aerospace Medical Panel Symposium held in Lisbon, Portugal, 18th - 22nd October 1993.
8. Author(s)/Editor(s)
9. Date
Various
May 1994
10. Author(s)/Editor's Address
11. Pages
Various
12. Distribution Statement
192
There are no restrictions on the distribution of this document. Information about the availability of this and other AGARD unclassified publications is given on the back cover.
13. Keywords/Descriptors
Human systems Aerospace medicine Human factors engineering Sensory processing Display devices Human interface
Virtual technologies Simulation Telerobotics Vision Hearing Haptics
Balance Spatial orientation Situational awareness Cockpits Pilots Training
14. Abstract
Recent advances in technologies for information display and sensing of human movements, combined with computer based models of natural and artificial environments, have led to the introduction of so-called virtual interfaces. Virtual interfaces offer increased flexibility and naturalness, so are considered for use in several domains including aviation, training, design, simulation. Papers presented at this symposium considered issues of research and application in virtual interfaces broadly defined. Issues of technology integration for system development were considered separately from issues of movement monitoring or sensory display. Issues of human performance measurement were presented in the context of both research and application.
CID0 CZ
'
6) 6)
6) 6ý6
80
0
--
mb Ln
'.'
Ur)
cEc ~06~~96)~.. *U
E6
-CC)~L,
C)~ 0
PyU0
~~
0~
Z
" -9
606)
000
6)6)
b6) 0
~0
U
0
>
t9'
r-
c.nE
0
U
C
00 u
~~~ 006626)
0 0d
(0
6)
cz 'I9 7E. E
9.
..
)0
I~ 6)
=6
> 0
(D
.
Z;
;.a6)~
0
66
0
C)
C
~
tC)
m
4.9 06) r
C~
m0
-
6) )
'9
0
-u
a0
'd
6)
C,
bC)
01)66
6d02
6)0~~I
dL
6ýC
>.
uE
9C)
*
E
05E
E 5: 0ý
6)66l
6
l9.-9
6/)~
>b
"
m .8 9L
-0
zZ
2
U
9
d
6
8l'
. 6)0r).uC)
6
c13 0 66
3
E
t
_
E .
r
CID
't
>-C~
0
*0a.
C)C
~
C)
C.
C.)a
oj
20 uC
>
E o*2.E
I) C. faCa
'IT
'ITj Ca
o
''I
u
IS
-
>
n3
... a-
a-
C't Ca~~~~Cca
.-
C
>
uC
C. .
Ca
C)
2: ,
E
.)
.
0.
Cvt
Ca
It-
Ca2
.2
-'
-z
~ cu) 5
P
Ca
.
2Da-.ý:
u
C,
Ca.
-
o
NATO
OTAN
7 RUE ANCELLE • 92200 NEUILLY-SUR-SEINE
DIFFUSION DES PUBLICATIONS
FRANCE
AGARD NON CLASSIFIEES
T616copie (1)47.38.57.99
• T61ex 610 176
Aucun stock de publications n'a exist6 ý AGARD. A partir de 1993, AGARD ddtiendra un stock limita des publications assocides aux cycles de conferences et cours spdciaux ainsi que les AGARDographies et les rapports des groupes de travail, organisds et publids ý partir de 1993 inclus. Les demandes de renseignements doivent 8tre adressdes hAGARD par lettre ou par fax ý l'adresse indiqu&e ci-dessus. Veuillez nepast'lWphoner. La diffusion initiale de toutes les publications de I'AGARD est effectude aupr~s des pays membres de I'OTAN par l'intermddiaire des centres de distribution nationaux indiquds ci-dessous. Des exemplaires suppl~mentaires peuvent parfois ktre obtenus aupr~s de ces centres (A l'exception des Etats-Unis). Si vous souhaitez reqevoir toutes les publications de I'AGARD, ou simplement celles qui concernent certains Panels, vous pouvez demander h &tre inclu sur la liste d'envoi de l'un de ces centres. Les publications de I'AGARD sont en vente aupr~s des agences indiqudes ci-dessous, sous forme de photocopie ou de microfiche. CENTRES DE DIFFUSION NATIONAUX ALLEMAGNE ISLANDE Fachinformationszentrum, Director of Aviation Karlsruhe c/o Flugrad D-7514 Eggenstein-Leopoldshafen 2 Reykjavik BELGIQUE ITALIE Coordonnateur AGARD-VSL Aeronautica Militare Etat-Major de la Force AMrienne Ufficio del Delegato Nazionale alI'AGARD Quartier Reine Elisabeth Aeroporto Pratica di Mare Rue d'Evere, 1140 Bruxelles 00040 Pomezia (Roma) CANADA LUXEMBOURG Directeur du Service des Renseignements Scientifiques VoirBelgique Minist~re de la Defense Nationale Ottawa, Ontario K1A 0K2 NORVEGE Norwegian Defence Research Establishment DANEMARK Danish Defence Research Establishment Attn: Biblioteket P.O. Box 25 Ryvangs A1l6 1 N-2007 Kjeller P.O. Box 2715 DK-2100 Copenhagen 0 PAYS-BAS ESPAGNE Netherlands Delegation to AGARD INTA (AGARD Publications) National Aerospace Laboratory NLR Pintor Rosales 34 P.O. Box 90502 28008 Madrid 1006 BM Amsterdam ETATS-UNIS PORTUGAL NASA Headquarters Forqa Adrea Portuguesa Attention: CF 37, Distribution Center Centro de Documentaqdo e Informaqdo 300 E Street, S.W. Alfragide Washington, D.C. 20546 2700 Amadora FRANCE ROYAUME UNI O.N.E.R.A. (Direction) Defence Research Information Centre 29, Avenue de la Division Leclerc Kentigern House 92322 Chatillon Cedex 65 Brown Street GRECE Glasgow G2 8EX Force Air Hellenic Air War College TURQUIE Scientific and Technical Library Milli Savunma Ba~kanhli (MSB) Dekelia Air Force Base ARGE Daire Ba~kanhli (ARGE) Dekelia, Athens TGA 1010 Ankara Le centre de distribution national des Etats-Unis ne detient PAS de stocks des publications de I'AGARD. D'6ventuelles demandes de photocopies doivent &treformulres directement aupr~s du NASA Center for Aerospace Information (CASI) Al'adresse suivante: AGENCES DE VENTE NASA Center for ESA/Information Retrieval Service The British Library Aerospace Information (CASI) European Space Agency Document Supply Division 800 Elkridge Landing Road 10, rue Mario Nikis Boston Spa, Wetherby Linthicum Heights, MD 21090-2934 75015 Paris West Yorkshire LS23 7BQ United States France Royaume Uni Les demandes de microfiches ou de photocopies de documents AGARD (y compris les demandes faites aupr~s du CASI) doivent comporter la ddnomination AGARD, ainsi que le numdro de srrie d'AGARD (par exemple AGARD-AG-315). Des informations analogues, telles que le titre et la date de publication sont souhaitables. Veuiller noter qu'il y a lieu de specifier AGARD-R-nnn et AGARD-AR-nnn lors de la commande des rapports AGARD et des rapports consultatifs AGARD respectivement. Des rdfdrences bibliographiques completes ainsi que des rdsumes des publications AGARD figurent dans les journaux suivants: Scientifique and Technical Aerospace Reports (STAR) Government Reports Announcements and Index (GRA&I) publi6 par la NASA Scientific and Technical publi6 par le National Technical Information Service Information Program Springfield NASA Headquarters (JTT) Virginia 22161 Washington D.C. 20546 Etats-Unis Etats-Unis (accessible 6galement en mode interactif dans la base de donnmes bibliographiques en ligne du NTIS, et sur CD-ROM)
Imprimý par Specialised PrintingServices Limited 40 Chigwell Lane, Loughton, Essex IG10 3TZ
NATO
+
OTAN
7 RUE ANCELLE • 92200 NEUILLY-SUR-SEINE
DISTRIBUTION OF UNCLASSIFIED
FRANCE
AGARD PUBLICATIONS
Telefax (1)47.38.57.99 • Telex 610 176 AGARD holds limited quantities of the publications that accompanied Lecture Series and Special Courses held in 1993 or later, and of AGARDographs and Working Group reports published from 1993 onward. For details, write or send a telefax to the address given above. Please do not telephone. AGARD does not hold stocks of publications that accompanied earlier Lecture Series or Courses or of any other publications. Initial distribution of all AGARD publications is made to NATO nations through the National Distribution Centres listed below. Further copies are
sometimes available from these centres (except in the United States). If you have a need to receive all AGARD publications, or just those
relating to one or more specific AGARD Panels, they may be willing to include you (or your organisation) on their distribution list. AGARD
publications may be purchased from the Sales Agencies listed below, inphotocopy or microfiche form,
NATIONAL DISTRIBUTION CENTRES BELGIUM
LUXEMBOURG
See Belgium Coordonnateur AGARD - VSL Etat-Major de la Force Adrienne NETHERLANDS Quartier Reine Elisabeth Netherlands Delegation to AGARD Rue d'Evere, 1140 Bruxelles National Aerospace Laboratory, NLR CANADA P.O. Box 90502 Director Scientific Information Services 1006 BM Amsterdam Dept of National Defence Ottawa, Ontario K1A 0K2 NORWAY Norwegian Defence Research Establishment DENMARK Attn: Biblioteket Danish Defence Research Establishment P.O. Box 25 Ryvangs All6 1 N-2007 Kjeller P.O. Box 2715 DK-2100 Copenhagen 0 PORTUGAL Forqa AMrea Portuguesa FRANCE Centro de Documentaqfo e Informagdo O.N.E.R.A. (Direction) Alfragide 29 Avenue de la Division Leclerc 2700 Amadora 92322 Chdtillon Cedex GERMANY SPAIN Fachinformationszentrum INTA (AGARD Publications) Karlsruhe Pintor Rosales 34 D-7514 Eggenstein-Leopoldshafen 2 28008 Madrid GREECE TURKEY Hellenic Air Force Milli Savunma Ba~kanliki (MSB) Air War College ARGE Daire Ba~kanlhgi (ARGE) Scientific and Technical Library Ankara Dekelia Air Force Base Dekelia, Athens TGA 1010 UNITED KINGDOM Defence Research Information Centre ICELAND Kentigern House Director of Aviation 65 Brown Street c/o Flugrad Glasgow G2 8EX Reykjavik ITALY UNITED STATES Aeronautica Militare NASA Headquarters Ufficio del Delegato Nazionale alI'AGARD Attention: CF 37, Distribution Center Aeroporto Pratica di Mare 300 E Street, S.W. 00040 Pomezia (Roma) Washington, D.C. 20546 The United States National Distribution Centre does NOT hold stocks of AGARD publications. Applications for copies should be made direct to the NASA Center for Aerospace Information (CASI) at the address below. SALES AGENCIES NASA Center for ESA/Information Retrieval Service The British Library Aerospace Information (CASI) European Space Agency Document Supply Centre 800 Elkridge Landing Road 10, rue Mario Nikis Boston Spa, Wetherby Linthicum Heights, MD 21090-2934 75015 Paris West Yorkshire LS23 7BQ United States France United Kingdom Requests for microfiches or photocopies of AGARD documents (including requests to CASI) should include the word 'AGARD' and the AGARD serial number (for example AGARD-AG-315). Collateral information such as title and publication date is desirable. Note that AGARD Reports and Advisory Reports should be specified as AGARD-R-nnn and AGARD-AR-nnn, respectively. Full bibliographical references and abstracts of AGARD publications are given in the following journals: Scientific and Technical Aerospace Reports (STAR) Government Reports Announcements and Index (GRA&I) published by NASA Scientific and Technical published by the National Technical Information Service Information Program Springfield NASA Headquarters (JTT) Virginia 22161 Washington D.C. 20546 United States United States (also available online in the NTIS Bibliographic Database or on CD-ROM)
Printedby Specialised PrintingServices Limited 40 Chigwell Lane, Loughton, Essex IG1O 3TZ