Hindawi Publishing Corporation e Scientific World Journal Volume 2014, Article ID 654974, 9 pages http://dx.doi.org/10.1155/2014/654974
Research Article Based on Regular Expression Matching of Evaluation of the Task Performance in WSN: A Queue Theory Approach Jie Wang, Kai Cui, Kuanjiu Zhou, and Yanshuo Yu School of Software Technology, Dalian University of Technology, Dalian 116620, China Correspondence should be addressed to Kai Cui; cuikai
[email protected] Received 4 July 2014; Accepted 16 August 2014; Published 23 October 2014 Academic Editor: Fei Yu Copyright © 2014 Jie Wang et al. This is an open access article distributed under the Creative Commons Attribution License, which permits unrestricted use, distribution, and reproduction in any medium, provided the original work is properly cited. Due to the limited resources of wireless sensor network, low efficiency of real-time communication scheduling, poor safety defects, and so forth, a queuing performance evaluation approach based on regular expression match is proposed, which is a method that consists of matching preprocessing phase, validation phase, and queuing model of performance evaluation phase. Firstly, the subset of related sequence is generated in preprocessing phase, guiding the validation phase distributed matching. Secondly, in the validation phase, the subset of features clustering, the compressed matching table is more convenient for distributed parallel matching. Finally, based on the queuing model, the sensor networks of task scheduling dynamic performance are evaluated. Experiments show that our approach ensures accurate matching and computational efficiency of more than 70%; it not only effectively detects data packets and access control, but also uses queuing method to determine the parameters of task scheduling in wireless sensor networks. The method for medium scale or large scale distributed wireless node has a good applicability.
1. Introduction Most wireless sensor network (WSN) missions are to detect and environmental reporting events. Since wireless sensor networks usually work under severe environments, their performance is often difficult or impossible to assess accurately. Therefore, how to evaluate the performance in the wireless sensor network for task communication is the research emphasis in recent years, which becomes one of the most attractive. Most current researches have focused on how to provide authentication, confidentiality, integrity, nonrepudiation, and access control ad hoc [1, 2]. Distributed authentication is a very common approach to solve ad hoc security issues [3, 4]. However, highly secure ad hoc approach in certain circumstances the lack of a common approach [5, 6]. Because regular expressions provide excellent communication skills and flexibility, they have been widely used in a variety of network security applications, such as antivirus scanning, network intrusion detection and prevention systems [7], firewalls, and traffic classification and monitoring [8]. Deterministic finite automata (DFA) and nondeterministic finite automata (NFA) are the typical application of
regular expressions. But this requires a certain store or timeconsuming cycle tolerable for resource-constrained wireless sensor condition is basically meeting the application requirements. Performance evaluation based on the communication task queuing model theory methods [9, 10], in recent years, published several class methods. However, previous methods suffer from the following disadvantages. In typical queuing model, customer arrival and the service processing are independent. However, they are relative to the sensor communication scheduling tasks. Sensors cannot receive communication and run the state machine at the same time. Usually the sensor is constant communication the occupied and communication task processing footprint. The arrival of the communication task has different priorities. The high-priority tasks can preempt the low-priority tasks, and the low-level tasks continue to run after the high-priority tasks processing is complete. Time constraints: the traditional system analysis often considered the average time while the task’s communication between wireless sensors needs to consider the maximum time after which the time state machine will transmit to another state. The method of finite automata has researched in the regular expression matching system security for the wireless
2 sensor networks, and matching performance is ignored to further discussion [11]; similarly, the evaluation of the performance based on the queue model in the wireless sensor network (WSN) has been discussed, but the system security matching method not to do more research [12]; therefore, we combined with the previous work, in this paper, the security matching method of finite automata, and the performance of the queuing model was discussed in WSN. The rest of the paper is organized as follows. Section 2 reviews regular expression two-stage matching strategy. Section 3 explains the regular expression matching approach. In Section 4, model of task scheduling based on queuing theory is proposed. In Section 5, the priority queue with two classes of tasks is proposed. We describe the performance of the wireless sensor communication tasks based on queuing theory in Section 6. In Section 7, simulations are conducted for illustrating the performance of our scheme. Finally, we conclude this paper in Section 8.
2. Regular Expression Two-Stage Matching Strategy [11] Recent research has paid much attention to reduction of the huge memory usage for DFA-based regular expression matching, as DFA is the preferred representation of regular expression matching. As a matter of fact, they can only achieve memory reduction for specific regular expression or signature sets of simple. High-speed regular expression matching for real-world signature sets that contain thousands of complex regular expressions can be hardly achieved. In modern networking devices, TCAMs (off-the-shelf chips) have been widely deployed. However, even if techniques such as D2FA [13, 14] are employed, tables of DFA and NFA are too big to be stored in TCAMs. In 2012, the RegexFilter (a highspeed and memory efficient technique) was presented by Liu et al. [15]. Regular expression matching was been sped up by quickly searching these regular expressions that may match each arriving item as little as possible. However, this method only cares about the profiteering stage and left the verifying stage without any optimization. 2.1. Profiteering Stage. For instance, there is a regular expression set called 𝑅; another set 𝑅 is constructed so that any unmatched item of 𝑅 is also an unmatched item of 𝑅. An item that does not match any regular expression in the set [15] is unmatched item of a regular expression set. Given an item 𝑖, it will match against 𝑅 to get set 𝑂(𝑅 ; 𝑖) firstly. If 𝑂(𝑅 ; 𝑖) is empty, it does not obviously match any member in 𝑅 and therefore this item can be skipped safely; otherwise, matching it against 𝑇 (𝑅; 𝑂(𝑅 ; 𝑖)) will continue, where 𝑂(𝑅; 𝑖) ⊆ 𝑇 (𝑅; 𝑂(𝑅 ; 𝑖)) ⊆ 𝑅. Figure 1 shows the relationship between match items and print (𝑅 ). Because most items are unmatched and the match cost of 𝑅0 is much less than that of 𝑅, the overall throughput of this approach can be much higher than directly matching against 𝑅. 2.2. Verifying Stage. In the verifying stage, how to build correlation from profiteering print and reduce the memory
The Scientific World Journal
Match items R
Print R
All items
Figure 1: Relationship between profiteering stage set and match items.
cost of DFA tables is the main point that needs to be handled. A DFA is presented by a 5-tuple (𝑄; ∑; 𝛿; 𝑞0 ; 𝐴) where 𝑄 is a set of states, 𝑃 is an alphabet, ∑ ×𝑄 → 𝑄 is the transition function, 𝑄0 is the start state, and 𝐴 ⊆ 𝑄 is a set of accepting states. The major part we should deal with is the DFA-based algorithms with the large amount of memory requirement to store the transition table. Software-based [16–18] and FPGAbased [19, 20] regular expression matching algorithms are traditional approaches with many shortcomings. TCAM-based solutions have the advantages of easy encoding and high parallelism [13]. Three novel techniques, transition sharing, table consolidation, and variable striding, were proposed by Liu et al. to reduce TCAM space and improve matching speed.
3. Regular Expression Matching Approach The selecting process of regular expression “𝑎[𝑏𝑐]𝑑 : [𝑏𝑐]” with five atoms is shown in Figure 2. The parameter 𝛽 = 256 is the boundary we define and the expression size of every print should be less than 𝛽. The selecting stage begins from the first atom. The curr pointer keeps moving to the next atom if ES(𝑟) value of the regular expression print between the begin pointer and end pointer until the curr pointer arrives at the fourth atom “⋅”, ES(𝑎[𝑏𝑐]𝑑 :) = 1 ∗ 2 ∗ 1 ∗ 256 = 512 > 𝛽. Condition ES(𝑟) < 𝛽 does not hold, and print 𝑎[𝑏𝑐]𝑑 is selected. Then a directed line from 𝑟𝑖 to 𝑃𝑖 to mark the correlation relationship is constructed. Then, in step 2, it is included in the already selected print “𝑎[𝑏𝑐]𝑑”, although [𝑏𝑐]𝑑 satisfies the condition. According to section A, 𝑎[𝑏𝑐]𝑑 has higher matching probability (MP) than [𝑏𝑐]𝑑; thus, [𝑏𝑐]𝑑 is not selected. The same criteria are processed in steps 3, 4, and 5 to select print. After selecting the print, a relationship of this graph called correlation sequence is generated as a directed graph from 𝑟[1;...;𝑛] to 𝑝[1;...;𝑚] . Every package will be transmitted across certain nodes 𝑁1 ; 𝑁2 ; . . . ; 𝑁𝑛 according to ad hoc wireless protocol. These nodes will be grouped into two groups: one group for profiteering stage and the other group for verifying stage. Extra package fields are adopted to make each node work collaboratively and communicate with the other.
The Scientific World Journal
3 1 a
2
2
[bc]
d
512 ·
2
2
Curr 512
[bc]
d
Begin a
·
Begin 256 ·
1 a
[bc]
d Begin
a
[bc]
d
[bc]
[bc]
[bc]
d
[bc]d is not selected
Curr 512
256 ·
Begin a
a[bc]d is selected
·
Begin
[bc]
d · is selected
Curr 512 [bc]
· is not selected
Curr 2 [bc]
[bc] is selected
Curr
ri = a[bc]d · [bc] r1
ri .. .
rn
p1 . . . p1 a[ab]d
ps d · pk [bc] .. . pm
Figure 2: Process of generating print 𝑝𝑖 from 𝑟𝑖 .
Package Prefiltering and get p[1,...,m]
p1 p2 F(gi , p[1,...,m] ) . . . gi pn Calculate
1
C1
2
P1 P2 F(gi , p[1,...,m] ) . . . Pn gi Calculate
3
C2
4. Queue Model Description [12]
4 5 C3
7 6 C4
is simplified to be addition only. At first, the feature vector 𝑝𝑖 needs to be stored so that the sum of 𝑝𝑖 can be calculated to get 𝐹(𝑔𝑖 ; 𝑝[1;...;𝑚] ). The profiteered correlation sequence 𝑝[1⋅⋅⋅𝑚] will be generated in node 2 after profiteering stage in node 1. Then, if 𝑝[1⋅⋅⋅𝑚] is not empty, the 𝐹(𝑔𝑖 ; 𝑝[1;...;𝑚] ) is calculated in node 2 by adding the feature vector 𝑝𝑖 . Verifying process will continue in node 2 using the group 𝑔𝑖 in its memory when 𝐹(𝑔𝑖 ; 𝑝[1;...;𝑚] ) is larger than 𝜓. Otherwise, the package will be transmitted to the next hop and 𝑔𝑗 will be matched continually.
p1 p2 F(gi , p[1,...,m] ) . . . pn gi Calculate
Figure 3: Matching process of ad hoc packages.
The package matching process is demonstrated in Figure 3. Taking the limited computing power of each wireless node into consideration, the calculation of 𝐹(𝑔𝑖 ; 𝑝[1;...;𝑚] )
The pattern of communication between wireless sensors can be divided into two modes: the synchronous and the asynchronous modes. In synchronous mode, when a plurality of communication tasks are triggered, the tasks scheduling will be suspended. At this moment, the levels of query priority and processes priority are executed in sequence. This mode has a higher efficiency when the transmissions are not frequent. However, this will lead to an unacceptable high loss rate of the communication tasks when the transmissions are frequently triggered. In asynchronous mode, when the task to transmit, the scheduling will not immediately to process; however, the priority communication tasks are added to the queue in sequence, then the wireless sensor through state machine to fetch the head of the communication task in
4
The Scientific World Journal IE
INI0
IE
INI1
IE
INIn
j
00
u2 𝜆2
𝜇1 𝜆 1
10
···
20
𝜆2
S0
𝜆2
b,
(x
:= e, x
S3
S4
x
2)
2)?
, y:
S1
S5
f, (x > 2, y > 4)?
d, (
x>
2, y
5
40
=0
,y
)? >4
11
21
𝜆2
31
12
𝜆2
41
03
13
𝜆1 22
𝜆2
23
.. .
𝜆1 32
𝜆2
33
𝜆1
𝜇1 𝜆 1
𝜆2
u2 𝜆2
𝜆1
𝜇1 𝜆 1
𝜇1 𝜆 1
a, (
0, y
:=
0
c, (x = 2)?, y: = 0
30
02
𝜇1 𝜆 1
𝜇1 𝜆 1 . ..
u2 𝜆2
𝜇1 𝜆 1
𝜇1 𝜆 1 i
01
42
𝜆2
43
···
:=
0
Figure 4: Queuing theory model of the wireless sensor network with 𝑛 communication task’s scheduling.
the queue, and executes the task scheduling function. This model greatly reduces the tasks’ loss, thus determining the wireless sensor network (WSN) which is formed in one of the biggest communication task captains that are of great help to guide sensor network design. Figure 4 shows 𝑛-task communication scheduling based on the queuing theory model in the wireless sensor network. Input process: communication tasks are divided into 𝑁 levels. The first level has the highest priority, the second priority has secondary priority, and so forth. The 𝑁 level has the lowest priority. Assume that each communication task interval is the Poisson distribution or negative exponential distribution. The average time of the interval of the 𝑖th level communication task is 𝜆 𝑖 . Queuing rules: the task responses as soon as the communication task arrival by the background task execution call service, when the task is not scheduling executed in the system. The high-priority communication tasks priority is executed in sequence until the end of all high-priority tasks in the queue. When the low-priority tasks are executing, the high-priority task takes over the low-priority task and the low-priority task will return to the queue, the same priority communication task followed by FCFS rues. Service process: wireless sensor network uses the state machine to drive communication task process, assuming that each time of the communication task is exponential distribution, and the average service of level 𝑖 communication task rate is 𝜇𝑖 . The WSN communication tasks queue performance parameters [21]: (a) absolute throughput 𝐴 is the average
Figure 5: System state spaces and the transfer process.
time of task service in the unit time; (b) relative throughput 𝑄 is the ratio of all the severed tasks and all request tasks in the unit time; (c) the queue length of the average value 𝐿 𝑠 is all communication tasks in the WSN; (d) the queue of average length 𝐿 𝑞 is the average number of the waiting tasks in the queue; (e) the average sojourn times 𝑊𝑠 are the average of the task waiting for service time 𝑊𝑞 and the average service time 𝜏 (then 𝑊𝑠 = 𝑊𝑞 + 𝜏); (f) busy period 𝑇𝑏 is the random parameter; (g) system loss rates 𝑃loss are the overflow probability.
5. Priority Queue with Two Classes of Tasks Assume the queuing system is the preemptive priority. The 𝑖th task arrival is Poisson distribution with parameter 𝜆 𝑖 ; the service time is exponentially distributed with parameter 𝜇(𝑖 = 1, 2, . . .). Level 1th priority communication task is more priority than level 2th priority task. The system state is 𝐸 = {(𝑖, 𝑗); 0 ⩽ 𝑖, 0 ⩽ 𝑗}, 𝑖(𝑗) represents the 1(2) level of the communication tasks. The system state space distribution 𝑃(𝑖, 𝑗) = {𝑃𝑖,𝑗 , 0 ⩽ 𝑖, 0 ⩽ 𝑗}. The system transition process is depicted in Figure 5.
6. Tasks Performance Indicators in Sensor Network The priority tasks processing is as follows: when the 1st level task with parameters 𝜆 1 and the 2nd level task with parameters 𝜆 2 arrive, service times of two level tasks are the 𝜇1 and 𝜇2 , the task’s priority is reduced in sequence, and they share the waiting queue. The recursive calculation of probability matrix {𝑃𝑖,𝑗 , 0 ⩽ 𝑗 ⩽ 𝑁} needs a large amount of calculation; therefore, Matlab software is the necessary software. The M/M/1 preemptive priority queue model is used in the experiments. The arrival of the 𝑖th level task process as
The Scientific World Journal
5
(1) Steady-State Queue Length. Figure 6 shows the probability and the queue length as the 𝜇2 increasing. The vertical axis is the probability, and the horizontal axis is the queue length. In the probability matrix, 𝑃 = 0; the maximum queue length can be obtained in the system and assures that task’s buffer is enough to calculate the task’s loss. In the simulation, 𝐿 𝑠 = 40, which is the maximum queue length; when 𝑃 = 0, the arrivals of the task’s probability are 0; this means the possibility of task arrival does not exist, and the length does not grow. Then, when 𝑃 = 0, the length can be regarded as the largest queue length. (2) Average Sojourn Time. Assume that every level of task arrival is Poisson distribution. The 𝑖th level tasks are with the parameter 𝜆 𝑖 , the service time is the negative exponential distribution, and the average service time is 1/𝜇. The average sojourn times 𝑊𝑠1 and 𝑊𝑠2 are calculated in the following formulas: 𝑤𝑠1 =
1 , 𝜇 − 𝜆1
𝑤𝑞1 = 𝑤𝑠1 −
𝜆1 1 , = 𝜇 𝜇 (𝜇 − 𝜆 1 )
𝑤𝑠1 = (1 +
𝜆1 𝜆 1 1 )×( )− 1 × , 𝜆2 𝜇 − 𝜆1 − 𝜆2 𝜆2 𝜇 − 𝜆1
1 𝑤𝑞2 = 𝑤𝑠2 − . 𝜇
0.2 Probability
a Poisson distribution with the parameter 𝜆 𝑖 and service time as a negative exponential distribution with the parameter 𝜇𝑖 (𝑖 = 1, 2). The 1st level tasks are more priority than the 2nd level communication tasks. Assume the parameters are 𝜆 1 = 170, 𝜆 2 = 300, 𝜇1 = 500, and 𝜇2 = 700.
0.15 0.1 0.05
0
5
𝜆1 𝜆1 𝜆1 𝜆1
10
= 190, 𝜆2 = 220, 𝜆2 = 170, 𝜆2 = 100, 𝜆2
15 20 Queue length
25
30
35
= 230, 𝜇1 = 450, 𝜇2 = 500 = 230, 𝜇1 = 450, 𝜇2 = 500 = 300, 𝜇1 = 500, 𝜇2 = 500 = 230, 𝜇1 = 450, 𝜇2 = 500
Figure 6: Probability and queue length graph.
the processing speed of the state machine. Thus, the actual processing capability of the state machine is 𝜇𝑠𝑟 = (1 − 𝜌𝑖 )𝜇𝑠 , and the buffer length is 𝑚; then the loss rate is 𝑃lost =
(1)
1 − 𝜌𝑠𝑟 𝑚 𝜌 . 𝑚+1 𝑠𝑟 1 − 𝜌𝑠𝑟
(3)
In particular, 𝜌𝑠𝑟 = 𝜆 𝑠 /𝜇𝑠𝑟 . As to formula (1), the calculation which the state machine throughput computes is the following formula: (2)
(3) Average Waiting Time [22]. The same way, the queue of the average waiting times 𝑊𝑞1 and 𝑊𝑞2 is calculated as formula (1). (4) Wireless Sensor Usage Rate [23]. 𝑃 is the probability of the wireless sensor being idle; then 𝜌 = 1 − 𝑃, where 𝜌 is the occupancy probability of communication task [24, 25]. The greater 𝜌 is, the greater the occupancy probability is. 𝜌 is the service capacity or the load capacity. To consider the practicality of the model, the queue length is not unlimited. To determine the performance indicators, we take the queuing model of M/M/1/N and set the buffer capacity which is 𝑚. (5) Task’s Throughput. The communication task’s time 𝑇 is divide into three parts: they are the task’s processing time 𝑇𝑖 , the state machine processing time 𝑇𝑠 , and the wireless sensor idle time 𝑇𝑟 , 𝑇𝑖 +𝑇𝑠 ≈ 𝑇. The task’s processing is more priority than the state machine processing. Assume the tasks service strength is 𝜌𝑖 ; then the tasks processing time is 𝑇𝑖 = 𝜌𝑖 𝑇, and the state machine processing time is 𝑇𝑠 = (1 − 𝜌𝑖 )𝑇. The processing of the finite automata is the queuing model of M/M/1/N; the input processing with the parameter 𝜆 𝑠 and the service time with the parameter 𝜇𝑠 are the negative exponential distribution; length of the buffer is 𝑛. The processing speed of the communication task is faster than
𝜆 0 = 𝜆 𝑠 (1 −
1 − 𝜌𝑠𝑟 𝑚 𝜌 ). 𝑚+1 𝑠𝑟 1 − 𝜌𝑠𝑟
(4)
When the sensor network is severely overloading, the 𝜆 𝑠 ≫ 𝜇𝑠𝑟 , and the 𝜌𝑠𝑟 ≫ 1. As to formula (2), formula (5) is calculated, due to formula (5), and the speed of the parameter 𝜆 𝑖 affects the performance of the task processing; the greater 𝜆 𝑖 is, the lower the performance of the task processing is. When the communication tasks processing rate 𝜇𝑖 and the state machine processing rate 𝜇𝑟 remain unchanged, the performance curve is a straight line in which the slope is −𝜇𝑟 /𝜇𝑖 . Consider 𝜆 0 ≈ 𝜇𝑠𝑟 = (1 − 𝜌𝑖 ) 𝜇𝑟 = (1 −
𝜆𝑖 ) 𝜇𝑟 . 𝜇𝑖
(5)
(6) Wireless Sensor Processing Capacity. Assume the processing capacity is of 𝑁 mips; the quantity of the tasks which need to be executed in the task’s processing is 𝐶1 and the quantity of the tasks which need to be executed in the state machine is 𝐶2 ; then the task’s processing capacity computes as formula (3); formula (6) is as follows: 𝜌𝑠𝑟 =
𝜆𝑠 𝜆𝑖 𝜆𝑖 = = 𝜇𝑠𝑟 (1 − 𝜌𝑖 ) 𝜇𝑠 (1 − (𝜆 𝑖 /𝜇𝑖 )) 𝜇𝑠
𝜆𝑖 𝜆 𝑖 𝐶2 = . = (1 − (𝜆 𝑖 / (𝑁/𝐶1 ))) (𝑁/𝐶2 ) 𝑁 − 𝜆 𝑖 𝐶1
(6)
6
The Scientific World Journal Table 1: Experimental parameters setting. L7-Filter 161 1432 256 [0.23, 0.34] [0.75, 0.99] [0.5, 10]
Snort 166 1257 256 [0.23, 0.34] [0.75, 0.99] [0.5, 10]
40
Hops
Parameter Num. of RegExp Num. of DFA states 𝛽 (expression size) 𝜓 (relevance frequency) 𝜂 (match probability) 𝛾 (similarity)
𝑚+1
1 − [𝜆 𝑖 𝐶2 / (𝑁 − 𝜆 𝑖 𝐶1 )] 𝑚
=
(𝜆 𝑖 𝐶2 ) ∑𝑚 𝑖=0
𝑖
𝑚−𝑖
[𝑁 − 𝜆 𝑖 𝐶1 ] (𝜆 𝑖 𝐶2 )
20
0 10
𝑚
×
(𝜆 𝑖 𝐶2 )
[𝑁 − 𝜆 𝑖 𝐶1 ]
20
30
40
50 Nodes
60
70
80
90
70
80
90
Hops L7 Hops L7 Gi
𝑚
Average hops on Snort
(7)
50
.
Formula (7) is the relationship between the loss rate and the processing capacity. It helps to determine the requirements of the task’s processing.
40
Hops
𝑄 = 𝑃lost =
30
10
Take formula (6) into formula (3); the loss rate 𝑄 is 1 − (𝜆 𝑖 𝐶2 / (𝑁 − 𝜆 𝑖 𝐶1 ))
Average hops on L7
50
30 20 10
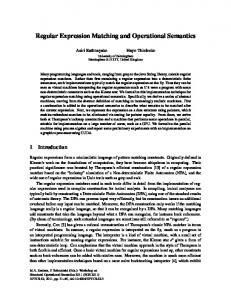
7. Experiment 7.1. Experiment Set. We evaluated our matching approach by regular expression sets extracted from two real-world systems named L7-Filter and Snort. L7-Filter is famous open source application layer traffic classier for Linux. The payload content of a flow and identified its application level protocol are reassembled through regular expression matching. Snort is a well-known open-source intrusion detection system, which can be configured to perform protocol analysis, probes, and content inspecting over online traffic by detecting a variety of worms. Two sets are chosen as 𝑅 = 𝑟1 ; 𝑟2 ; . . . ; 𝑟𝑛 to perform the experiments. The experiment parameters, ES, MP, are set, as shown in Table 1. Then, the local optimal value can be obtained during our experiments. Print size denotes the memory occupation of prints after the profiteering stage. Group number is the group number of correlative regular expression according to the parameter 𝛾. Average similarity is the average value of similarity in each group (see (2)). Package size is the testing packages length. Our simulation environment is based on NS-2 (Network Simulator, version 2). We set the number of nodes from 20 to 100. Number of suspicious package is the number of package that needs to be verified after the profiteering stage. Lastly, we calculate our experiment efficiency by their average executing cost: Efficiency = (Num of suspicious package/Total package Number) × (𝐹(𝑔𝑖 )/Group Number). Table 2 demonstrates that we can get a good efficiency promotion from 73.17% to 89.73%. A regular matching comparison was performed with our strategy and normal approach. The average hop and average 𝐹(𝐺𝑖 ) variation tendency and the number of nodes are shown in Figure 7. L7-Filter and Snort were tested separately. 𝑦-axis is hops and 𝑥-axis indicates the nodes number. From the results figure,
0 10
20
30
40
50 Nodes
60
Hops Snort Hops Snort Gi
Figure 7: Results of node average hops in NS-2.
a significant difference can be observed: when nodes are more than 30, the hops number of using 𝐺𝑖 decreases sharply. Figure 7 demonstrates that the matching approach can test and verify the packages efficiently when the number of wireless nodes is more than 30, which indicates that our approach can be well adapted to medium or large scale distributed wireless sensor network. On the other hand, there is no major difference in average hops when the system is handling a small group of wireless nodes. Comparing with other end-to-end strategies [9], our approach provides a well scalable way to construct intrusion detection system by integrating distributed wireless sensor nodes. Based on appropriate parameters, network attacks can be monitored by our system in an effective way. 7.2. Experiment of Queue Model. The experiment compares two groups of the performance results, which computed by the queuing theory and got the results from the software NS2. The NS2 platform simulated the STM32W108 sensor networking; we found that it is affected with the following parameters: the average length of stay for communication tasks, the average queue waiting time of tasks, the occupancy rate, and the task throughput.
The Scientific World Journal
7 Table 2: Experimental data. Parameters
Results
Print size Group number Average similarity Package size Number of suspicious package Efficiency
𝜂1 = 0.24, 𝛾2 = 0.77, 𝜓1 = 0.6
L7-Filter 𝜂2 = 0.26, 𝛾2 = 0.83, 𝜓2 = 5
𝜂3 = 0.36, 𝛾3 = 0.98, 𝜓3 = 10
𝜂1 = 0.24, 𝛾2 = 0.77, 𝜓1 = 0.6
Snort 𝜂2 = 0.26, 𝛾2 = 0.83, 𝜓2 = 5
𝜂3 = 0.36, 𝛾3 = 0.98, 𝜓3 = 10
0.15 MB 14 0.83 1024 B
0.31 MB 17 0.98 2048 B
0.12 MB 11 0.95 4096 B
0.25 MB 14 0.89 1024 B
0.39 MB 15 0.89 2048 B
0.24 MB 12 0.97 4096 B
253
83
122
41
114
48
89.73%
73.17%
76.5%
83.1%
77.94%
85.35%
Table 3: Experimental data statistics. Parameters Indicator
Queue length Average sojourn time(s) Average waiting time(s) Wireless sensor usage rate Sensor network throughput Tasks loss rate
Queuing theory model calculation results 𝜆 1 = 180, 𝜆 2 = 270, 𝜆 1 = 150, 𝜆 2 = 400, 𝜇1 = 𝜇2 = 700, 𝜇1 = 𝜇2 = 700, 𝑚 = 100 𝑚 = 35
NS2 simulation results 𝜆 1 = 180, 𝜆 1 = 150, 𝜆 2 = 400, 𝜆 2 = 400, 𝑚 = 100 𝑚 = 35
120 𝑊𝑠1 = 0.0019230 𝑊𝑠2 = 0.005385 𝑊𝑞1 = 0.0004945 𝑊𝑞2 = 0.004956
40 𝑊𝑠1 = 0.0018182 𝑊𝑠2 = 0.008485 𝑊𝑞1 = 0.0003924 𝑊𝑞2 = 0.0069565
112 𝑊𝑠1 = 0.0018240 𝑊𝑠2 = 0.005062 𝑊𝑞1 = 0.0003982 𝑊𝑞2 = 0.0045412
38 𝑊𝑠1 = 0.0016401 𝑊𝑠2 = 0.00849 𝑊𝑞1 = 0.0002116 𝑊𝑞2 = 0.006783
95.5%
81.9%
96.6%
88.3%
436.000
474.300
453.954
423.561
2.70677%
0.099%
3.77%
0.098%
Simulation software configuration communication tasks take the high-priority traffic and low-priority communications task two categories. Design the task’s scheduling function and assure 𝐶1 is approximately 400 operations and 𝐶2 is about 4000 operations. The program triggers communication according to the different experimental parameters 𝜆 and 𝑚 to test the influence on wireless sensor performance. The experiment of the results compares with calculation results of the method based on queuing theory to verify the creditability of the method. The statistics are shown in Table 3. When the sensor overloaded, the sensor network handles the task for a long time, and the state machine processing has no support to the sensor network. The actual speed of sensor processing 𝜇𝑠𝑟 is far less than 𝜇𝑠 . When the wireless sensor network needed specific requirements 𝑡 of the loss rate and the sensor throughput, it can take the speed of the scheduling to the requirements. For formula (7), it can understand the relationship between the loss rate and the capacity of scheduling. It can
easily choose the right sensor in the network which will greatly improve the quality of service. 7.3. The Methods of Analysis. The previous method of finite automata has discussed the regular expression matching system security in WSN, and the evaluation of the performance is ignored to research. The matching method in some extent can maintain the precision and accuracy in some systems; it can be used in a specific environment; the performance of the evaluation in the wireless sensor network (WSN) that we had researched is in the universal environment; it is necessary to consider the problem of the restrictions, such as the capacity of the buffer, the length of the queue in the processing time, the performance of the calculation that needs enough buffer for the task processing, and the work conditions. In our research, the approach which took the matching method and the evaluating performance together is a new topic. The method ensures maintaining the system security, reducing the loss rate of the communication task, and improving the accuracy of the schedule. The universal approach can be used
8
The Scientific World Journal
in lots of environments; in the wireless sensor network, the approach has a good, excellent performance. [7]
8. Conclusions This paper presented a regular expression matching approach for the wireless sensor network security systems, which is proposed to take the advantage of sensor nodes collaboratively, which divides the matching into matching preprocessing phase, validation phase, and performance evaluation phase. This method is based on queuing model to evaluate the performance of scheduling for the wireless sensor network. The experimental results show that our approach can speed up the efficiency of regular expression by at least 71% for the regular expression set by Snort and L7-Filter systems. And the queue model helps to obtain the communication tasks probability distribution and the relation between the task’s processing capability and the task’s response time, sensor throughput, and so forth. The future work will focus on the following two aspects: the work will also extend the proposed approach and explore its feasibility for other network areas and continue to improve the queuing model to make it closer to the real wireless sensor which will raise the accuracy of the model.
[8] [9]
[10] [11]
[12]
[13]
[14]
Conflict of Interests The authors declare that there is no conflict of interests regarding the publication of this paper.
[15]
Acknowledgments This research is supported by the National Natural Science Funds of China (no. 61472100 and no. 61402078) and the Fundamental Research Funds for the Central Universities (no. DUT14QY32 and no. DUT14RC(3)090).
[16]
[17]
References [1] R. Matam and S. Tripathy, “Provably secure routing protocol for wireless mesh networks,” International Journal of Network Security, vol. 16, no. 3, pp. 182–192, 2014.
[18]
[2] H. Deng, W. Li, and D. P. Agrawal, “Routing security in wireless ad hoc networks,” IEEE Communications Magazine, vol. 40, no. 10, pp. 70–75, 2002. [3] L. Eschenauer and V. D. Gligor, “A key-management scheme for distributed sensor networks,” in Proceedings of the 9th ACM Conference on Computer and Communications Security, pp. 41– 47, Dalian, China, November 2002. [4] Y.-C. Hu, D. B. Johnson, and A. Perrig, “SEAD: secure efficient distance vector routing for mobile wireless ad hoc networks,” Ad Hoc Networks, vol. 1, no. 1, pp. 175–192, 2003. [5] S. S. Ahmeda, “ID-based and threshold security scheme for ad hoc network,” in Proceedings of the IEEE 3rd International Conference on Communication Software and Networks (ICCSN ’11), pp. 16–21, Xi’an, China, May 2011. [6] M. Roesch and Stanford Telecommunications, “Snort: lightweight intrusion detection for networks,” in Proceedings of
[19]
[20]
[21] [22]
the 13th USENIX Conference on System Administration (LISA ’99), vol. 99, pp. 229–238, 1999. A. Prathapani, L. Santhanam, and D. P. Agrawal, “Detection of blackhole attack in a wireless mesh network using intelligent honeypot agents,” Journal of Supercomputing, vol. 64, no. 3, pp. 777–804, 2011. J. Levandoski, E. Sommer, M. Strait et al., “Application layer packet classifier for linux,” 2008. X. Li, M. Chen, and W. Liu, “Application of STBC—encoded cooperative transmissions in wireless sensor networks,” IEEE Signal Processing Letters, vol. 12, no. 2, pp. 134–137, 2005. K. Kim, “(N,n)-preemptive priority queues,” Performance Evaluation, vol. 68, no. 7, pp. 575–585, 2011. J. Wang, Y. Yanshuo, and K. Zhou, “A regular expression matching approach to distributed wireless network security system,” International Journal of Network Security, vol. 16, no. 5, pp. 382–388, 2014. W. Jie, K. Zhou, K. Cui et al., “Evaluation of the task communication performance in wireless sensor networks: a queue theory approach,” in Green Computing and Communications, IEEE and Internet of Things, IEEE International Conference on and IEEE Cyber, Physical and Social Computing, pp. 939–944, IEEE, 2013. J. P. A. X. Liu and E. Torng, “Bypassing space explosion in regular expression matching for networkintrusion detection and prevention systems,” 2012. S. Kumar, S. Dharmapurikar, F. Yu, P. Crowley, and J. Turner, “Algorithms to accelerate multipleregular expressions matching for deep packet inspection,” ACM SIGCOMM Computer Communication Review, vol. 36, no. 4, pp. 339–350, 2006. T. Liu, Y. Sun, A. X. Liu, L. Guo, and B. Fang, “A preltering approach to regular expression matching for network security systems,” in Applied Cryptography and Network Security, pp. 363–380, Springer, Berlin, Germany, 2012. M. Becchi and P. Crowley, “Efficient regular expression evaluation: Theory to practice,” in Proceeding of the 4th ACM/IEEE Symposium on Architectures for Networking and Communications Systems (ANCS '08), pp. 50–59, New York, NY, USA, November 2008. S. Kumar, J. Turner, and J. Williams, “Advanced algorithms for fast and scalable deep packet inspection,” in Proceedings of the 2nd ACM/IEEE Symposium on Architectures for Networking and Communications Systems (ANCS ’06), pp. 81–92, ACM, New York, NY, USA, December 2006. B. C. Brodle, R. K. Cytron, and D. E. Taylor, “A scalable architecture for high-throughput regular-expression pattern matching,” in Proceedings of the 33rd International Symposium on Computer Architecture (ISCA '06), pp. 191–202, Boston, Mass, USA, June 2006. A. Mitra, W. Najjar, and L. Bhuyan, “Compiling PCRE to FPGA for accelerating SNORT IDS,” in Proceedings of the 3rd ACM/IEEE Symposium on Architectures for Networking and Communications Systems (ANCS ’07), pp. 127–135, ACM, New York, NY, USA, December 2007. R. Sidhu and V. K. Prasanna, “Fast regular expression matching using fpgas,” in Proceedings of the 9th Annual IEEE Symposium on Field-Programmable Custom Computing Machines (FCCM ’01), pp. 227–238, IEEE, 2001. L. Chuan-Lai, The Queuing Theory, Beijing University of Posts and Telecommunications Press, Beijing, China, 2000. S. S. Mishra and D. K. Yadav, “Cost and profit analysis of Markovian queuing system with two priority classes: a computational
The Scientific World Journal approach,” International Journal of Applied Mathematics and Computer Sciences, vol. 5, no. 3, pp. 150–156, 2009. [23] V. Srinivas, S. S. Rao, and B. K. Kale, “Estimation of measures in M/M/1 queue,” Communications in Statistics—Theory and Methods, vol. 40, no. 18, pp. 3327–3336, 2011. [24] W. F. Nasrallah, “How pre-emptive priority affects completion rate in an M/M/1 queue with Poisson reneging,” European Journal of Operational Research, vol. 193, no. 1, pp. 317–320, 2009. [25] A. Al Hanbali and O. Boxma, “Busy period analysis of the state dependent 𝑀/𝑀/1/𝐾 queue,” Operations Research Letters, vol. 38, no. 1, pp. 1–6, 2010.
9