Compurers & Geosciences Vol. 21, No. 8, pp. 993-999, 1995 Copyright Q 1995 Elsevier Science Ltd Printed in Great Britain. All rights reserved 0098-3004(95)ooo36-4 0098-3004195 $9.50 + 0.00
Pergamon
BASIS FOR RESISTIVITY
A FLEXIBLE LOW-COST AUTOMATED DATA ACQUISITION AND ANALYSIS SYSTEM MAX A. MEJU and M. MONTAGUE
Environmental
and Industrial Geophysics Research Group, Department University of Leicester, Leicester LEl 7RH, U.K. (r-mail:
[email protected]) (Received
14 Ju1.v 1994; revised I December
of Geology,
1994)
Abstract-An efficient and versatile automatic resistivity data acquisition and analysis (ARDAA) system has been developed for use with any 4-electrode output resistivity meter. The acquisition hardware comprises a low-cost Digital Switching Unit (DSU) or an “electronic switch box” which can be interfaced to a portable field microcomputer and a resistivity meter for automatic ground resistivity measurements. Data analysis can be effected in real-time using a simple effective direct inversion scheme that converts
each apparent resistivity-electrode spacing data pair into a corresponding effective resistivitydepth information at a rate that is faster than that of acquisition leading to unhindered productivity. The DSU is software programmable thus allowing for easy reconfiguration for the electrode array-type deemed appropriate for a given field survey or for extension to other geophysical techniques where automatic multiple switching is required. Detailed discussions of the system design, practical considerations, timeand cost-savings, and an adaption to the ABEM SAS300 terrameter are provided. A practical evaluation of the infield data-analysis scheme is given and suggestions are offered for extending the basic system for remote-site monitoring applications. K~v Words: Resistivity
surveying,
Automatic
data acquisition,
Real-time
data
analysis.
model SAS300C or an upgraded SAS300B terrameter) and the resulting digital field system typically is more expensive than the traditional systems. Interestingly, a considerable number of the ABEM SAS300 (or similar) terrameters are serviceable but their users may not avail themselves easily of the latest automatic data collection technology. Moreover, many of the popular manually operated multicore cable and switch units used with such terrameters (e.g. the BGS-2.56 system (Barker, 198 1)) also are serviceable. It would be desirable to this group of users to have a low-cost adaptation of the automatic data acquisition technology on their simple but effective resistivity meters and multicore cables. Infield data analysis is desirable in any investigation because it enables the success of each sounding to be assessed on the spot (Meju,1994). There are several resistivity modeling schemes available for quantitative data interpretation (e.g. Inman, 1975; Basokur, 1990; Meju, 1992; Barker, 1992; Biwen and Barker, 1994) but these cannot be used in real-time. A novel scheme-akin to the popular Bostick (1977) inversion in magnetotellurics-that transforms each apparent resistivity datum to an effective resistivity at an effective exploration depth (Meju, 1995) is our preferred tool for real-time data analysis because it enables the data to be processed at a faster rate than
INTRODUCTION
The dc resistivity methods of geophysical exploration are popular in environmental, engineering, and hydrogeological investigations because the field instrumentation require relatively small capital outlay, minimum labor costs (in terms of size of the field crew), and the fact that the data are related to variations in fluid content (and chemical composition and temperature) in the subsurface. In surveys involv-
ing the traditional techniques and instrumentation, about three operators may be needed, one to read the instrument and record the data, and two to move the electrodes. The development of multicore cable systems (e.g. Barker, 1981) has led to a reduction in the number of operators required in the field. In recent times, however, automatic electrode switching systems have been developed for efficient data acquisition requiring only one or two operators (e.g. Griffiths, Turnbull, and Olayinka, 1990; Olayinka and Barker, 1990) and sophisticated commercial systems incorporating such developments are available now (e.g. the ABEM Multimac, the OYO McOHM II (Goebuchi, Shima, and Hara, 1988), and the CAMPUS Geopulse system). However, such innovations are system-specific (e.g. to use the ABEM Multimac electrode switch system would require an ABEM 993
994
M. A. Meju and M.
Electrode Array
Multicore Cables
Terrameter
Laptop Computer Serial/Parallel
Figure
1. Simple illustration
of automated
data-acquisition
that of acquisition leading to unhindered productivity. The underlying philosophy in this appreach is simple: having ensured that the goals of exploration have been met in the field through simple effective real-time data imaging, the user then may apply any favored or more rigorous modeling programs to the data on return to the base camp or laboratory. We have developed a simple, flexible automated resistivity data acquisition and analysis (ARDAA) system that can be adapted to any resistivity terrameter with four-electrode output and controlled by a simple low-cost field portable IBM-compatible microcomputer. The ARDAA system (schematized in Fig. 1) was designed for use primarily with existing simple multicore cables and can be run in a semiautomatic mode or as a fully automatic system. It also can be used with a modern (light, easy to repair) cable system with connected electrode switches and decoders (i.e. the user will require an additional lowcost investment in a simple electrode switching system). The advantages inherent in this design are obvious. For the more traditional user who has invested in a multicore cable, the ARDAA system effectively replaces the manually operated switch-box used for selecting electrode positions with an “electronic switch-box” and with additional data logging and infield processing facilities. This takes away some degree of manual labor required in the use of conventional multicore cables and results in considerable savings in acquisition time. For maximum flexibility, the digital switch unit uses data tables which can be modified to suit different electrode configurations. A simple adaptation to an ABEM SAS300 terrameter is
system set-up
in Offset Wenner
array.
discussed and an evaluation of the adopted infield imaging program is provided. DATA ACQUISITION
SYSTEM
System design considerations
In designing the data collection system, the following practical considerations were borne in mind. (1) The system must be flexible enough to be adapted to any four-electrode output resistivity system where the automation of electrode switching would be beneficial. (2) Because a variety of experimental geometries is used in routine surveys, it is important that all usual electrode configurations are catered for in the design. (3) The system should allow for interfacing into any standard low-cost IBM-compatible field portable computer. (4) The system must allow for the use of existing multicore cables or the newer generation of cables and should operate in semiautomatic or automatic modes, under software control, as deemed appropriate by the user. In its simplest form the system is semiautomatic which allows users of multicore cable units (Barker, 1981) that presently employ manual switching of electrodes to benefit from the data automation process. The electrodes are selected automatically and the computer signals audibly whenever the resistivity meter requires reading. The system control data are held in the form of tables and can be modified to suit different arrays and hence the stipulated survey re-
Resistivity data acquisition and analysis LAYER 1
I
LAYER 2
current & potentialCOIIIKC~~OIIS i
To electrodes
995 Transition
Transition
DATA
!
1
i T I
Cl, c2 & Pl, F2
QFl
I
Valid
1
STROBE Figure 4. Timing diagram showing valid data synchronization by use of strobe signal.
0 RELAY SWITCHING
Valid x T = 50 ps
RELAY SWITCHING
binary address to enable one of several output locations. The memory is in the form of Set-Reset latches. As each output on a demultiplexer only can be enabled singularly, a memory is required in order to build up a pattern of energized relays. Each layer has a bank of relays switched using demultiplexer logic. Miniature relays provide the most effective way of making controlled low resistance connections. A
bus Figure
2. Schematic
showing layered switching unit.
structure
of digital
quirements. For full automation it is necessary the computer also records and processes the data. Note that the system is designed to handle input/output via a computer printer port such the connection is simple (see Fig. 1).
that field data that
Hardware developments Digital Switch Unit. The operational details of the Digital Switch Unit (or DSU for simplicity) will be described here. This is the novel unit that controls and will automate fully electrode selection. The DSU is constructed using two circuit “layers” (herein termed Layer 1 and Layer 2). Layer 1 determines if an electrode is to be used for measuring potential or for providing current. Layer 2 sets the electrode positions. Each layer is divided into four operational sections (demultiplexing, memory, relay switching and display) as illustrated in Figure 2. The demultiplexers utilize the computer’s 8-bit data as a form of Cl Pl
c2 P2
/
Output a set-up value from the data table to the D.S.U. /
Enable the terrameter
c Call a delay to allow the terrameter to perform its measurement
I?
PI c2
Figure 3. Connection network between banks of relays for Layers 1 and 2. Connections required for first spread of Wenner array are shown in this example.
Figure 5. Flowchart of DSU-controlled DAA system.
operations in AR-
996
M. A. Meju and M. Montague _---_--__-----___------
I
TERRAMETER
Set
Out Logic I on the output triggers the terrameter measure cycle.
Reset
a strobe to be utilized are commercially available. This signal is provided from the parallel port of any computer. The relationship between valid data and the strobe signal is shown in Figure 4. Only on strobe assertion are data accepted into the demultiplexer and decoded. The time interval Tl ensures that the logic levels have settled.
S-R latch
(ABEM code no. 1285) I
I I
0 Start
----------------------_ov
Figure 6. Schematic
showing simple connection DSU and ABEM terrameter.
between
I
/
pattern of energized relays produces the desired connections that go to make up a particular electrode array as shown in Figure 3. The display is in the form of a L.E.D. bargraph. This allows visual monitoring of the DSU output and hence the electrode connections. As illustrated in Figure 2, each layer virtually is identical, and their combination increases the overall control capability. During operation, power consumption is minimized by the use of Complementary Metal Oxide Semiconductor (CMOS) components. Interfacing to a computer. Synchronization of the DSU operation with the address data presented by the computer port is critical as an undesirable transitional stage operates where bits change logic state between each valid input address. Demultiplexers which allow a synchronizing timing signal known as
To
DIGITAL
74HC245
SWITCH~I
BUS TRANSCEIVER Y
electrodes
/
/
Input resistivity meter settings /
Select electrode configuration t Enable
terrameter
Test electrodes
Scan electrodes
SP compensate observation error
/
Control +5v
74HC245 BUS TRANSCEIVER X
TERRAMETER SAS 300
-Control -0v
PARALLEL TO SERIAL CONVERTER
CONTROL COMPUTER
c3 End
Figure 7. Block diagram of fully automated system showing DSU with associated bus transceivers and port connections to Terrameter and controlling computer.
Figure 8. Flowchart summarizing operational features of ARDAA system.
Resistivity
data
acquisition
and analysis
possible system.
L&SW control program. The DSU control program for semiautomation incorporates the following features:
These steps are summarized flowchart in Figure 5. Adaptation
to the ABEM
in
SAS300
the
form
of
a
Terrameter
On Layer 2, a relay is especially set aside for triggering the Terrameter. This is connected in parallel across the measure switch of the SAS300 as an extremely simple modification (Fig. 6). When a measurement is required, the relay is energized shorting out the measure switch. For full automation the binary-coded decimal from the Terrameter display unit is read directly by the computer and decoded using software. Note that interface cards are available commercially to take the parallel data and directly place it on the data bus on a computer. However, a simpler and more robust form employs a parallel to serial converter. Data then can be read via the serial printer port. A block diagram illustrating the fully automated system is given in Figure 7. Figure 8 summarizes the operational features of the Terrameter-based system which incorporates the DSU. Note that the Terrameter compensates for SP effects as in conventional systems; however, it is I-D
models
to obtain
SP measurements
DATA ANALYSIS
(1) operator
input of the required array type and cycle time (2) the setting up of Layers 1 and 2 (3) activation of the resistivity meter (4) a delay to allow the resistivity meter to undertake its measurement cycle, and (5) an audible signal control and further time delay to allow the operator to read the resistivity meter (semiautomation) or the computer to read and process the information (full automation).
997
for site
100
10’ ’ “““‘I
(Q-m) 102 103 ’ 1’1”11/ ’ ’ ““1
rJ + I+ ,i
+.A
_*_A-A-A
k
!qf , , , , 10-l
100
10’
Electrode Figure
spacing 9. Sample
102
103
(m) output
a
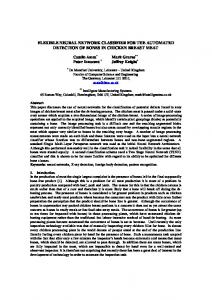
Infield data analysis. Infield data analysis is desirable as it allows on-the-spot determination of the optimum survey parameters and an assessment of the degree of success of the experiment (Meju, 1994). In all the available field systems with infield processing capability, data analysis usually is effected using iterative techniques (typically employing the leastsquares criterion) that require time-consuming numerical simulation of the responses of the physical system under consideration (the so-called forward model). Such rigorous interpretation processes can be effected only on cessation of data collection because the full-sounding curve is needed for meaningful subsurface characterization and thus are not ideal tools for real-time data analysis. We prefer an analysis procedure that can be used at any stage of the data acquisition to assess rapidly the data quality, the target resistivity and the depth of investigation. Such a tool will facilitate easy comparisons of field techniques and instrumentation and hence the determination of the methods with the optimum potential at any given survey location (Meju, 1994, 1995). Approximate direct resistiuity-depth tran!jormation. The apparent resistivity measurements typically reflect the variations in fluid content of the subsurface materials and Meju (1994) developed a novel scheme for transforming surface resistance measurements to resistivity-depth information and showed that the results satisfactorily explain the field data. The interpretational accuracy of the scheme also was demonstrated by comparison with borehole data (Meju, 1994) and serves to validate the method. A sample application of the system at a landfill site using the Offset Wenner electrode array is shown in
1O_,lO-’ I ’ “““‘I
. . . . . ..
such
CONSIDERATIONS
Resistivity
._-A-.-.-
from
from in-built
infield data analysis
software.
M. A. Meju and M. Montague
998
Figure 9 for illustration. Operationally, each of the apparent resistivity data shown on the left-hand plot is transformed directly to an effective resistivity at a particular depth of imaging (the full results displayed in the field are shown by crosses on the right-hand panel). To gauge the accuracy dimensions of these transformations, the theoretical responses of a coarsely discretized model corresponding to the transformed data (both shown on the right-hand panel of Fig. 9) are superimposed on the actual field recordings on the left-hand panel of this figure. Notice that the computed responses of the interpretive model satisfactorily explain the field data. DISCUSSION
The main benefits to be derived from automating previously manually operated multicore cable units include the reduction in labor costs (or crew size) and the reduction in errors resulting from incorrect input selection. The timing gains in acquisition using the ARDAA system also is remarkable. In one simple comparative offset-Wenner sounding using the BGS256 multicore cable (Barker, 1981) and the ABEM SAS300 Terrameter, all the electrodes were emplaced first and then connected as in the traditional survey set-up. Resistance measurements were made manually, semiautomatically and automatically. In semiautomatic mode the system is programmed to allow 8 set delay after the audible signal for the operator to read the data. For 45 measurements in the OffsetWenner technique this amounts to about 360 seconds in which the system is essentially idle in this mode of operation, Thus, the manual switch operation and data recordings took 24 min and 50 set whilst the semiautomatic operation took 21 min and 55 set (i.e. a 10% reduction in recording time). In the automatic mode, a time saving of about 43% was obtained (because the 8 set delay per measurement was not necessary and the time required to process the field data is insignificant). There are many areas of geophysical data acquisition where multiple switching is currently applied. For example, induced polarization (IP) measurements are made using the same electrode arrays and cables employed in dc resistivity profiling or depthsounding and only a minor modification to allow for connection to an IP instrumentation will be necessary to use the ARDAA system. In conventional near-surface electromagnetic surveying, only one sensor coil typically is deployed at a time. However, in shallowdepth investigations with stringent technical specifications, novel techniques involving multiple sensors can be deployed simultaneously and whence benefit from full automation of the form described here. Another interesting area of environmental application of such a system is in remote-site monitoring investigations. For instance+ time variations of the physico-chemical conditions in the subsurface (e.g. contaminant transport in landfill sites or seepage
across dam sites) may be monitored using periodic information from a distribution of electrodes across the prospective site. A geophysical tool in dam site investigation for leakages is the self potential (SP) method. It is interesting to note the SP measurements also could be made using a dc terrameter and the ARDAA system. The main motivation for building the ARDAA system was to provide a low-cost system that will enhance the productivity and usefulness of our old resistivity meter and multicore cables. To a large extent we realized all our goals. The hardware development cost was under $500 (in fact, the actual pure hardware cost was E164.92U.K.) but it required about three months of hardware design time (mostly for printing circuit boards using the BBC Micronova package) and a further one month for testing and other developments.
CONCLUSION
We have developed successfully and adapted a low-cost (under $500) digital automation technology to an old serviceable dc resistivity meter and using an existing multicore cable. The resulting data acquisition and analysis system can be used with any four-electrode output resistivity meter. The simple infield data analysis adopted in the system does not hinder productivity as the recordings can be analyzed at a faster rate than that of acquisition. The analysis scheme also produces results that satisfactorily explain the field data. A similar system can be adapted to other geophysical field instrumentation requiring multiple switching. Acknowledgments-The main hardware developments were undertaken by one of us (Montague) as part of an honours degree requirement in Leicester University. The authors are grateful to Andy Parker for assistance in drafting some of the figures.
REFERENCES
Barker, R. D., 1981, The offset system of electrical resistivity sounding and its use with a multi-core cable: Geophysical Prospecting, v. 29, no. I, p. 128-143. Barker, R., i992, A simple algoriihm for electrical imaging of the subsurface: First Break. v. 10. no. 2. D. 53-62. Basokur, A. T., 1990, Microcompute; progiam for the direct interpretation of resistivity sounding data: Computers & Geosciences, v. 16, no. 4, p. 587-601. Biwen, X., and Barker, R. D., 1994, Filter coefficients for offset Wenner and Wenner resistivity sounding interpretation: Computers & Geosciences, v. 20, no. 5, p. 671-680. Bostick, F. X., 1977, A simple almost exact method of MT analysis. Workshop on electrical methods in geothermal explbration: Snowbird, Utah, 1976 (abstrac6. Griffiths. D. H.. Turnbull. J.. and Olavinka. A. I.. 1990. Two:dimensibnal resist&i mapping with a computer: controlled array: First Break, v. 8, no. 4, p. 121-129. Geobuchi, T., Sima H., and Hara, T., 1988, A new resistivity meter, featuring fully automatic measurement and a
Resistivity
data
acquisition
built in analysis program: Proc. of ASEG/SEG Conference, Adelaide, 1988, Exploration Geophysics, v. 19, no. 5, p. 276-280 Inman, J. R., 1975, Resistivity inversion with ridge regression. Geophysics, v. 40, no. 5, p. 798-817. Meju, M. A., 1994, Assessing the role of infield resistivity image processing in shallow subsurface investigations: Proc Symposium on Application of Geophysics to Engineering and Environmental Problems (SAGEEP) (Boston, Massachusetts), v. I, p. 19-40.
and analysis
999
Meju, M. A., 1995, Simple effective resistivitydepth transformations for infield or real-time data processing. Computers & Geosciences, v. 21, no. 8, p. 983. Meju, M. A., 1992, An effective ridge regression procedure for resistivity data inversion: Computers & Geosciences, v. 18, no. Z/3, p. 999118. Olayinka, A. I., and Barker, R. D., 1990, Borehole siting in crystalline basement areas of Nigeria with a microprocessor controlled resistivity traversing system: Ground Water, v. 28, no. 2, p. 1788183.