Bayesian Based Location Estimation System Using Wireless LAN Seigo ITO Graduate School of Information Science Nagoya University, JAPAN
[email protected] Abstract Over the last few years, wireless LAN and locationbased service has been a hot subject of controversy. In this paper, we propose a Bayesian-based location estimation system and a location-based application using existing wireless access points at a college campus. Our system uses signal strength of access points and a Bayesian inference to estimate a user’s location. Using this pre-observation model-based system and considering signal strength direction, a user can construct a location estimation system easily and obtain good location estimation accuracy. Furthermore, our system allows users to know his/her location whenever they want without beacons searched by a system administrator or an unknown person. We implemented the system and exemplified its effectiveness with experiments at our campus. Using this system, we also propose a locationbased presence service system. By using this presence system, one can get the location of friends automatically.
1. Introduction Many places have enabled a use of wireless LAN in recent years. Not only universities, companies and homes but stations, airports, amusement facilities, and shopping molls have set up wireless LANs. In addition to these, cell phones with IEEE802.11b have been announced [1] in the press. Therefore it seems we can expect wireless LAN to be available anytime anywhere in the future. In addition, location-based services have been studied by many research groups. Under the circumstances, we have been examining and implementing location estimation systems and location-based services using wireless LAN. Many location estimation systems using wireless LAN have already been proposed[2][3][4][5], but some of these systems have important problems; for one thing, they do not consider location privacy issues adequately, and what is more, some systems need single purpose hardware. In this paper, we propose a Bayesian-based location estimation system and an application using existing wireless access points and a laptop PC with a wireless LAN adapter. Our approach employs a preobservation data of access point’s radio signal strength. The user terminal estimates the location using pre-
Nobuo KAWAGUCHI Information Technology Center Nagoya University, JAPAN
[email protected] observation signal strength data and the signal strength data of access points that the user can observe at that moment. We implemented this location estimation system and conducted evaluation experiments in the Integrated Building at Nagoya University. From the results of experiment, we confirmed the effectiveness of our method.
2. Related Work In this chapter, we describe related work in the area of existing location estimation systems.
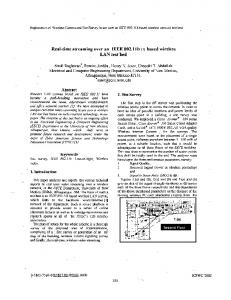
2.1. Various Types of Location Estimation A large number of studies have been conducted on location estimation systems. Major outdoor location estimation systems can be classified into the following three categories: Systems using GPS (Global Positioning System) [6], PDC (Personal Digital Cellular)[7] and PHS (Personal Handyphone System)[8]. They provide widearea services. However, it is difficult to use them indoors because GPS doesn’t receive satellite signals near buildings, furthermore, PDC and PHS systems do not have good accuracy for location estimation. Major location estimation systems for indoor use can be classified into the following three categories: Systems using ultrasound [9], RFID (Radio Frequency Identification) [10], and wireless LAN (section 2.2). Many systems require single-purpose hardware, and lowcost and easy-setup systems are scarce. Figure 1 shows a classification table of location estimation systems from the perspective that communication area and location estimation accuracy. Communication area
Outdoor PDC
1000m
GPS
100m PHS
Wireless LAN 10m Active RFIDTag
1m
Ultra sound Passive RFIDTag
1m
Indoor 10m
100m
Location estimation accuracy
Figure 1. Several location estimation systems
3. Location Estimation System Issues There are two major issues associated with location estimation systems. - Privacy Issues Many location estimation systems do not consider about user’s location privacy issues (Geo-Privacy) [15]. Instead, users are forced to trust system administrators or unknown person operating their location estimation system. In contrast to outdoor location estimation like GPS, PDC and PHS, indoor location system’s accuracy is capable of extraordinary precision. It is not uncomfortable feeling for a user to have his or her
Case of Direction 0
Case of Direction 180
0.25
0.25
0.2
Probability of SNR
Location estimation systems using Wireless Ethernet can be classified into the following three categories. - Cell-ID System This is a location estimation system using access-point communication areas (called Cells). This system considers an access point at which terminal connects as a user’s location. It is easy to establish this system. The terminal can estimate its location with only the access point’s MAC address and location data. However this system has a location estimation accuracy issue. - TDOA (Time Difference of Arrival) System This system is implemented on Air Location [11]. To begin with, multiple access points receive echoes, which the terminal transmits. Each access point then calculates the received timing error and clock error. Finally, the system estimates the terminal’s location. This system needs single-purpose access point for their system. - Received Signal Strength System This location estimation system depends on received signal strength. It can be further classified into more groups depending on by how to use signal strength. The RADAR [12] system observes signal strength at access points and estimates terminal location to determine radio wave distance characteristics. The WiPS [13] system assumes that all devices with wireless adapters (include access point, terminal, etc) equal, and estimates terminal locations to determine radio wave distance characteristics. Since the above systems estimate location using radio wave distance characteristics, they face multi path problems caused by interference, reflection and other unpredictable interruptions. The Ekahau [14] and the PlaceLab [4] systems estimate location by measuring signal strength preliminarily. In Ekahau, the system saves these data to a location estimation server, which then estimates a location when user makes a request. Our approach belongs to the class of received signal strength system.
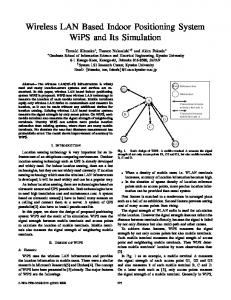
location known by the administrator or an unknown person. - Ease of Setup When someone establishes a new location estimation system, a purchase and an installation of new hardware just only for the location estimation are hurdles for easy setup. Additionally, location estimation systems using received signal strength as described below. - Variation of Signal Strength It is difficult to predict signal strength of an access point, because signal strength propagation varies with interference, reflection, and other unpredictable interruptions. Additionally, signal strength varies with the positional relationship between a user’s terminal and an access point. For example, Figure 2 indicates differences in the SNR (signal noise ratio) taken at the same position but facing opposite directions. If the direction is different, signal strength distributions vary as in Figure 2. Therefore, when the system estimates location, it must consider the direction of signal strength observation.
Probability of SNR
2.2. Location Estimation Using Wireless LAN
0.15
0.1
0.05
0.2
0.15
0.1
0.05
0 40
45
50
55
SNR (Signal Noise Raito)
60
(db)
0 40
42
44
46
48
50
52
54
56
SNR (Signal Noise Raito)
58
(db)
60
Figure 2. SNR distribution of different directions in the same location
- Multipath Problem Received signal strength systems using radio wave have multipath issue caused by interference, reflection and other unexpected interruption. In particular, these issues are very difficult under indoor environments. - How to Accumulate a Signal Strength Database How to accumulate a signal strength database is major issue in received signal strength systems that use preobservation signal strength. Since pre-observation signal strength data are a must in pre-observation systems, it is important to know how to accumulate a signal strength database effectively.
4. Location Estimation Methodology 4.1. Outline of the System We considered the issues presented in chapter3, and as a result our system includes the features listed below. - Client-Based Location Estimation
In our system, the estimation software calculates user location with only a user’s terminal, thus a user’s location doesn’t detected by system administrators nor unknown persons. - Using Existing Wireless Access Points Our system uses existing wireless access points, terminals with wireless LAN adapters, and our system software. Therefore, new administrators do not need any particular hardware for location estimation. In addition, the administrator can construct new location estimation systems easily. - Request of Signal Strength Distribution and Measurement of Multi Azimuth As Figure 2 indicates, signal strength can vary greatly at the same location and direction. Thus, we deal with location estimation requests not signal strengths at one point but signal strengths distribution for a given length of time. For differences in signal strength due to direction, we observe multi-direction in signal strength distribution and save the signal strength database with information on direction. - Pre-Observation Based Location Estimation The multipath problem is a very difficult one to solve. To avoid the problem, our system does not predict multipaths but conducts pre-observation include interference, reflection, and multipaths adequately. The system uses pre-observation and Bayesian inference to estimate terminal locations. - Signal Strength Database Construction Using User Collaboration and Dynamic Wireless Surveying There are two methods of constructing signal strength databases efficiently and widely. The first is co-acting database construction through collaboration among users. For example, students remain in the same state in a class (students attend a class facing to ward the platform). At this time, students run signal strength survey software and use their observations as preobservations of its state. The second is dynamic database construction by a moving wireless survey. A mobile object such as a car or a bicycle with the software to survey the wireless access point’s signal strength runs by a survey point. However, there are some problems with the moving survey. It is necessary to know the location where the signal strength observation is conducted. In an outdoor environment, a GPS system can map coordinates but this is impossible in an indoor environment. For this reason, we use a converted Segway with a function for relative moving distance measurement. Figure 3 shows the segway, which can conduct moving wireless surveys both indoors and outdoors.
Head-mount Display
Control Laptop
GPS
Directive Antenna
Figure 3. The segway can conduct moving wireless surveys both indoors and outdoors.
4.2. Location Estimation Algorithm Our location estimation algorithm consists of two steps. - Survey Step A user terminal with a wireless LAN adapter makes an observation about each AP’s signal strength. The observed signal strength data are registered in the database. - Estimation Step In a certain state, a user terminal that wants to know its location makes an observation for a given length of time. The terminal estimates its location using the signal strength distribution observed in the Survey step and the Estimation step. For location estimation in daily use, a user does not conduct the Survey step. Instead, the user downloads a signal strength data in the Survey step preliminarily and conducts only the Estimation step. 4.2.1. Survey Step. In the Survey step, a terminal conducts pre-observation of the signal strength at each state, and pre-observation data is registered in the database as a pre-observation model. The set S is defined by the set of state where users can observe the signal strength of access point.
Each state in (4.1) consists of three elements. is the direction and x, y are the coordinates of the terminal (k is the number of states) In a certain state sk, a terminal observes the signal strength of each access point. Each observation o (n consists of a MAC address and a value of SNR is the number of access points).
From expression (4.3), we can calculate probability distribution where a user can observe SNR in from the MAC address and probability distribution frequency of the MAC address . We also define the
probability distribution a user can obtain an observation o in state sk.
conducted evaluation experiments in the large building at our campus.
5.1. Hardware From these definitions and Bayesian inference, we calculate the posterior probability distribution the user is in state sk when the user observes o.
P(sk) indicates the prior probability distribution when the user is in the state sk. In the Survey step, P(sk) is a uniform distribution, and P(o|sk) is calculated from definition (4.4). The posterior probability distribution is computed with (4.5), which we will use in the Estimation step. 4.2.2. Estimation Step. First, the terminal makes an observation for a given length of time at an unknown state s. This observation defines o2, and observations in the survey step defines o1 (o1 and o2 are independent). In expression (4.5), if the numerator can be found, the denominator can be obtained easily. Therefore, if we consider the denominator as constant,
Our experiments used the hardware listed below. (Used in Survey and Estimation step) - Laptop PC: Toshiba DynaBook SS3500 DS/EP/2 - Wireless LAN Card: PROXIM ORiNOCO 11a/b/g Combo Card Wireless access points already installed in the building of our campus. - Access Point : Colubris Networks CN-320
5.2. Overall View of Experimental Environment Figure 4 presents an overall view of the experimental environment. Star marks show the location and the MAC address of each access point. About two hundred wireless LAN access points were found in the building, and over three hundred access points were found across our campus. In this experiment, we only used the access points for publicly available and filtered the access points which are installed by the private laboratories. We defined the origin at the southeast end of the building and directions 0 to 360 clockwise. y
Since o1 and o2 are independent, we obtain the expression below.
Access Point Mac Address
0
Thus, the conditional probability P(sk|o1,o2) becomes the below expression.
90
270 180 hallway
63800
mm
Namely, the posterior probability calculated expression (4.5) in the Survey step becomes the prior probability in the Estimation step. The posterior probability in the Estimation step becomes the below expression.
0
97200
mm
x
Figure 4. Overall View of Experimental Environment
5.3. Experiment1: Lecture Room The posterior probability distribution calculated in (4.9) is the probability that the user is in a state sk when he or she obtains the observation o2.
5. Evaluation Experiments In accordance with the location estimation algorithm shown in chapter 4.2, we implemented our location estimation system with Java2 Platform Standard Edition 1.4.2. To exemplify the effectiveness of our system, we
First, we conducted evaluation experiments in Lecture Room 013 in the center of Figure 4. Figure 5 shows an enlarged view of Lecture Room 013. This room was divided into the platform side and the seat side. The seat side had nine columns with a total of 103 seats installed. The platforms side had no obstruction. There were only two wireless access points installed in Lecture Room 013 (star marks in Figure 5), but signal strengths of around 30 other access points installed in other lecture rooms and hallways could be detected. (Survey Step)
We conducted signal strength pre-observation at both the platform and the seat sides. On the seat side, we can regard the user as almost facing the platform side, that is, facing =270. We observed signal strengths for a minute facing =270 at all 103 seats. On the platform side, we made observations facing =0, 90, 180, 270 and moving in a 1,000mm grid interval. The total Mac address and SNR data were 209,267 data. (Estimation Step) We conducted the Estimation step on a different day to the Survey Step. The user sat down in a random seat on the seat side, placed a laptop PC on the desk, and observed signal strengths. We considered one request as a signal strength distribution that the user could observe for 30 seconds. The average number of data in Estimation step per request was 631. Hallway
Access Point
10800 mm 0 90
270
8940 mm
180
Lecture Room013
Outside 27000 1800
Hallway 5400
1800
Lecture Room 014
Survey Step Point Access Point
Lecture Room 015
Figure 6. Enlarged View of Hallway
6. Results 6.1. Experiment 1: Lecture Room Figure.7 shows the result of the experiment in Lecture Room 013. The figure shows the location estimation error from the correct location (x-axis) and the cumulative probability parentage of the number of total requests (yaxis). As the figure indicates, we obtained that error within 3.0 meters with a cumulative probability of 0.35. The cause of the erroneous result can be considered to be the following. The size of Lecture Room 013 was not large enough (10,000 mm*8,940 mm), and all desks and chairs included metal reinforcement. Thus Lecture Room 013 had difficult environmental conditions. 1
Cumulative Probability
0.8
Platform side
Seat Side
0.6
Figure 5. Enlarged View of Lecture Room013 0.4
5.4. Experiment2: Hallway 0.2
Second, we conducted evaluation experiments in the Hallway in the middle right of Figure 4. Figure 6 shows an enlarged view of the experimented Hallway. Since the hallway of the first floor does not have any wireless access points, the terminal observed signal from access points installed in lecture rooms and other hallways. (Survey Step) In the survey step, we gathered pre-observation signal strength data on a grid with 1800mm intervals in the direction =90 for one minute. Figure 6 shows the point at which we conducted pre-observation. The Mac address and SNR totaled 152266 data. (Estimation Step) We conducted the Estimation step on a different day to the Survey step day. Here, the user stood at a random point in Figure 6 and observed signal strengths for one minute. In this experiment, we considered one minute signal strength observations as one request.
0 0
2000
4000
6000
8000
10000
Error (mm)
Figure 7. Location Estimation Error and Cumulative Probability in Experiment 1
6.2. Experiment 2; Hallway Figure 8 shows the result of the experiment in the Hallway, with the location estimation error and the cumulative probability. As the figure indicates, we obtained that error within 2.0 meters with a cumulative probability of 0.53 and within 3.0 meters with a cumulative probability of 0.81. Estimation accuracy was better than in the experiment in Lecture Room 013, because the Hallway had better visibility and did not have many desks and chairs with steel reinforcing. Thus, the environmental conditions were better.
1
8. Conclusion
Cumulative Probability
0.8
0.6
0.4
0.2
0 0
2000
4000
6000
8000
10000
In this paper, we proposed the Bayesian-based location estimation system and the presence service application using wireless LAN. Our system can utilize existing wireless access points, therefore an administrator who wants to develop a location estimation system does not need to obtain extra and particular hardware. Additionally, our system handles Geo-Privacy issue because of client based location estimation. A lot of future works are remained, such as, user-based signal strength model construction, privacy oriented applicationprogram interface, and 3-dimensional location estimation.
Error (mm)
Figure 8. Location Estimation Error and Cumulative Probability Experiment 2
7. Application Using our system, a user with a wireless LAN adapter can know his or her location easily. In this research, we have implemented an application using the location estimation information. The application is a kind of a presence service like Instant Messengers. In our system, user’s location information is automatically shown with the presence of users. Many people in our laboratory manually turn their instant messenger’s name into names with their location, for example [user name @ their location]. This application changes the instant messenger’s name, [@location] in accordance with signal strengths users can observe at that moment. Figure 9 shows an instant messenger running on a ‘cogma’ (Cooperative Gadget for Mobile Application) [1]. Cogma Messenger can also communicate with MSN Messenger service. This software changes [@ their location] using the location information obtained from our location estimation method.
References [1] [2] [3]
[4] [5]
[6] [7] [8] [9]
[10] [11] [12] [13] Name changes with each user's present positions.
[14] [15] [16] [17]
Figure 9. Cogma Messenger
N900iL - http://www.nttdocomo.co.jp/english/ Active Campus - http://activecampus.ucsd.edu/ M. Ratto, R. B. Shapiro, T. M. Truong, and W. G. Griswold, “The ActiveClass Project: Experiments in Encouraging Classroom Participation”, Computer Support for Collaborative Learning 2003, Kluwer, pp. 477-486, June 2003. PlaceLab - http://www.placelab.org/ Bill Schilit, Anthony LaMarca, Gaetano Borriello, William Griswold, David McDonald, Edward Lazowska, Anand Balachandran, Jason Hong and Vaughn Iverson. “Challenge: Ubiquitous Location-Aware Computing and the Place Lab Initiative.” In Proc of The First ACM International Workshop on Wireless Mobile Applications and Services on WLAN (WMASH 2003), San Diego, CA. September 2003. Rashmi Bajaj, Samanth Lalinda Ranaweera, and Dhara P.Agrawal “GPS Location Tracking Technology, “IEEE Computer, Vol. 35, No. 4, PP.92-94, 2002. I-area http://www.nttdocomo.co.jp/english/p_s/i/iarea/ Imadoko http://www.nttdocomo.co.jp/english/p_s/service/ Andy Harter, Andy Hopper, Pete Steggles, Andy Ward and Paul Webster, “The anatomy of context-aware application” Proceedings of fifth annual ACM/IEEE international conference on Mobile computing and networking (MOBICOM’99), pp.59-68,1999. Wireless Technologies for Ubiquitous Services. NTT Review December 2003 Vol.1 No.94 Air Location (TM) http://www.hitachi.com/ Paramvir Bahl and Venkata N. Padmanabhan, RADAR: An In-Building RF-based User Location and Tracking System, IEEE Infocom 2000, pp.775-784, 2000. Teruaki Kitasuka, Tsuneo Nakanishi, and Akira Fukuda, "Wireless LAN based Indoor Positioning System WiPS and Its Simulation," 2003 IEEE Pacific Rim Conference on Communications, Computers and Signal Processing (PACRIM'03), pp. 272-275,2003. Ekahau – http://www.ekahau.com/ Geo Location & Privacy, http://ecotroph.net/blojsom/blog/geopriv/ Segway – http://segway.com/ Nobuo Kawaguchi, Cogma: A Middleware for Cooperative Smart Appliances for Ad hoc Environment, Proceedings of International Conference on Mobile Computing and Ubiquitous Networking (ICMU2004), pp.146-151,2004