CIRJE-F-712
Bayesian Estimation of Demand Functions under Block-Rate Pricing Koji Miyawaki National Institute for Environmental Studies Yasuhiro Omori University of Tokyo Akira Hibiki National Institute for Environmental Studies January 2010
CIRJE Discussion Papers can be downloaded without charge from: http://www.e.u-tokyo.ac.jp/cirje/research/03research02dp.html
Discussion Papers are a series of manuscripts in their draft form. circulation or distribution except as indicated by the author.
They are not intended for
For that reason Discussion Papers may
not be reproduced or distributed without the written consent of the author.
Bayesian Estimation of Demand Functions under Block-Rate Pricing Koji Miyawakia
Yasuhiro Omorib ∗
Akira Hibikic
January 29, 2010
a National Institute for Environmental Studies, Ibaraki 305-8506, Japan (
[email protected]). b Faculty of Economics, University of Tokyo, Tokyo 113-0033, Japan (
[email protected]). c National Institute for Environmental Studies, Ibaraki 305-8506, Japan (
[email protected]).
Abstract This article proposes a Bayesian estimation of demand functions under block-rate pricing by focusing on increasing block-rate pricing. This is the first study that explicitly considers the separability condition which has been ignored in previous literature. Under this pricing structure, the price changes when consumption exceeds a certain threshold and the consumer faces a utility maximization problem subject to a piecewise-linear budget constraint. Solving this maximization problem leads to a statistical model in which model parameters are strongly restricted by the separability condition. In this article, by taking a hierarchical Bayesian approach, we implement a Markov chain Monte Carlo simulation to properly estimate the demand function. We find, however, that the convergence of the distribution of simulated samples to the posterior distribution is slow, requiring an ∗ Corresponding
author: Tel:+81-3-5841-5516, E-mail:
[email protected]
1
additional scale transformation step for parameters to the Gibbs sampler. These proposed methods are then applied to estimate the Japanese residential water demand function. Key words: Discrete/continuous choice approach, Markov chain Monte Carlo method, Piecewise-linear budget constraint, Residential water demand, Separability condition. JEL classification: C11, C24, Q25.
1
Introduction
Block-rate pricing is a nonlinear pricing system often applied to public utilities, such as water. In contrast to other goods and services offered at a single price, consumers under block-rate pricing face several prices corresponding to the level of consumption. Income tax also has this pricing structure because the marginal tax rate changes according to total income. General microeconomic theory suggests that the most efficient allocation is achieved by setting a good’s unit price equal to its production cost per unit, which is called marginal cost pricing. However, in practice, several market issues exist that make marginal cost pricing inapplicable. In such cases, block-rate pricing is often employed by regulators. To derive the demand function under block-rate pricing, we adopt a discrete/continuous choice approach, which Burtless and Hausman (1978) first used to analyze taxation’s effect on the labor supply (see also Hanemann (1984); Hausman (1985); Moffitt (1986)). Model specifications of this kind are commonly used to evaluate tax policy or examine consumer behavior under block-rate pricing structures, such as labor supply (Burtless and Hausman, 1978), food stamp expenditure (Moffitt, 1989), car ownership and use (de Jong, 1990), electricity demand (Herriges and King, 1994; Reiss and White, 2005), and water demand (Hewitt and Hanemann, 1995; Olmstead, Hanemann, and Stavins, 2007). While this approach is based on the consumer’s maximization problem, a corresponding statistical model strongly restricts the model parameters. Furthermore, as Moffitt (1986) 2
pointed out, there is not only a computational burden but also the non-differentiability of the likelihood function. Thus, previous studies have exclusively estimated the demand function under two-block-rate pricing. The only exception seems to be Olmstead et al. (2007), who considered the multiple-block-rate pricing, where the number of blocks varies from two to four, using the maximum likelihood method. This method, however, ignored the so-called separability condition, which becomes important as the number of blocks increases. In Japan, consumers usually face more than two blocks (specifically, between five and eleven for water and between three and four for electricity), which requires the consideration of multiple-blockrate pricing. Therefore, this article takes a hierarchical Bayesian approach and implements a Markov chain Monte Carlo (MCMC) simulation to properly estimate the demand function; see Chib (2001) and Chib and Greenberg (1996) for the MCMC methodology and its use in econometrics, respectively. The present paper allows two practical attributes that previous studies excluded. First, we allow the number of blocks to be greater than two. Then, we use the discrete/continuous approach to derive the demand function as a multinomial generalization of the Type V Tobit model; see Chapter 10 of Amemiya (1985) for Tobit classifications and Chib (1992) for a pioneering study of the Bayesian approach in Tobit modeling. Second, we explicitly consider the separability condition, which guarantees that consumer preferences are divided into disjoint blocks. This condition has been ignored in previous studies yet plays a critical role, especially in multiple-block-rate pricing. We find, however, that the distribution of samples obtained from the Gibbs sampler converges very slowly to the posterior distribution. To improve sampling efficiency, we introduce an additional scale transformation step for parameters to the Gibbs sampler based on the generalized Gibbs step (GGS) developed by Liu and Sabatti (2000). The rest of this article is organized as follows. In Section 2, we describe the discrete/continuous choice approach and the demand function under block-rate pricing. Section 3 explains the sta3
tistical model, derives its likelihood function and joint posterior density function, and accounts for the separability condition. With this posterior density function, this section presents the MCMC algorithm and the corresponding generalized Gibbs step. Section 4 carries out a simulation study and reveals several properties of our algorithms. After data description, Section 5 applies our proposed method to estimate the residential water demand function in Japan using microdata, and the price and income elasticities are also estimated to investigate demand sensitivity in detail. Section 6 provides the conclusion for this article.
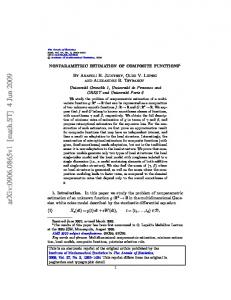
2 Demand Function First, we explain the model settings, following the discussion of Moffitt (1986). There are two types of goods; namely, a good under block-rate pricing and all other goods. Suppose that a consumer’s demand for a good, Y, is subject to K-block-rate pricing, and that its demand is strictly positive, Y > 0. Let Ya and I be the expenditure for non-Y goods and total income, respectively. The price system of Y is as follows. There are K prices, Pk (k = 1, . . . , K), related to K blocks. These prices are fixed and considered as given constants throughout this article. In practice, price often changes monotonically with Pk < Pk+1 or Pk > Pk+1 for k = 1, . . . , K − 1. This article focuses on the price system in which price increases monotonically. That is, Pk < Pk+1 (k = 1, . . . , K − 1), which is known as increasing block-rate pricing. Japanese residential water demand data in Section 5 offer an example of increasing block-rate pricing. Let Y¯ k denote the upper limit, or threshold, of the k-th block (k = 0, . . . , K), where Y¯ 0 ≡ 0 and Y¯ K ≡ ∞ for convenience. In addition to marginal prices and thresholds, there is a fixed cost, FC, that is independent of consumption, Y. At a practical level, this fixed cost represents a minimum access charge. The threshold values, Y¯ k , and a fixed cost, FC, are given fixed constants. Let U(Y, Ya ) be the well-defined utility function. Then, the consumer’s utility maximiza-
4
Ya
V
Y1
O
Y opt
Y2
Y
Figure 1: Utility maximization problem: three-block case.
tion problem is given by: V = max U(Y, Ya ) Y,Ya
subject to c(Y) + Ya ≤ I,
(1)
∑ ¯ ¯ ¯ ¯ where c(Y) = FC + Pk (Y − Y¯ k−1 ) + k−1 j=1 P j (Y j − Y j−1 ) if Yk−1 ≤ Y < Yk for k = 1, . . . , K. Figure 1 illustrates a budget constraint and indifference curve under three-block increasing block-rate pricing, where the second block is optimal with its optimal demand, Yopt , and level of indirect utility, V. The budget constraint of this form is a piecewise-linear budget constraint because it becomes linear given the choice of a block. Finally, the demand function is derived. Before its derivation, we must define K conditional utility maximization problems. For k = 1, . . . , K, the k-th conditional problem is given by:
max U(Y, Ya ) Y,Ya
subject to Pk Y + Ya ≤ Qk ,
where Qk = I − FC −
k−1 ∑ (P j − P j+1 )Y¯ j ,
(2)
j=1
and Qk is an augmented income (also referred to as virtual income). Under Problem (2), the consumer can maximize utility as if facing a single price, Pk , and virtual income, Qk . Let
5
conditional demand Yk be the solution to this conditional utility maximization problem, which results in the demand function under increasing block-rate pricing: ¯ ¯ Yk , if Yk−1 < Yk < Yk and k = 1, . . . , K, Y = Y¯ k , if Yk+1 ≤ Y¯ k ≤ Yk and k = 1, . . . , K − 1.
(3)
In studying the demand function under block-rate pricing, there are several functional forms, such as linear, quadratic, and log-linear functions, for the conditional demand, Yk , in Equation (3); the log-linear conditional demand model is one of the most popular models used in previous studies (Hewitt and Hanemann, 1995). Thus, this article focuses on the loglinear model for conditional demand, but our proposed estimation method would apply to other models in a similar manner. The log-linear model is given by ln Yk = β1 ln Pk + β2 ln Qk , where the parameters β1 and β2 represent the price and income elasticities conditional on block choice, respectively. For simplicity, let y, yk , y¯ k , pk , and qk denote the logarithm of demand (Y), k-th conditional demand (Yk ), k-th threshold (Y¯ k ), k-th marginal price (Pk ), and k-th virtual income (Qk ), respectively. Then, Equation (3) under the log-linear model can be written as follows: yk , if y¯ k−1 < yk < y¯ k and k = 1, . . . , K, y= y¯ k , if yk+1 ≤ y¯ k ≤ yk and k = 1, . . . , K − 1, yk = β1 pk + β2 qk ≡ x ′k β ,
(4)
(5)
where xk = (pk , qk )′ , β = (β1 , β2 )′ , y¯ 0 ≡ −∞, and y¯ K ≡ ∞.
6
3 Bayesian Analysis of Demand Functions under Block-Rate Pricing 3.1 Statistical Model From this section, we append the subscript i to the i-th consumer’s variables (i = 1, . . . , n) and the superscript ∗ to latent variables. For example, yi , y¯ ik , pik , qik , Ki are observed variables, whereas w∗i , s∗i are unobserved that will be explained in the following paragraph. We note that yik , the k-th log conditional demand, is unobserved, as it has no superscript ∗ to avoid tedious notation. Because we construct a statistical model that assumes different block-rate pricing for different observation, variables for block-rate pricing are also marked by the subscript i. Our statistical model, which is a multinomial extension of Moffitt (1986), is described as follows; see also Hewitt and Hanemann (1995). First, we introduce two unobserved random variables into the demand function of the i-th consumer, namely, heterogeneity, w∗i , and state variable, s∗i . Heterogeneity is a stochastic term that models consumer characteristics. The w∗i is assumed to follow the linear model: w∗i = z ′i δ + vi ,
vi ∼ i.i.d. N(0, σ2v ),
(6)
where z i and δ are d × 1 vectors of explanatory variables for heterogeneity and corresponding parameters, respectively, and vi is an independently and identically distributed disturbance term with a normal distribution of mean 0 and variance σ2v . We assume that heterogeneity for the i-th observation, w∗i , is additive to log conditional demand, yik . Then, the log conditional
7
demand with heterogeneity, y∗i , for the i-th consumer is given by: ∗ ∗ yik + wi , if y¯ i,k−1 < yik + wi < y¯ ik and k = 1, . . . , Ki , ∗ yi = if yi,k+1 + w∗i ≤ y¯ ik ≤ yik + w∗i and k = 1, . . . , Ki − 1, y¯ ik ,
(7)
where yik = x ′ik β and x ik = (pik , qik )′ . Another latent variable is the state variable, s∗i . There are 2Ki − 1 potential outcomes in the demand function Equation (7), including Ki conditional demands with heterogeneity (yik + w∗i ) and Ki − 1 threshold demands (¯yik ). The state variable, s∗i , is an unobserved discrete random variable taking values from 1 to 2Ki − 1 and indicates which outcome the i-th observation selects; if s∗i is odd, observation i chooses conditional demand with heterogeneity, and if s∗i is even, it selects the kink point as its demand. More precisely: ∗ ∗ 2k − 1, if yi = yik + wi and k = 1, . . . , Ki , ∗ si = if y∗i = y¯ ik and k = 1, . . . , Ki − 1. 2k,
(8)
It is straightforward from Equation (7) that the condition regarding whether y∗i equals yik + w∗i or y¯ ik is equivalent to the interval condition for heterogeneity. ( ) y¯ i,k−1 < yik + w∗i < y¯ ik ⇐⇒ w∗i ∈ Ri,2k−1 = y¯ i,k−1 − yik , y¯ ik − yik ⇐⇒ s∗i = 2k − 1,
(9)
) ( yi,k+1 + w∗i ≤ y¯ ik ≤ yik + w∗i ⇐⇒ w∗i ∈ Ri,2k = y¯ ik − yik , y¯ ik − yi,k+1 ⇐⇒ s∗i = 2k.
(10)
Furthermore, we assume that conditional demand yi for the i-th consumer is observed with a disturbance: yi = y∗i + ui ,
ui ∼ i.i.d. N(0, σ2u ),
i = 1, . . . , n,
(11)
where ui may imply optimization, specification, and measurement error (Hausman, 1985).
8
Finally, the statistical model for the demand function under increasing block-rate pricing is given by following equations: yik = x ′ik β ,
x ik = (pik , qik )′ ,
w∗i = z ′i δ + vi , 2k − 1, ∗ si = 2k, ∗ yik + wi , ∗ yi = y¯ ik , yi = y∗i + ui ,
k = 1, . . . , Ki ,
vi ∼ i.i.d. N(0, σ2v ), if w∗i ∈ Ri,2k−1 and k = 1, . . . , Ki , if
w∗i
∈ Ri,2k
(12) (13)
(14)
and k = 1, . . . , Ki − 1,
if s∗i = 2k − 1 and k = 1, . . . , Ki ,
(15)
if s∗i = 2k and k = 1, . . . , Ki − 1, ui ∼ i.i.d. N(0, σ2u ).
(16)
Error terms, including measurement error, ui , and the error for heterogeneity, vi , are assumed to be mutually independent conditional on the block choice s∗i because they represent different sources of error. This model is a multinomial extension of the Type V Tobit model; see Section 10.10 in Amemiya (1985) for more on the Type V Tobit model. Remark 1. Suppose Ki = 2. Then, Equations (14) and (15) reduce to: ∗ ∈ R = (−∞, y¯ − y ) , 1, if w yi1 + w∗i , if s∗i = 1, i1 i1 i1 i ∗ ∗ s∗i = y = (¯ ) 2, if w ∈ R = y − y , y ¯ − y , y¯ i1 , if s∗i = 2, i i2 i1 i1 i1 i2 i ∗ 3, if wi ∈ Ri3 = (¯yi1 − yi2 , ∞) , yi2 + w∗i , if s∗i = 3.
(17)
Remark 2. There may be consumers whose first block is a zero marginal price; that is, Pi1 = 0. They are assumed to consume more than or equal to the first threshold, y¯ i1 , as suggested by economic theory, which implies that s∗i = 2, . . . , Ki and Ri2 = (−∞, y¯ i1 − yi2 ).
9
3.2 Likelihood Function The augmented likelihood function for observation i is derived by multiplying two probability density functions. First, we derive the joint probability density function of unobserved variables, s∗i and w∗i . These variables are modeled using Equations (13) and (14). Thus: ) ( ) ) ( ( f s∗i , w∗i | β, δ, σ2v = f w∗i | δ, σ2v f s∗i | w∗i , β [ ] i −1 ( ) K∏ ) 1 ( ∗ ′ )2 ( ∗ −1 ∝ σv exp − 2 wi − z i δ I wi ∈ Ris∗i I x ′i,k+1 β ≤ x ′ik β , 2σv k=1
(18)
where I(A) is an indicator function taking a value of 1 if A is true and 0 otherwise. The ∏Ki −1 ′ last truncation term, k=1 I(xxi,k+1 β ≤ x ′ik β ), is the separability condition that is first explicitly considered in this article. The role of the separability condition is explained in the next subsection. After the unobserved variables are determined by Equation (18), the conditional probability density function of yi is derived using Equations (15) and (16) and given by: [ ( )2 ] 1 ′ ∗ ∗ −1 x β ( ) σu exp − 2σ2u yi − ik − wi , if si = 2k − 1 and k = 1, . . . , Ki , ∗ ∗ 2 β f yi | si , wi , , σu ∝ ] [ 1 2 −1 if s∗i = 2k and k = 1, . . . , Ki − 1, σu exp − 2σ2 (yi − y¯ ik ) , u
[
= σ−1 u exp −
1 ( yi − y∗i 2 2σu
)2 ]
(19) .
(20)
Finally, multiplying these two probability density functions (18) and (20), we obtain the augmented likelihood function for observation i: ) ) ( ) ( ( f yi , s∗i , w∗i | β , δ , σ2u , σ2v = f yi | s∗i , w∗i , β , σ2u f s∗i , w∗i | β , δ , σ2v [ { ) ( ) }] 1 −2 ( −1 −1 −2 ∗ 2 ∗ ′ 2 ∝ σu σv exp − σu yi − yi + σv wi − zi δ 2 10
i −1 ( ( ) K∏ ) ×I w∗i ∈ Ris∗i I x ′i,k+1 β ≤ x ′ik β .
k=1
(21)
3.3 The Separability Condition We briefly describe the role of the separability condition in our model. The separability condition is a condition that creates disjointed heterogeneity intervals. It guarantees that the upper limit is greater than or equal to the lower limit for intervals in Equation (10). Under the multiple-block-rate pricing, this condition is given by: ( ) yi,k+1 ≤ yik ⇐⇒ x′i,k+1 β ≤ x′ik β
for k = 1, . . . , Ki − 1 and i = 1, . . . , n.
(22)
Because β is two-dimensional in our case, the separability condition reduces to two conditions. Let r = maxi,k −(pi,k+1 − pik )/(qi,k+1 − qik ), and let r = mini,k −(pi,k+1 − pik )/(qi,k+1 − qik ). Then, Equation (22) is equivalent to β2 ≤ rβ1 and β2 ≤ rβ1 ,
(23)
which is the shadowed region found in Figure 2. When the conditional demand includes more than two variables, the separability condition is given by Equation (22). In this case, we must address as many inequality conditions as the number of observations and blocks to numerically maximize the likelihood function. Let us illustrate the role of the separability condition. Consider the maximization of augmented likelihood under two-block increasing block-rate pricing, assuming that there is only one observation. Condition (22) then reduces to yi2 ≤ yi1 as the only condition. Without this condition, the upper and lower limits for kink point demand are allowed to be reversed, and 11
β2=rβ1
β2
β2=rβ1
β1
Figure 2: Region suggested by the separability condition.
hence, there could be a case in which y¯ 1 − yi2 < w∗i < y¯ 1 − yi1 (see Ri2 of Equatioin (17)). Such a situation leads to ambiguity in the state variable if s∗i = 1 or 3. Therefore, any estimation without the separability condition causes disagreement within the model.
3.4 Posterior Density Function and Gibbs Sampler First, we assume proper prior distributions for the model parameters (ββ, δ , σ2u , σ2v ). For these parameters, we assume normal distributions for β and δ , conditional on σ2u and σ2v , and inverse gamma distributions for σ2u and σ2v . β | σ2u
) ( ) ( ( ) ( ) nv,0 S v,0 nu,0 S u,0 2 2 2 2 2 , , σv ∼ IG , , ∼ N2 µ β ,0 , σu Σ β ,0 , δ | σv ∼ Nd µ δ ,0 , σv Σ δ ,0 , σu ∼ IG 2 2 2 2 (24)
where µ β ,0 , is a 2 × 1 known vector; Σ β ,0 = diag(σ2β1 ,0 , σ2β2 ,0 ) is a 2 × 2 known diagonal matrix with diagonal elements (σ2β1 ,0 , σ2β2 ,0 ); µ δ ,0 is a d × 1 known vector, Σ δ ,0 is a known d × d covariance matrix; and nu,0 > 0, S u,0 > 0, nv,0 > 0, S v,0 > 0 are some known constants. In this article, the subscript on the normal distribution indicates its dimension.
12
The posterior density function for the statistical model in Equations (12) through (16) is obtained by multiplying the augmented likelihood function in Equation (21) over all observa( ) tions with the prior density function, π β , δ , σ2u , σ2v : ) ) ( ( π β , δ , σ2u , σ2v , s ∗ , w ∗ | y ∝ π β , δ , σ2u , σ2v [ { ] )′ ( ∗ )} 1 −2 ( −n −n ∗ )′ ( ∗) −2 ( ∗ y − y + σv w − Z δ w − Z δ × σu σv exp − σu y − y 2 K n i −1 ∏ ∏ ( ) ∗ ∗) × I(w ∈ R I y ≤ y , (25) i,k+1 ik is i i i=1
k=1
where y = (y1 , y2 , . . . , yn )′ , y ∗ = (y∗1 , y∗2 , . . . , y∗n )′ , s ∗ = (s∗1 , s∗2 , . . . s∗n )′ , w ∗ = (w∗1 , w∗2 , . . . w∗n )′ , and Z = (zz1 , z 2 , . . . , z n )′ . Under log-linear conditional demand and above priors, the full conditional posterior distributions are all standard distributions, as provided in Appendix A.1. We implement a standard Gibbs sampler to draw samples from the posterior density function (25), which is summarized in the following seven steps: Algorithm 1.1: MCMC algorithm for the model in Equations (12)-(16) Step 1. Initialize β , δ , s ∗ , w ∗ , σ2u and σ2v . Step 2. Generate β1 given β2 , s ∗ , w ∗ , σ2u . Step 3. Generate β2 given β1 , s ∗ , w ∗ , σ2u . ( ) Step 4. Generate σ2v , δ given w ∗ . ) ( Step 5. Generate s∗i , w∗i given β , δ , σ2u , σ2v for i = 1, . . . , n. Step 6. Generate σ2u given β , s ∗ , w ∗ . Step 7. Go to Step 2. A blocking technique is used to sample (s∗i , w∗i ) in order to isolate the relationship in which w∗i determines s∗i , while blocking in (σ2v , δ ) is used to accelerate the convergence of MCMC draws. 13
3.5 Convergence Acceleration As we shall see in Sections 4 and 5, the obtained samples of parameters are sometimes highly autocorrelated so that their convergence to the posterior distribution is slow. This subsection introduces a generalized Gibbs step proposed by Liu and Sabatti (2000) to improve sampling efficiency. While its implementation is simple, the GGS improves sampling efficiency to some extent in the estimation of the discrete/continuous choice model. The main idea of the GGS is to add one more sampling step for a transformation group while keeping the transition kernel of MCMC invariant, so that we can obtain acceleration effects similar to those of re-parametrization or blocking; see Section 2 of Liu and Sabatti (2000) and Section 8.3 of Liu (2001) for a general definition of the GGS. In our case, we apply the GGS to all parameters ζ = (ββ, δ , w ∗ , σu , σv ) so as to implement the one-step Metropolis-Hastings (MH) algorithm described below, and take a scale transformation group, that is, Γ = {g > 0 : g(ζζ ) = gζζ }. Then, the full conditional probability density function of g˜ ≡ g−1 is derived as Equation (A.37) in Appendix A.2. This full conditional probability density function is a nonstandard density function, so that the MH algorithm is adopted to draw a sample of g˜ . Starting from the initial value g˜ = 1, we draw a candidate g˜ ′ , which follows the truncated normal distribution with mean µg˜ , variance σ2g˜ , and truncation interval Rg˜ :
( ) T NRg˜ µg˜ , σ2g˜ ,
(26)
where µg˜ = a2 /a1 and σ2g˜ = a−1 1 . See Equations (A.38), (A.39), and (A.41) in Appendix A.2 for definitions of a1 , a2 , and Rg˜ . The candidate is accepted with probability α (˜g, g˜ ′ ) = min[1, (˜g′ /˜g)a0 −1 ], where a0 = n + nu,0 + nv,0 . The MH algorithm typically must be repeated in order to obtain a sample from the conditional posterior density function of g˜ . As we have proved in Appendix A.3, however, it is sufficient to draw a sample only once using the initial value g˜ = 1. Therefore, the GGS is 14
implemented by replacing Step 7 of Algorithm 1.1 described in the previous subsection as follows: Algorithm 1.2: Generalized Gibbs step for the model in Equations (12)-(16) Step 7. Generate g˜ given β , s ∗ , w ∗ , σu , σv . (a) Generate g˜ ′ ∼ T NRg˜ (µg˜ , σ2g˜ ) and u ∼ U (0, 1), where U (0, 1) denotes a uniform distribution on interval (0, 1). (b) Accept a candidate g˜ ′ if u ≤ α (1, g˜ ′ ). If rejected, let g˜ = 1. Step 8. Transform parameters (ββ, δ, w∗ , σu , σv ) by multiplying parameters by g = g˜ −1 .The state variable s ∗ is also updated by this new w ∗ . Step 9. Go to Step 2.
4
Illustration Using Simulated Data
This section illustrates our Bayesian estimation of the statistical model based on Equations (12) to (16), using simulated data. We consider two-block increasing block-rate pricing with 1, 000 observations. The marginal price for the first block is generated using |N(1, 0.52 )|, which is the absolute value of a random number following a normal distribution with mean 1 and variance 0.52 . The absolute value is taken to guarantee a positive marginal price. The second block’s marginal price is similarly generated by adding |N(1, 0.52 )| to the first block’s price. There is one threshold in this price system, which is set equal to 0.5. As for other variables, income is generated by |N(2, 0.52 )|, and fixed cost is equal to 0. We consider only one explanatory variable other than the constant term for heterogeneity following N(0, 1). Thus, δ = (δ0 , δ1 )′ . The true parameter values are (β1 , β2 , δ0 , δ1 , σu , σv ) = (−0.6, 0.3, 0.1, 0.1, 0.3, 0.1). The regression parameter for price is set to be more elastic than for income based on evidence pro15
Table 1: Estimation summary with simulated data by GGS
Parameter
True
Mean
SD
β1 β2 δ0 (constant) δ1 σu (measurement error) σv (heterogeneity)
−.6 .3 .1 .1 .3 .1
−.62 .35 .090 .084 .29 .12
.067 .10 .11 .010 .019 .040
95% interval [−.76 [ .14 [−.11 [ .064 [ .24 [ .054
INEF GGS / GS ∗
CD ∗∗
−.49] 17.2 / 41.7 .116 .54] 96.4 / 385.4 .108 .30] 134.9 / 498.8 .331 .10] 1.7 / 2.7 .205 .32] 35.5 / 69.2 .468 .20] 49.4 / 90.9 .413
∗
“INEF GGS / GS” denotes the estimated inefficiency factors using the Gibbs sampler with Generalized Gibbs step and the standard Gibbs sampler ∗∗ “CD” denotes the convergence diagnostics.
vided in previous studies on the water demand function; see Table 2 of Hewitt and Hanemann (1995). The prior distributions are: ( ) ( ) ( ) ( ) β | σ2u ∼ N2 0, 102 σ2u I , δ | σ2v ∼ N2 0, 102 σ2v I , σ2u ∼ IG 10−2 , 10−2 , σ2v ∼ IG 10−2 , 10−2 . (27) −2 2 The mean and variance for the precision parameters σ−2 u and σv are 1 and 10 , respectively.
In hierarchical modeling, it is often pointed out that flat or improper prior distributions for variance parameters may lead to (almost) improper posterior distributions (see, for example, Section 5.3 of Gelman, Carlin, Stern, and Rubin (1995)), which makes Bayesian inference unreliable. Thus, we use relatively tight proper prior distributions for σ2u and σ2v to avoid (almost) improper posterior distributions. We draw MCMC samples via the Gibbs sampler under Algorithm 1.1 and find its sample autocorrelations are very high. Thus, we apply the generalized Gibbs step under Algorithm 1.2, to accelerate convergence of the samples to their posterior distribution. After deleting 3×10⁴ samples, we draw 105 samples by applying the acceleration step. The obtained samples are reduced to 104 by selecting every 10-th value. The GGS results are reported in Table 1. 16
Because the other results obtained by the Gibbs sampler are very similar to those obtained by the GGS, we omit them. Table 1 reports true values, posterior means, posterior standard deviations, 95% credible intervals, estimated inefficiency factors, and the convergence diagnostics (i.e., the two-sided p∑ values of the test for convergence). The inefficiency factor is defined as 1 + 2 ∞ j=1 ρ( j), where ρ( j) is the sample autocorrelation at lag j. It is estimated by using the spectral density; see Section 3.2 of Chib (2001) for details. It is interpreted as the ratio of the variance of the sample mean from the Markov chain to the variance of uncorrelated draws. If the inefficiency factor is close to one, the sampling method is almost as efficient as an independent draw. The greater the inefficiency factor becomes, the more samples we need to take to reach convergence. The convergence diagnostic is the test statistic with a null hypothesis of convergence, as proposed in Section 3.2 of Geweke (1992). We use the first 10% and the last 50% of samples to calculate this test statistic, as suggested by Geweke (1992). In Table 1, we found smaller inefficiency factors under GGS than GS. We compare these two samplers in terms of their sample autocorrelation functions. Figure 3 shows the sample autocorrelation function of β2 for GS and GGS results; autocorrelation decays more quickly in GGS than in GS. Thus, we conclude that the GGS is effective for β2 in improving sample convergence. There are two findings regarding this simulation. The first is the role of the kink point. The state change helps us to separately estimate measurement error σu and heterogeneity error σv . When the kink point is chosen, however, other information, such as regression coefficients β and coefficients for heterogeneity δ is lost, which causes the sampling of our model to become inefficient. Second, initial values are important for efficient sampling, which is also a difficult task in the maximum likelihood method; see Section 4 of Moffitt (1986). Because the full conditional distributions, especially for β , are restricted to the tight parameter space, samples cannot 17
Figure 3: Sample autocorrelation functions for β2 . move freely in their state space. Thus, when initial values are far from true values, it takes a considerable amount of time for the distribution of the MCMC samples to converge to the posterior distribution. Because we do not know much about the true parameter values in the empirical analysis, testing several initial values might be effective when sampling appears to be inefficient.
5 Estimation of the Japanese Residential Water Demand Function 5.1 Data Description We use household-level dataset collected by INTAGE Inc. (www.intage.co.jp/english) through an online questionnaire. The population consists of households between the age of 20 and 79 years in the Tokyo and Chiba prefectures. In June 2006, there were over 8 million such households. Among these, INTAGE Inc. collected data from 47, 239 households, from which we have randomly chosen 1, 678 households. Overall, 1, 250 households out of 1, 678 participated in our research.
18
Table 2: Variables used in the water demand function Variable Coefficient Description year num. of obs.
June 2006 365
price virtual income
β1 β2
water+sewer (log ¥103 /m3 ) two-month income augmented by price (log ¥103 )
variables for w∗i
δ0 δ1 δ2 δ3
the constant the number of members in a household (person) the number of rooms in a house/apartment (room) the total floor space of a house/apartment (50m2 )
Table 3: Summary statistics of variables used in the water demand function Variable Unit Mean SD Min. Max. the amount of water log m3 the two-month income ¥103 the number of members in a household person the number of rooms in a house/apartment room the total floor space of a house/apartment 50m2
3.53 .51 .098 1145.00 566.11 166.67 3.05 1.22 1 4.29 1.10 1 1.66 .70 .24
4.87 4666.70 7 8 4.60
All households face increasing block-rate pricing, where the number of blocks varies from five to eleven (see Figure 4(a)). The dependent variable is the amount of water calculated from each payment using corresponding price tables. This amount is the water amount that has been used in the last two months because water is charged every two month in Japan. The explanatory variables to be used for empirical analysis are summarized in Table 2, and their summary statistics are found in Table 3 and Figure 4. The number of observations was reduced to 365 because of the following reasons. 1. Missing data concerning household attributes. 2. Missing data concerning water usage. 3. Difficulty in identifying the corresponding rate table. 4. Consumption within the zero marginal price block was observed.
19
0.5
6
1.0
0.4
5
0.8
4
0.3
0.6
3 0.2
4
0.4
2
0.1
0.2
1 5
6
7
8
9
10 11 12
(a) Number of blocks (number).
0.0
0.1
0.2
0.3
0.4
0.5
(b) Price where the consumption is actually made (¥103 /m3 ).
0
1
2
3
4
5
6
7
8
(c) Fixed cost (¥103 ).
Figure 4: Histograms of the number of blocks, price, and fixed cost. Observations linked to any of the above issues were omitted. Regarding the income variable, asking households for their exact income level is a sensitive task. In our research, the household annual income is recorded in one of eight intervals in million yen, including 0-2, 2-4, 4-6, 6-8, 8-10, 10-12, 12-15, and over 15 million yen. Then, we use the median of the interval divided by 6 as a proxy for two-month income for most households. Households with annual income over 15 million yen were asked to approximate their annual income, and we divided it by 6 to estimate two-month income for those households.
5.2 Empirical Result Initially, the following prior distributions are assumed for the parameters of the demand function: ( ) ( ) ) ( ) ( β | σ2u ∼ N2 0 , 10σ2u I , δ | σ2v ∼ N4 0 , 10σ2v I , σ2u ∼ IG 10−1 , 10−1 , σ2v ∼ IG 10−1 , 10−1 . (28)
Because the Gibbs sampler (Algorithm 1.1) in Subsection 3.4 is very slow to converge 20
Table 4: Water demand function
Parameter
Mean
SD
β1 (price) β2 (income) δ0 (constant) δ1 (num. of members) δ2 (num. of rooms) δ3 (floor space) σu (measurement error) σv (heterogeneity)
−1.09 .067 .23 .23 .14 .041 .42 .20
.22 .044 .51 .039 .049 .077 .018 .038
95% interval [−1.52 [− .028 [− .89 [ .16 [ .038 [− .11 [ .38 [ .14
INEF GGS / GS ∗
− .67] 242.55 / 370.44 .14] 272.18 / 583.76 1.12] 312.61 / 500.76 .31] 54.90 / 63.16 .23] 7.65 / 9.31 .20] 7.07 / 7.47 .45] 8.91 / 19.41 .28] 17.39 / 10.60
CD ∗∗ .201 .025 .055 .983 .198 .987 .531 .021
∗
“INEF GGS / GS” denotes the estimated inefficiency factors using the Gibbs sampler with Generalized Gibbs step and the standard Gibbs sampler ∗∗ “CD” denotes the convergence diagnostics.
to the posterior distribution, we accelerate the convergence of the MCMC samples using the GGS described in Algorithm 1.2 of Subsection 3.5. The initial 16 × 105 samples are discarded, and the subsequent 4 × 10⁶ samples are recorded. The recorded samples are reduced to 104 samples by picking up every 400-th value. These estimation results are shown in Table 4. To first check the plausibility of our proposed model, we carried out the numerical posterior predictive checks (PPCs) based on these results; see Chapter 6 of Gelman, Carlin, Stern, and Rubin (2003). Seven test quantities (including the first and third quartile, mean, median, standard deviation, minimum, and maximum) were chosen to conduct PPCs, and the results are found in Figure 5. The density plots represent those of test quantities based on the replicated data from the predictive distribution, and the vertical lines denote the values of test quantities based on the observed data. We also calculated the posterior predictive p-values, which are shown in parentheses. All density plots and p-values, except those for the minimum, indicate that the discrete/continuous choice model would be plausible to represent our Japanese residential water demand data. The small p-value for the minimum indicates that we may need to improve our model for low levels of consumption; the five lowest levels of
21
1st q. ( p = .082 )
Mean ( p = .067 )
Median ( p = .25 )
SD ( p = .53 )
Min. ( p = 1.00 )
Max. ( p = .84 )
3rd q. ( p = .57 )
Figure 5: Posterior predictive checks. consumption are 0.098, 1.79, 1.86, 1.92, and 1.95 log m3 . As stated in Remark 2 of Subsection 3.1, for simplicity, we excluded households that consume within the zero marginal price block so that all consumptions are above this block. The PPC result for the minimum is improved when we include in the model these households that consume little water, which could be a future exercise in follow-up studies. Next, we analyze the GGS results. The posterior mean of the price elasticity, β1 , is estimated to be negative at −1.09. Because the 95% credible interval does not include zero, the probability that β1 < 0 is greater than 0.95. This is consistent with economic theory. However, the posterior mean of the income elasticity, β2 , may equal to zero, because its 95% credible interval includes zero. Among the independent variables that are expected to explain individual heterogeneity, the number of members in a household and the number of rooms in a house or apartment exhibit a positive relationship with residential water demand because Pr(δ j > 0 | y ) > .95 ( j = 1, 2). Furthermore, the former has a larger marginal effect on demand than does the latter. That is, a one-person increase in a household has greater effect on water demand than does a one-room extension to a house/apartment does. In contrast, the total floor space in a house/apartment (δ3 ) has no effect on water demand in terms of its 95% credible interval. We compare these parameter estimates with those of previous studies on water demand. 22
Hewitt and Hanemann (1995) used microdata from Denton, Texas and employed the discrete/continuous choice model as the underlying statistical model. Hewitt and Hanemann (1995) then estimated the water demand function under block-rate pricing using the maximum likelihood method. Because of the complex form of the likelihood function, that analysis simply focused on households under two-block increasing block-rate pricing. They reported that the price and income parameters are −1.8989 and 0.1782, respectively. While these parameters are larger in terms of absolute value than ours, Hewitt and Hanemann (1995)’s estimates show a similar pattern to ours (i.e., the larger price and smaller income elasticities in their absolute values). Olmstead et al. (2007) also applied the discrete/continuous choice model to estimate the water demand function. They used microdata from the United States and Canada that incorporates different price schedules, such as two-block and four-block increasing block-rate pricings and the uniform price system. They showed that the price and income parameters for households under block-rate pricing are estimated at −0.6411 and 0.1959, respectively. Dalhuisen, Florax, de Groot, and Nijkamp (2003) analyzed 64 studies on water demand and presented the meta-analysis on price and income elasticities. They showed that the price and income elasticities are dispersed with means −0.41 and 0.43, respectively, and standard deviations 0.86 and 0.79, respectively. Their estimates are somewhat similar to ours when we take their large standard deviations into consideration.
5.3 Predictive Analysis At the end of this section, we conduct a posterior predictive analysis on water demand when the block-rate price schedule is changed to uniform pricing. We consider two types of uniform pricing; namely, the same uniform price for all households and different uniform prices for each households. For the former, let the unit price be ¥100/m3 , ¥250/m3 , or ¥500/m3 and set
23
the fixed cost to ¥3, 500 for every price scenario. These unit prices are inexpensive, almost as high as, or expensive ones for the majority of households as compared with the present increasing block-rate pricing, and the fixed cost is set close to the present fixed cost for most households (see Figures 4(b) and 4(c)). Other variables remain the same. For the latter, we use the price of the block where water is actually consumed and use it as the single price for the suppositional uniform price system. The fixed cost remains the same as with the present schedule. Furthermore, the virtual income for the block where water is actually consumed is used for total income. Other variables remain the same. Under this hypothetical change, the budget line becomes the straight line that matches the current piecewise-linear budget line at the block where water is actually consumed. To analyze the effect of these price schedule changes, we generate samples of predictive demand using the Gibbs with GGS samples, and draw boxplots of predictive distributions for each household found in Figure 6.
\100/m 3
\250/m 3
\500/m 3
different uniform prices
Figure 6: Effects of uniform pricings. In this figure, solid lines and boxplots represent plots of actual log demands and boxplots of predictive distribution for each households, respectively. Water consumption of each 24
household is arranged in ascending order, and the number of households is reduced to 60 by selecting every 6-th household. Each box represents the range between the first and third quartiles. The upper and lower whiskers denote the 95-th and 5-th percentiles, respectively. The first three panels in Figure 6 reveal that most households consume more water as price decreases, which is consistent with the negatively-estimated price elasticity. The bottom right panel in Figure 6, however, shows another aspect of our data. From a microeconomic view-point, a change of this kind has no effect on consumption when an underlying preference satisfies regular assumptions. However, this result is different from what we would expect based on the microeconomic theory, especially for households that consume less than approximately 3 log m3 . When we assume that our statistical modeling is correct, the actual consumption block for these households is suboptimal partly due to heterogeneity and/or partly due to measurement error. Thus, this result implies that we may need to take special care with these households in terms of heterogeneity and/or measurement error.
6 Concluding Remarks This article proposes a Bayesian estimation method for demand functions under block-rate pricing and reports empirical analysis using Japanese residential water demand data. Furthermore, the separability condition is explicitly considered to obtain appropriate estimates. Our method is useful for analyzing demand for water services, as well as for other goods or services involving block-rate pricing, including taxes. Furthermore, it would be possible to apply our method to examine a consumer’s choices over multiple product categories and brands (Song and Chintagunta, 2007) and a consumer’s selection of wireless calling plans (Iyengar, 2004). Future research can be conducted on several related issues. First, the supply structure must be considered when applying our method to other goods under block-rate pricing. Water 25
companies are regional monopolists and are obliged to supply as much water as consumers require. Thus, we excluded firm competition. Other suppliers, such as telecommunication services and deregulated electricity services, face no such obligation and compete fiercely with each other. To analyze demand of these services, it is necessary to explicitly consider the supply structure in our model. Disequilibrium models represent a framework that address such market structures. See Kunitomo and Sato (1996) and Maddala (1983) for a discussion of disequilibrium models. Second, as pointed out in the previous section, there are households that consume less than the zero marginal price block. The discrete/continuous choice model proposed by this article excludes such behavior. Developing a structural approach to these consumers is a necessary aspect of future studies. Third, substitution among electricity, gas, and other fuels must be considered. It is possible for the block-rate pricing model proposed here to be extended to a multivariate setting in a natural way. Furthermore, Japanese gas companies provide natural gas under a decreasing block-rate pricing system. Thus, a subsequent study should examine the energy demand function under a mixture of increasing and decreasing block-rate pricing. Finally, an improved convergence acceleration method must be developed. Although the generalized Gibbs step improved sampling efficiency, the regression coefficients β still show high sample autocorrelation. Further improvement of convergence acceleration should be a subject of future research.
26
Appendices A.1 Full Conditional Distributions for the Statistical Model in Equations (12) to (16) This section provides the full conditional distributions for the statistical model in Equations (12) to (16) following the standard Gibbs sampler’s steps (see Algorithm 1.1 in Subsection 3.4). Let A denote a set of observations that do not select the threshold or kink point as their demand. That is, A = {i|s∗i is odd and equal to 2ki − 1}. Furthermore, without loss of generality, we assume that pi1 , qi1 , y¯ i1 are strictly positive; i.e., pi1 , qi1 , y¯ i1 > 0. This can be accomplished by adjusting the unit of measurement for price and income. When Pi1 = 0 (pi1 = −∞), we assume s∗i ≥ 2 and let pi2 > 0. Step 2. Generate β1 given β2 , s ∗ , w ∗ , σ2u . The full conditional distribution for β1 is the truncated normal distribution T NR1 (µ1 , σ2u σ21 ), where: ∑( ) ∑ ) ( ∗ −2 −2 − w piki 2 , y − β q , σ = σ + µ1 = σ21 σ−2 p µ + i 2 β ,0 ik ik i i i 1 β1 ,0 β1 ,0 1 i∈A i∈A )) ( ( qi,k+1 − qik , R1 = max (−∞, BLi ) , min BUi , −β2 i i,k pi,k+1 − pik
(A.29)
and µβ1 ,0 is the prior mean of β1 . The BLi and BUi are the respective lower and upper bounds of the interval Bi such that: ( ) y¯ i,k−1 −β2 qik −w∗i y¯ i,k −β2 qik −w∗i , , pik pik Bi = ( ) y¯ i,k −β2 qik −w∗i y¯ i,k −β2 qi,k+1 −w∗i , , pik pi,k+1
if s∗i = 2k − 1, if
s∗i
(A.30)
= 2k.
These Bi s are constructed from intervals Ris∗i and defined in Equations (9) and (10) of Subsection 3.1. To sample from the truncated normal distributions, we use the inverse cumulative
27
distribution function sampling method; see Section 1.3 of Gamerman (1997). Step 3. Generate β2 given β1 , s ∗ , w ∗ , σ2u . As in Step 2, the full conditional distribution for β2 is the truncated normal distribution T NR2 (µ2 , σ2u σ22 ), where: ∑ ∑( ) ( ) ∗ −2 −2 µ2 = σ22 σ−2 µ + q y − β p − w , σ = σ + qiki 2 , 1 iki iki i i β2 ,0 β2 ,0 2 β2 ,0 i∈A i∈A )) ( ( ( ) p − p i,k+1 ik , R2 = max −∞, BLi† , min BUi† , −β1 i i,k qi,k+1 − qik
(A.31)
and µβ2 ,0 is the prior mean of β2 . The BLi† and BUi† are the respective lower and upper bounds of interval B†i such that: ( ) y¯ i,k−1 −β1 pik −w∗i y¯ i,k −β1 pik −w∗i , , qik qik B†i = ( ) y¯ i,k −β1 pik −w∗i y¯ i,k −β1 pi,k+1 −w∗i , , qik qi,k+1
if s∗i = 2k − 1, if
s∗i
(A.32)
= 2k.
Step 4. Generate (σ2v , δ ) given w ∗ . Because a blocking technique is applied in this step, δ is integrated over the full conditional distribution of (δδ, σ2v ) to obtain the full conditional distribution of σ2v . Thus, generate the sample of σ2v from the inverse gamma distribution IG(
nv,1 S v,1 2 , 2 ),
µδ ,1 , σ2v Σ δ ,1 ), and the sample of δ from the multivariate normal distribution Nd (µ
where nv,1 = nv,0 + n, ∗′ ∗ ′ −1 S v,1 = S v,0 + µ ′δ ,0 Σ −1 δ ,0 µ δ ,0 + w w − µ δ ,1 Σ δ ,1 µ δ ,1 , ( ) ′ ∗ −1 ′ µ δ ,1 = Σ δ ,1 Σ −1 µ + Z w , Σ −1 δ ,0 δ ,0 δ ,1 = Σ δ ,0 + Z Z .
(A.33)
Step 5. Generate (s∗i , w∗i ) given β , δ , σ2u , σ2v for i = 1, . . . , n. We again apply a blocking technique in drawing samples of (s∗i , w∗i ). Then, the conditional posterior distribution of s∗i is discrete
28
such that:
Pr
(
s∗i
=
s | β , δ , σ2u , σ2v
)
( m ) } { }] [ { is −1 −1 , ∝ τ s Φ τ s (RUis − θis ) − Φ τ s (RLis − θis ) exp − 2
(A.34)
for s = 1, . . . , 2Ki − 1, where Φ(·) is the cumulative density function of the standard normal distribution; RUis and RLis denote the respective upper and lower limit of the interval for heterogeneity; Ris is given by Equations (9) and (10); and (mis , θis , τ2s ) is defined as follows: ( ) σ−2 σ−2 yi − yik − z ′ δ 2 σ−2 (y − y ) + σ−2 z ′ δ i ik i v i u u v −2 −2 −1 , , {σu + σv } , −2 −2 −2 −2 σu + σv σu + σv ( ) 2 mis , θis , τ s = if s = 2k − 1, ) ( 2 2 ′ σ−2 ) (y δ , σ , z − y ¯ i ik v , if s = 2k. u i
(A.35)
Given s∗i = s, we generate w∗i from T NRis (θis , τ2s ). Step 6. Generate σ2u given β , s ∗ , w ∗ . It is straightforward to show that the full conditional posterior distribution of σ2u is the inverse gamma distribution IG( 2 + n and
A.2
nu,1 S u,1 2 , 2 ),
where nu,1 = nu,0 +
( )′ ( ) ( ) ∗ )′ ( y − y∗ . S u,1 = S u,0 + β − µβ ,0 Σ−1 β,0 β − µβ ,0 + y − y
(A.36)
Full Conditional Density of g˜
We assume that y¯ i1 is strictly positive. The full conditional probability density function of g˜ (= g−1 ) is derived as follows. First, we substitute parameters multiplied by g (= g˜ −1 ) into the posterior density (25). Because the number of parameters to be accelerated is 4 + d + n, the Jacobian of this transformation is g−(4+d+n) . Transforming g to g˜ , the conditional probability
29
density function of g˜ is given by: [ { }] ( ) ( ) 1 ∗ ∗ 2 a0 π g˜ | β , s , w , σv , σu ∝ g˜ exp − a1 g˜ − 2a2 g˜ I g˜ ∈ Rg˜ L(dg˜ ), 2
(A.37)
where L(dg˜ ) = g˜ −1 dg˜ is the left-Haar measure; a0 = n + nu,0 + nv,0 ; and n ∑ ( ) 2 S u,0 + µ ′ Σ −1 µ + + σ−2 S v,0 + µ ′ Σ −1 µ , a1 = σ−2 a β ,0 δ ,0 u v 4i β ,0 β ,0 δ ,0 δ ,0 i=1 n ∑ β ′ Σ −1 µ + + σ−2 δ ′ Σ −1 µ , a2 = σ−2 a a 3i 4i β u v δ ,0 δ,0 β ,0 ,0 i=1 ( ) ∗ , y , if s∗ = 2k − 1, y + w i ik i i (a3i , a4i ) = (0, yi − y¯ ik ) , if s∗i = 2k, ( ( ) ( )) ∗ ∗ Rg˜ = max 0, BLi , min BUi , ∞ . i
i
(A.38) (A.39)
(A.40)
(A.41)
The BLi∗ and BUi∗ are the respective lower and upper bounds of the interval B∗i , which is given by:
A.3
( ) β1 pik +β2 qik +w∗i β1 pik +β2 qik +w∗i , , y¯ ik y¯ i,k−1 B∗i = ) ( β1 pi,k+1 +β2 qi,k+1 +w∗i β1 pik +β2 qik +w∗i , , y¯ ik y¯ ik
if s∗i = 2k − 1, if
s∗i
(A.42)
= 2k.
Proof for the One-step MH Algorithm
We prove that it suffices to implement a one-step MH algorithm using the initial value g˜ = 1 in our GGS. By Theorem 2 of Liu and Sabatti (2000), it is sufficient to prove that for all g˜ , g˜ ′ , g˜ 0 ∈ Γ˜ = {˜g > 0 : g˜ (x) = g˜ −1 x}, ( ) ( ) T ζ g˜ , g˜ ′ L(dg˜ ′ ) = T g˜ −1 ζ g˜ g˜ 0 , g˜ ′ g˜ 0 L(dg˜ ′ ), 0
where T ζ (˜g, g˜ ′ ) L(dg′ ) is the transition kernel of our Markov chain.
30
(A.43)
Let qζ (˜g′ ) denote our proposal density function. Then, the transition kernel becomes T ζ (˜g, g˜ ′ ) = qζ (˜g′ )α(˜g, g˜ ′ )˜g′ , where the last g˜ ′ is the adjustment term for the left-Haar measure. It is obvious that the acceptance probability α(˜g, g˜ ′ ) is invariant to the scale transformation of g˜ 0 . Moreover, we find that: ) ) g˜ ′ − µg˜ ′ ( ′ I g˜ ∈ Rg˜ g˜ ′ , qζ (˜g )˜g σg˜ ′ ( )−1 ( g˜ ′ g˜ 0 − g˜ 0 µg˜ ′ ) ( ) ′ ′ qg˜ −1 ζ (˜g g˜ 0 )˜g g˜ 0 = g˜ 0 σg˜ ′ ϕ I g˜ ′ g˜ 0 ∈ g˜ 0 Rg˜ g˜ ′ g˜ 0 = qζ (˜g′ )˜g′ , 0 g˜ 0 σg˜ ′ ′
′
= σ−1 g˜ ′ ϕ
(
(A.44) (A.45)
where ϕ(·) is the probability density function of the standard normal distribution. Thus, the transition kernel of the Markov chain is invariant to the transformation g˜ , which completes the proof.
Acknowledgements This work is supported by the Grants-in-Aid for Scientific Research 18330039 from the Japanese Ministry of Education, Science, Sports, Culture and Technology as well as by the Japan Society for the Promotion of Science Fellowship. We thank J. P. LeSage for his insightful discussions and A. E. Gelfand, D. Poirier, S. Fr¨uhwirth-Schnatter, H. K. van Dijk, A. C. Harvey, N. Kunitomo, T. Kubokawa, and A. C. Cameron for their helpful comments. The constructive advice offered by H. Ino, T. Kawamori, and K. Kakamu, and the valuable editing assistance of R. Smith are also appreciated. All computational results were obtained using Ox for Linux (Doornik, 2002).
31
References Amemiya, T. (1985). Advanced Econometrics. Cambridge, Massachusetts: Harvard University Press. Burtless, G. and J. A. Hausman (1978). The effect of taxation on labor supply: Evaluating the Gary negative income tax experiment. Journal of Political Economy 86(6), 1103–1130. Chib, S. (1992). Bayes inference in the Tobit censored regression model. Journal of Econometrics 51, 79–99. Chib, S. (2001). Markov chain Monte Carlo methods: Computation and inference. In J. J. Heckman and E. Leamer (Eds.), Handbook of Econometrics, Volume 5, Chapter 57, pp. 3569–3649. Amsterdam: North-Holland. Chib, S. and E. Greenberg (1996). Markov chain Monte Carlo simulation method in econometrics. Econometric Theory 12, 409–431. Dalhuisen, J. M., R. J. G. M. Florax, H. L. F. de Groot, and P. Nijkamp (2003). Price and income elasticities of residential water demand: A meta-analysis. Land Economics 79(2), 292–308. de Jong, G. C. (1990). An indirect utility model of car ownership and private car use. European Economic Review (34), 971–985. Doornik, J. A. (2002). Object-Oriented Matrix Programming Using Ox (3rd ed.). London: Timberlake Consultants Press and Oxford. Gamerman, D. (1997). Markov Chain Monte Carlo: Stochastic Simulation for Bayesian Inference. Texts in Statistical Science. London: Chapman and Hall.
32
Gelman, A., J. B. Carlin, H. S. Stern, and D. B. Rubin (1995). Bayesian Data Analysis. London: Chapman and Hall. Gelman, A., J. B. Carlin, H. S. Stern, and D. B. Rubin (2003). Bayesian Data Analysis (2nd ed.). London: Chapman & Hall/CRC. Geweke, J. (1992). Evaluating the accuracy of sampling-based approaches to the calculation of posterior moments. In J. M. Bernardo, J. O. Berger, A. P. Dawid, and A. F. M. Smith (Eds.), Bayesian Statistics 4, pp. 169–193. Oxford: Oxford University Press. Hanemann, W. M. (1984). Discrete/continuous models of consumer demand. Econometrica 52(3), 541–562. Hausman, J. A. (1985). The econometrics of nonlinear budget sets. Econometrica 53(6), 1255–1282. Herriges, J. A. and K. K. King (1994). Residential demand for electricity under inverted block rates: Evidence from a controlled experiment. Journal of Business and Economic Statistics 12(4), 419–430. Hewitt, J. A. and W. M. Hanemann (1995). A discrete/continuous choice approach to residential water demand under block rate pricing. Land Economics 71, 173–192. Iyengar, R. (2004). A structural demand analysis for wireless services under nonlinear pricing schemes. unpublished working paper, Marketing Department, Wharton School, University of Pennsylvania. Kunitomo, N. and S. Sato (1996). Asymmetry in economic time series and the simultaneous switching autoregressive model. Structural Change and Economic Dynamics 7, 1–34.
33
Liu, J. S. (2001). Monte Carlo Strategies in Scientific Computing. Springer Series in Statistics. Springer-Verlag New York. Liu, J. S. and C. Sabatti (2000). Generalised Gibbs sampler and multigrid Monte Carlo for Bayesian computation. Biometrika 87(2), 353–369. Maddala, G. S. (1983). Limited-dependent and Qualitative Variables in Econometrics. Number 3 in Econometric Society Monographs. Cambridge, New York: Cambridge University Press. Moffitt, R. (1986). The econometrics of piecewise-linear budget constraint. Journal of Business and Economic Statistics 4(3), 317–328. Moffitt, R. (1989). Estimating the value of an in-kind transfer: the case of food stamps. Econometrica 57(2), 385–409. Olmstead, S. M., W. M. Hanemann, and R. N. Stavins (2007). Water demand under alternative price structures. Journal of Environmental Economics and Management 54(2), 181–198. Reiss, P. C. and M. W. White (2005). Household electricity demand, revisited. Review of Economic Studies 72, 853–883. Song, I. and P. K. Chintagunta (2007). A discrete-continuous model for multicategory purchase behavior of households. Journal of Marketing Research 44(4).
34