Statistical Challenges in 21st Century Cosmology Proceedings IAU Symposium No. 306, 2014 A.C. Editor, B.D. Editor & C.E. Editor, eds.
c 2014 International Astronomical Union
DOI: 00.0000/X000000000000000X
Bayesian Inference for Radio Observations Going beyond deconvolution Michelle Lochner1,2 , Bruce Bassett1,2,3 , Martin Kunz1,4 , Iniyan Natarajan5 , Nadeem Oozeer1,6,7 , Oleg Smirnov6,8 & Jonathan Zwart9
arXiv:1509.04034v1 [astro-ph.IM] 14 Sep 2015
1
African Institute for Mathematical Sciences, 6 Melrose Road, Muizenberg, 7945, South Africa email:
[email protected] 2 Department of Mathematics and Applied Mathematics, University of Cape Town, Rondebosch, Cape Town, 7700, South Africa 3 South African Astronomical Observatory, Observatory Road, Observatory, Cape Town, 7935, South Africa 4 D´epartement de Physique Th´eorique and Center for Astroparticle Physics, Universit´e de Gen`eve, Quai E. Ansermet 24, CH-1211 Gen`eve 4, Switzerland 5 Astrophysics, Cosmology and Gravity Centre (ACGC), Department of Astronomy, University of Cape Town, Private Bag X3, Rondebosch 7701, South Africa 6 SKA South Africa, 3rd Floor, The Park, Park Road, Pinelands, 7405, South Africa 7 Centre for Space Research, North-West University, Potchefstroom 2520, South Africa 8 Department of Physics and Electronics, Rhodes University, PO Box 94, Grahamstown, 6140, South Africa 9 Department of Physics & Astronomy, University of the Western Cape, Private Bag X17, Bellville 7535, South Africa
Abstract. Radio interferometers suffer from the problem of missing information in their data, due to the gaps between the antennas. This results in artifacts, such as bright rings around sources, in the images obtained. Multiple deconvolution algorithms have been proposed to solve this problem and produce cleaner radio images. However, these algorithms are unable to correctly estimate uncertainties in derived scientific parameters or to always include the effects of instrumental errors. We propose an alternative technique called Bayesian Inference for Radio Observations (BIRO) which uses a Bayesian statistical framework to determine the scientific parameters and instrumental errors simultaneously directly from the raw data, without making an image. We use a simple simulation of Westerbork Synthesis Radio Telescope data including pointing errors and beam parameters as instrumental effects, to demonstrate the use of BIRO. Keywords. methods: statistical, methods: data analysis, techniques: interferometric
1. Introduction The problem of extracting scientific parameters from dirty (dominated by artifacts) interferometric radio images has resulted in many deconvolution algorithms being developed. However, none of these solve the problem of incorporating instrumental errors as a source of uncertainty when making measurements from radio data. Deconvolution algorithms can only produce one image, which the scientist must then assume is correct before extracting any science (for example, a catalogue of source fluxes) from it. Algorithms such as CLEAN (H¨ ogbom 1974), the most popular algorithm in use, cannot reliably produce any uncertainties (Junklewitz et al. 2013), making it impossible to propagate the uncertainties from instrumental errors to the scientific parameters. Further, if these parameters are correlated, as they likely are, even correcting the data for 1
2 M. Lochner, B. Bassett, M. Kunz, I. Natarajan, N. Oozeer, O. Smirnov & J. Zwart instrumental errors may lead to biased scientific results, as the measurement of the instrumental error may be wrong. These instrumental effects will become more important as more sensitive telescopes such as the Square Kilometre Array† come online.
2. BIRO We propose in Lochner et al. 2015, a completely different approach, whereby we model the sky and all known sources of instrumental error simultaneously using the radio interferometry measurement equation (RIME) (Hamaker 1996). The RIME can be written as (Smirnov 2011): H H Vpq = J pn (. . . (J p2 (J p1 BJ H q1 )J q2 ) . . .)J qm ,
(2.1)
where Vpq is the visibility matrix (the radio data), J pi is the i’th Jones matrix for antenna p (containing instrumental effects) and B is the brightness matrix (containing the sky model, and hence all scientific parameters). We use the software package MeqTrees (Noordam & Smirnov 2010), which implements the RIME, to model our radio field and any known instrumental effects. We can then estimate the parameters of this model, both scientific and instrumental, in a Bayesian context using a sampling method such as MCMC (Metropolis et al. 1953, Hastings 1970). We assume uncorrelated Gaussian noise on the visibilities which leads to a simple Gaussian likelihood for Vpq . With this approach, we are able to determine the full posterior for the problem, obtaining not only the best fits for all parameters, but also their uncertainties and correlations.
3. Applying BIRO
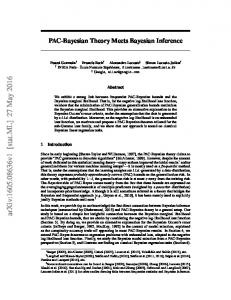
Figure 1. Mock dataset. Left panel: The simulated sky model. Right panel: The “dirty image”, which is how this field appears when convolved with the telescope beam.
Figure 1 shows the mock WSRT‡ field which we tested BIRO on. This field, simulated using MeqTrees and based on a real field, consists of 17 point sources. We also applied pointing errors to each antenna as an example of a source of instrumental error, which WSRT (and many other radio telescopes) have had to deal with in the past (Smirnov & de Bruyn 2011). A mispointed antenna will observe a point source through the edge rather than the centre of its beam. Thus, in general, we would expect pointing † Square Kilometre Array, http://www.skatelescope.org ‡ Westerbork Synthesis Radio Telescope, https://www.astron.nl/radio-observatory/astronomers/wsrt-astronomers
Bayesian Inference for Radio Observations
3
errors and fluxes to be correlated and we apply our method to determine these correlations, as well as the parameters themselves. The instrumental parameters for this simulated data consist of the pointing errors, the width of the primary beam and the noise on the visibilities, which we assume to be Gaussian, as is widely considered a good approximation. We allow the pointing errors to vary in time as second ordr polynomial functions, resulting in 84 pointing error parameters, 3 parameters for each direction for each antenna. Our scientific parameters include the flux for each source, and the shape parameters of the extended Gaussian source. We compared BIRO with the standard, commonly used CLEAN algorithm combined with a source extraction algorithm on the CLEANed image (we call this CLEAN+SE) for this dataset. Figure 2 illustrates this comparison for the estimated fluxes from BIRO and CLEAN+SE. With no knowledge of the pointing errors, it is no surprise that CLEAN+SE returns biased fluxes and fails to find several sources. The danger is that the error bars, estimated using only the surrounding flux of the point source in this source extraction algorithm, do not and cannot take into account the additional source of uncertainty from the instrumental errors. In contrast, the BIRO estimates are unbiased and the error bars are larger, correctly propagating the instrumental errors, and determining the correlations between parameters (Figure 3).
Figure 2. Comparison between BIRO and the fluxes obtained from CLEAN, combined with a source extraction algorithm to the data (CLEAN+SE). While the BIRO results are unbiased, CLEAN+SE misestimates the fluxes by up to 44σ, due to the strong correlations between pointing error and flux.
4. Conclusions We have introduced BIRO, a Bayesian approach to the deconvolution problem of radio interferometry observations. Figure 3 highlights the importance of fully propagating the uncertainty on instrumental errors, as they can be highly correlated with the scientific parameters and hence bias scientific results. Due to the fully Bayesian nature of BIRO, it allows for very elegant extensions to this simple scenario. For example, the choice of model for the field can be selected for using the Bayesian evidence (see Lochner et al. 2015).
4 M. Lochner, B. Bassett, M. Kunz, I. Natarajan, N. Oozeer, O. Smirnov & J. Zwart
Figure 3. Covariance matrix between a subset of parameters. The parameters are listed on each axis with the correlations between them represented by a coloured ellipse. Highly correlated parameters are red with a thin ellipse angled to the right, whereas anti-correlated parameters have a dark blue ellipse, angled to the left. The diagonal shows the 1D marginalised posterior for each parameter. The correlations in the fluxes arise due to uncertainty in the flux distribution from gaps in the uv-plane, while the pointing errors are correlated simply because every pointing error affects every source. Of particular interest is the complex way in which pointing errors correlate with the fluxes, which would be very difficult to determine from first principles.
BIRO can be useful in any scenario where reliable statistics are required for the science extracted and may be essential to fully exploit the sensitivity of the SKA. References H¨ ogbom, J. A. 1974, A&AS, 15, 417 Junklewitz, H. and Bell, M. R. and Selig, M. and Enßlin, T. A. 2013, ArXiv:1311.5282 Lochner, M. et al. 2015, MNRAS, 450, 1308 Hamaker, J. P. and Bregman, J. D. and Sault, R. J. 1996, A&AS, 117, 137-147 Noordam, J. E. and Smirnov, O. M. 2010, A&A, 524, A61 Smirnov, O. M. 2011, A&A, 527, A106 N. Metropolis et al. 1953, J. Chem. Phys., 21, 1087 W. K. Hastings 1970, Biometrika, 57, 97-109 Smirnov, O. M. and de Bruyn, A. G. 2011 ArXiv:1110.2916
5. Acknowlegdements ML and JZ are grateful to the South Africa National Research Foundation Square Kilometre Array Project for financial support. ML acknowledges support from the University of Cape Town and resources from the African Institute for Mathematical Sciences. OS is supported by the South African Research Chairs Initiative of the Department of Science and Technology and National Research Foundation. IN acknowledges the MeerKAT HPC for Radio Astronomy Programme. Part of the computations were performed using facilities provided by the University of Cape Town’s ICTS High Performance Computing team: http://hpc.uct.ac.za.