International Journal of Steel Structures 15(2): 473-485 (2015) DOI 10.1007/s13296-015-6016-3
www.springer.com/journal/13296
Bayesian Probabilistic Approach for Model Updating and Damage Detection for a Large Truss Bridge Samim Mustafa, N. Debnath, and Anjan Dutta* Department of Civil Engineering, Indian Institute of Technology Guwahati, Assam, 781039, India
Abstract A Bayesian probabilistic methodology is presented for structural model updating using incomplete measured modal data which also takes into account different types of errors such as modelling errors due to the approximation of actual complex structure, uncertainties introduced by variation in material and geometric properties, measurement errors due to the noises in the signal and the data processing. The present work uses Linear Optimization Problems (LOP) to compute the probability that continually updated the model parameters. A real life rail-cum-roadway long steel truss bridge (Saraighat bridge) is considered in the present study, where identified modal data are available from measured acceleration responses due to ambient vibration. The main contributions of this paper are: (1) the introduction of sufficient number of model parameters at the element property level in order to capture any variations in the sectional properties; (2) the development of an accurate baseline model by utilizing limited sensor data; (3) the implementation of a probabilistic damage detection approach that utilizes updated model parameters from the undamaged state and possibly damaged state of the structure. Keywords: model updating, system identification, modal data, bayesian probabilistic approach, linear optimization problems, damage detection
1. Introduction Identification of the mathematical model for a structure using experimental test data has received much attention over the years because of its importance in structural model updating, structural control and health monitoring (Mottershead and Friswell, 1993; Friswell and Mottershead, 1995; Marwala, 2010). Finite element (FE) models are widely used to predict the dynamic characteristics of various engineering structures. The simplification of reallife structures with numerical models often yields different results compared to measured data. As a way to improve FE models, model updating procedure has been introduced and widely used to correct analytical FE models by using experimental test data. These test data can consist of either structural response in the time or frequency domain or modal data. In this paper, modal data are used to update the FE model as it contains large amount of information in it which are proved to be sensitive for
Received September 2, 2014; accepted April 1, 2015; published online June 30, 2015 © KSSC and Springer 2015 *Corresponding author Tel: +91-361-258-2405, Fax: +91-361-269-2440 E-mail:
[email protected]
localized damage and the existence of well-established test procedures that can be used for modal identification (Feng et al., 1998; Ewins, 2000). For large structures such as bridges, offshore structures, wind turbines etc. which are subjected to ambient vibration, it would be very difficult and sometimes impossible to measure the actual excitation. Therefore, the system identification or damage detection is preferably to be done with the response-only measurement. Structural dynamic responses such as accelerations are the most commonly used measurements, in part due to the hypothesis that damage changes the physical properties of a structure, which in turn will cause changes to the dynamic characteristics of the structure. However, such data obtained from the field are restricted due to the availability of limited number of sensors in case of largescale structures and the fact that only a few of the lower modes of a structure can be identified with confidence. Most of the early model updating methods requires complete set of measured data to update the analytical model. The system matrices are either reduced to the observed degrees of freedom (DOF) or the measured incomplete mode shapes are expanded to the full FEmodel DOFs (Baruch, 1982; Caesar, 1987; Berman, 2000; Chen, 2006; Carvalho et al., 2006; Yang and Chen, 2009). These early methods are direct and computationally efficient though the physical meaning of the updated system
474
Samim Mustafa et al. / International Journal of Steel Structures, 15(2), 473-485, 2015
matrices are often not preserved which raises the question of their validity. The present work addresses this issue by presenting a Bayesian probabilistic method to update the full analytical model using incomplete measured modal data. Recent interest has been shown in using Bayesian probabilistic approaches for model updating as such approaches allow explicit treatment of the uncertainties involved (Katafygiotis and Yuen, 2001; Beck and Au, 2002; Yuen and Katafygiotis, 2002). Collin et al. (1974) published the first work in this domain making use of the identified modal parameters for structural model updating. A more rigorous and comprehensive Bayesian framework for model updating is described by Beck and Katafygiotis (1998) and Katafygiotis and Beck (1998). However, most of the Bayesian based model updating methods that have been proposed to this date use simulation based techniques such as Markov Chain Monte Carlo (MCMC) (Metropolis et al., 1953), Transitional MCMC (Ching and Chen, 2007), evolutionary MCMC and Delayed Rejection Adaptive Metropolis (Haario et al., 2006) to compute the posterior statistics of unknown model parameters. The main disadvantages of using MCMC algorithm is its high computational cost, especially when applied to largescale FE models since each sample requires a full computation of the latter. MCMC methods also needs to solve eigenvalue problems corresponding to structural model for each iteration which slows down the process and the success of MCMC methods is highly dependent on the proper choice of proposal distribution. In this paper, an efficient iterative algorithm is used to get the posterior statistics of unknown model parameters that involved a series of coupled linear optimization problems (LOP), instead of directly solving the challenging nonlinear optimization problem by some general algorithm that may give convergence difficulties in the high-dimensional parameter space. The method does not require solving the eigenvalue problem of any dynamical model; instead, the eigen equations appear in the prior probability distribution to provide soft constraints. These advantages make it highly applicable to model updating for a large complex structure using incomplete measured modal data. Furthermore, it does not require matching measured modes with corresponding modes from the dynamical model, which is in contrast to many existing methods. In the past decade, considerable research has been conducted to develop local and global damage detection methods for performing structural health monitoring (SHM). An extensive review of those can be found in (Doebling, 1996). The existing damage detection methods can be grouped into two categories: model based (parametric) and non-model based (non-parametric). The model-based methods basically detect damage by comparing structural models identified using sets of modal parameters from an undamaged structure and a possibly damaged structure (Salawu, 1997; Sohn et al., 2003; Vanik et al., 2000;
Goller et al., 2012), whereas non-model based approaches detect damage by comparing direct measurements from a structure under two different states (Nakamura et al., 1998; Masri et al., 1996). In this study, the Bayesian probabilistic framework based on identified modal data utilizing measured acceleration response of a large steel truss bridge due to ambient vibration is considered. The uncertainties associated with measurement and modelling errors are taken into consideration in the formulation. Linear optimization problem is used to update the model parameters. The paper further pursues a probabilistic approach for parametric damage detection by using updated model parameters from undamaged and possibly damaged structures. An adequate number of model parameters have been introduced corresponding to sectional properties (e.g., cross-sectional area, moment of inertias and polar moment of area) of each element in order to incorporate any variation in those properties due to local damage.
2. Bayesian Probabilistic Approach From the Bayesian perspective, there are two types of quantities: known and unknown. The goal is to use the known quantities along with a specified parametric expression to make inferential statements about the unknown quantities. The definition of such unknown quantities is very general; it can be any missing data or unknown parameters. If D denotes the observed data from the tested structure and θ be model parameters to be updated, the posterior or updated probability of the model parameters can be expressed by Bayes’ theorem: p ( D θ, C )p ( θ C ) p ( θ D, C ) = ----------------------------------------p( D C)
(1)
where p ( θ D ) is the posterior probability density function (PDF) of the model parameters given the observed data D and the model class C; p ( θ C ) is the prior PDF of the updating parameters; p ( D θ, C ) is the likelihood function; and p ( D C ) is the normalizing constant, and so it does not affect the shape of the posterior distribution; it only ensures that the posterior PDF integrates to one as required by the definition of a probability function.
3. Formulation Considering a Nd DOFs linear model of structural dynamic for the identification purposes, the stiffness N ×N matrix K ∈ R d d can be parameterized in the following way (Vanik, et al., 2000) Nθ
K ( θ ) = K 0 + ∑ θ i Ki i=1
(2)
Bayesian Probabilistic Approach for Model Updating and Damage Detection for a Large Truss Bridge
where Ki is the constant matrix independent of θ which can be obtained from FE-model of the structure; K0 represents the sub-structure contribution to global stiffness matrix from those elements where no parameterization is considered and the stiffness parameters θi, i =1, 2, ..., Nθ, will need to be updated in every iteration based on observed data from tested structure.. The expression for K0 and Ki can be given by:
which is independent of the uncertain model parameters and the modal measure of fit is given by T
ˆ –1 Jm ( θ ) = λ – λ Σε λ – λ ˆ ψ – Γφ ψ – Γφ
(3)
i=1
The mass matrix could be parameterized using a similar sub-structuring approach, but it is assumed here that the mass is known with sufficient accuracy from structural drawings and engineering judgment so that θ denotes only stiffness-related parameters.
T –1 1 1 fX = ------------------------- exp ⎛ – --- ( X – µ ) ΣX ( X – µ )⎞ ⎝ ⎠ k 2 ( 2π ) Σ X
λˆ – λ in the above equation ˆ – Γφ ψ and assuming mean µ to be zero, one can easily obtain Eqs. (5) and (6).
3.2. Formulation of prior PDF In the prior PDF, the eigen equations of the dynamical model are considered to provide soft constraints and a Gaussian PDF is chosen for the eigen equation errors. Hence, the prior PDF can be written as
No
ˆ m ∈ R . To construct the likelihood function, the ψ measurement error ε is introduced: (4)
p ( λ, φ θ, C ) = c2 exp – 1 --- Jg( λ, φ ;θ ) 2
which is the difference between measured modal data and the data obtained from the analytical model. A multivariate N ( No + 1 ) Gaussian probability model is chosen for ε ∈ R m with zero mean and covariance matrix Σε. Hence, the likelihood function can be written as p ( D θ, C ) = p ( λˆ , ψˆ λ, φ ) = c1 exp – 1--- Jm ( θ ) 2 N (N + 1) where c1 = ⎛ ( 2π ) m o Σε ⎞ ⎝ ⎠
(1)
(2)
(2)
( Nm )
M )φ
N
(5)
is a normalizing constant,
(1)
( K ( θ ) – λ M )φ (K(θ ) – λ
(m)
(8)
where λ(m) and φ ∈ R d , m=1, 2, ..., Nm are the system eigenvalues and the corresponding eigenvectors. It is obvious that these modal parameters will not satisfy exactly the eigenvalue problem of any given dynamical model (K(θ), M) because of the underlying uncertainties of measurement and modelling errors. The function Jg ( λ, φ ;θ ) is called the goodness-of-fit function which is given by
–1
( K ( θ ) – λ M )φ Jg ( λ, φ ;θ ) =
(7)
Replacing ‘X’ by ε =
3.1. Formulation of likelihood function Likelihood function is constructed to measure the discrepancy between the tested data and the corresponding structural model output (Yuen et al., 2006; Yuen, 2010). Let the experimental test data consist of a set of Nm eigenvalues, λm and Nm generally incomplete eigenvectors,
λ λˆ = +ε ˆ Γφ ψ
(6)
where λ and φ are the eigenvalues and the corresponding eigenvectors of the analytical model respectively and Γ is the NmNo×NmNd observation matrix of ‘1s’ or ‘0s’ that picks observed DOFs from the full model mode shapes φ. For a random variable X={X1, X2, ..., Xk} with mean µ and covariance matrix ΣX , the multivariate normal distribution can be expressed as
Nθ
∂K Ki = ------- and K0 = K ( θ ) – ∑ θi Ki ∂θ i
475
T
–1
Σ eq ( Nm )
(1)
(1)
(2)
(2)
( K ( θ ) – λ M )φ ( K ( θ ) – λ M )φ ( K(θ ) – λ
( Nm )
M )φ
where Σeq is the prior covariance matrix which controls the size of the equation errors. It is assumed that the uncertainties in the equation errors for each mode are independent and identically distributed. Hence
(9) ( Nm)
2
Σeq = σeq INdNm
(10)
where INd Nm denotes the NdNm×NdNm identity matrix and σeq2 is a prescribed equation-error variance. This equation-
476
Samim Mustafa et al. / International Journal of Steel Structures, 15(2), 473-485, 2015
error variance can be used for explicit treatment of the modelling errors. When the system modal frequencies and mode shapes correspond closely to the modal parameters of the identified dynamical model, the value of σeq2 is chosen to be very small. On the other hand, this value could be increased if the measured modal parameters did not agree well with those corresponding to the identified dynamical model. This additional modelling flexibility is an appealing feature of this method. The prior PDF for all the unknown parameters is given by p ( λ, φ, θ C ) = p ( λ, φ θ, C )p ( θ C )
(11)
where p ( θ C ) is the prior PDF of the model parameters θ. The probability model for this PDF is also chosen to be a Gaussian distributed with mean θ η representing the nominal values of the model parameters and with covariance matrix Σθ.
3.3. Final form of posterior PDF The final form of the posterior PDF for the model parameters can be obtained by substituting the expressions for prior PDF and likelihood function in Eq. (1) and is given as (12)
where c is a normalizing constant and the objective function, J ( λ, φ, θ ) is η T –1 η J ( λ, φ, θ ) = 1 --- ( θ – θ ) Σθ ( θ – θ ) 2 T
Nm
For the large-scale structures, the numbers of measured DOFs will be very low compared to the total structural DOFs due to the availability of limited numbers of sensor. Hence, the measured mode shape vectors will have incomplete components. Therefore, the sequence of optimization starts from computing the missing components of the mode shapes. As the likelihood function is formed by direct correlating measured components of mode shapes with the corresponding components of mode shapes from ˆ need FE-model, the incomplete set of measured DOFs ψ to be scaled with a factor in order to make the measured mode shapes close to the corresponding part of the analytical mode shapes Γφ as ˆi ψ˜ i = βi ψ
(14)
in which mode scale factor βi is defined as T Tˆ φ Γ ψ -i βi = ---------------ˆ iT ψi ψ
(15)
For the initialization of the iterative process, first set the updated model parameters at their nominal values: θ*=θ η
ˆ , C ) = cexp – 1--- J ( λ, φ, θ ) p ( λ, φ, θ λˆ , ψ 2
(m) (m) 2 1 1 ( K ( θ ) – λ M )φ + --+ ---------2 ∑ 2 2σeq m = 1
4. Linear Optimization Problems
λˆ – λ Σ–1 λ – λ ε ˆ – Γφ ψ – Γφ ψ (13)
where ||.|| denotes the Euclidean norm. The most probable values of the model parameters can be obtained by minimizing the above objective function instead of maximizing the posterior PDF.
(16)
and the updated eigenvalues at their measured values: λ*=λ η
(17)
Then, the objective function as given in Eq. (13) is minimized with respect to φ, λ, and θ respectively until the prescribed convergence criterion is satisfied. The detailed procedure for linear optimization involving three coupled linear optimization problems are given in Yuen et al., 2006. However, for the sake of completeness, the three coupled linear optimization problems are mentioned below in brief.
4.1. Optimization for mode shapes By minimizing the objective function J ( λ, φ, θ ) in Eq. (13) with respect to φ, the optimal vector φ* can be obtained
–1 T –2 –1 –1 –1 T ˜] φ∗ = [ σeq Gφ + Γ ( Σ ε )22 Γ ] Γ [ ( Σε )21 ( λˆ – λ∗ ) + ( Σε )22 ψ –1
–1
(18) –1
where ( Σ ε )21 and ( Σ ε )22 are the NmNo×Nm left bottom and NmNo×NmNo right bottom sub-matrices of Σ ε , and the symmetric matrix Gφ is given by 2 (1) ( λ ∗ M – K∗ )
0 (2) ( λ ∗ M – K∗ )
Gφ = 0
2
(19) (λ
( N m )∗
M – K∗ )
2 Nd Nm × N d N m
Bayesian Probabilistic Approach for Model Updating and Damage Detection for a Large Truss Bridge
where the updated stiffness matrix K∗ = K ( θ∗ ) . Optimization for modal frequencies By minimizing the objective function J ( λ, φ, θ ) in Eq.
(13) with respect to λ, the updated parameter vector λ* is given by
( 1 )*T * ( 1 )* ⎛ ⎞ φ MK φ ⎜ ⎟ ( 2 )*T * ( 2 )* –1 ⎜ – 2 φ MK φ –1 –1 –1 * ⎟ ˆ ˜ ∗ + ( Σ ε )11 λ + ( Σ ε )12 ( ψ – Γφ )⎟ λ = [ Gλ + ( Σε )11 ] ⎜ σeq ⎜ ⎟ ⎜ ⎟ ( Nm)*T ( N )* * m ⎝ ⎠ φ MK φ –1
–1
477
(20)
–1
where ( Σ ε )11 and ( Σ ε )12 are the Nm×Nm left top and Nm×NmNo right top sub-matrices of Σε , and the matrix Gλ is given by
Gλ =
–2 σeq
φ
( 1 )*T
* ( 1 )*
Mφ
0 φ
( 2 )*T
2 ( 2 )*
(21)
Mφ
φ
0
( Nm )*T
2 ( Nm)*
Mφ
N m × Nm
Optimization for model parameters By minimizing the objective function J ( λ, φ, θ ) in Eq. (13) with respect to θ, the updated model parameter vector θ* is given by –2
–1 –1
–2
–1 η
θ∗ = ( σeq Gθ Gθ + Σ q ) ( σeq Gθ b + Σ q θ ) T
T
(22)
where the matrix Gθ is given by K1 φ
( 1 )*
K2 φ
( 1 )*
… K Nθ φ
( 1 )*
Gθ = K1 φ
( 2 )*
K2 φ
( 2 )*
… K Nθ φ
( 2 )*
K1φ
( Nm )*
K2 φ
( Nm )*
and the vector b ∈ R
… K Nθ φ
Nm N m
(23)
( Nm)*
is given by
(1) (1) ( λ ∗ M – K0 )φ ∗
b=
(2) (2) ( λ ∗ M – K0 )φ ∗
(λ
( N m )∗
M – K0 )φ
( N m )∗
(24)
sample structure in this present study. The bridge is a lifeline structure for the North-East India, located in the highest seismic zone of India and is for 50 years in function with no modification. The Bridge consists of ten main and two approach spans and all the spans are simply supported. The length of each of the main spans and approach spans are 118.72 and 31.4 m respectively. A photographic view of the Saraighat Bridge is shown in Fig. 1. This rail-cum-road bridge transfers rail and road traffic loads at lower and upper deck level respectively. Geometry as well as sectional properties of the bridge elements in each span are similar and hence, one main span is considered for modal identification in this study. Finite element model for nonlinear analysis is carried out in SAP2000 (CSI, 2009). Analysed main span is shown in Fig. 2, where the details of truss configuration can be seen. The details of truss configuration may be seen in Fig. 2. The superstructure is simply supported on pier cap and hence the ends of the bridge are having pin and roller supports. The truss bridge structure has been modelled using 3D frame and truss elements, joint springs, link elements etc. The employed numerical model is a 1700
Nd Nm × 1
5. Illustrative Examples A large rail-cum-road double-deck multi-span steel truss bridge is considered in this study. The efficacy of Bayesian probabilistic methodology for model updating as well as damage identification of such a large bridge is demonstrated.
5.1. Test structure description A bridge, popularly known as Saraighat Bridge is the
Figure 1. Panoramic view of Saraighat Bridge.
478
Samim Mustafa et al. / International Journal of Steel Structures, 15(2), 473-485, 2015
Figure 3. Kinemetrics EpiSensor accelerometers. (a) uniaxial (Kinemetrics Inc., 2008a) (b) tri-axial (Kinemetrics Inc., 2008b) Figure 2. Finite element model of a typical main span of Saraighat Bridge.
DOF FE-model consisting of 593 frame/truss elements and 128 links. The link elements used, act as a diagonal bracing at road level plane to model the in-plane rigidity for the existing road slab. Lumped mass model is considered for the dynamical analysis of the bridge and inertia corresponding to rotational DOF is considered as zero. The lumped mass matrix is considered to reduce the computational cost as well as computer storage space requirement to carry out dynamic analysis of the bridge without compromising the accuracy of analysis. The use of lumped mass matrix is one of the important features making the explicit finite element method efficient and practical (Wu, 2006). The translational nodal masses are same as that of a bar, while evaluation of diagonally lumped rotational mass matrix is trickier. There is no consensus on rotational masses. It is observed that translational end node masses grossly overestimate the angular momentum of the element. Hence adding any
rotational lumped mass only makes things worse. Thus, the standard practice is to set the rotational lumped masses as zero.
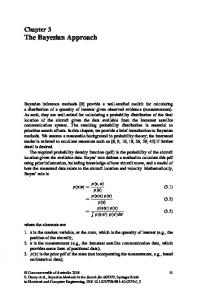
5.2. Measurements Ambient vibration data were recorded with the help of accelerometers. Thirteen numbers of uniaxial accelerometer (model ES-U2) (Kinemetrics, 2008a) and four numbers of tri-axial accelerometer (model FBA ES-T) (Kinemetrics, 2008b) were used for recording acceleration response data simultaneously at twenty-eight output DOF locations. Different types of accelerometers used in the experiment are shown in Fig. 3. The response data were measured at rail level of the bridge. The layout of the accelerometers along the rail-level deck of the bridge is shown in Fig. 4 (Debnath et al., 2012). 5.3. Parameterization of stiffness matrix Damage mainly results in reduction thickness of some of the part of the structural members which cause changes
Figure 4. The location of accelerometers at rail level of the bridge.
479
Bayesian Probabilistic Approach for Model Updating and Damage Detection for a Large Truss Bridge
in cross-sectional area, moment of inertia and in polar moment of area. Finally, the modification of sectional properties will also cause changes in the stiffness of that member, which is ultimately reflected in the variation of the modal parameters. As six degrees of freedom are considered at each nodal point, the resulting element stiffness matrices will be of dimension 12×12. Hence, in order to capture the variations in the stiffness, four stiffness parameters per frame-element are considered for the parameterization of the stiffness matrix to give 2372 stiffness parameters θ4(l −1)+1=Kl,ax, θ4(l −1)+2=Kl,bz, θ4(l −1)+3= Kl,by, θ4(l −1)+4=Kl,tr, l =1, 2, ..., 593 where the index l represents the frame number and ‘ax’, ‘bz’, ‘by’, ‘tr’ represent the axial component, the bending component about z-axis, the bending component about y-axis and the torsional component of the element stiffness matrix respectively. Further, for 128 links, one stiffness parameter is considered per link giving a total 2500 stiffness parameters. The global stiffness matrix for the lth element is given by Kg,l =TTKeT
(25)
where T is the block diagonal transformation matrix for the three-dimensional frame element. The stiffness matrix for the 1700-DOF bridge model is assembled from those of the element stiffness matrices using appropriate DOFs. In this case, the relationship between the stiffness matrix and the stiffness parameters can be written as K ( θ ) = K0 +
2500
∑ θi Ki
(26)
i=1
where the stiffness parameters θi, i =1, 2, ..., 2,500, will need to be updated in every iteration and the matrices Ki are the constant matrices and they are the substructure contribution to the global stiffness matrix. Four stiffness parameters for each frame element, l are considered as Al El E l Iz, l El Iy, l Gl Jl - , θ 3, l = ---------- , θ4, l = -------θ 1, l = --------, θ2, l = ---------3 3 Ll Ll Ll Ll
(27)
5.4. Model updating results In this subsection, the applicability of the adopted
approach using field data is illustrated. The field data considered in this study were obtained by measuring acceleration response from the bridge due to ambient vibration. The extraction of the modal properties from the time-domain measured data was performed by using different modal identification procedures like Natural excitation technique with eigensystem realization algorithm (Caicedo et al., 2004), Stochastic subspace identification (Van Overschee and De Moor, 1993) and Frequency spatial domain decomposition (Zhang et al., 2010). Further, identifications of modal parameters using the three mentioned techniques were done in terms of central tendency and dispersion based on multiple data sets. Identification of modal parameters using multiple techniques and in the form of central tendency ensures higher confidences against the effect of measurement noise as well as deviations of real ambient vibration from theoretical assumption of white-noise induced vibration as made in the adopted identification schemes. Modal identification is carried out based on a total of 55 different data-sets and the first 5 modes were identified with modal frequencies of 0.9031, 1.8594, 2.0613, 2.9558, 4.4009 Hz and partial mode shape vectors of 28 components. The identified modal frequencies are shown in the second column of Table 1 and referred to as target frequency. An optimal model class has been identified based on the large evidence with 1 and 0.5% coefficient of variations of the measurement error of the squared modal frequencies and mode shapes respectively for all modes. In order to study the effectiveness of the utilized LOP approach, the nominal values of element stiffness parameter are selected from a uniform distribution over 2 θ˜ to 3 θ˜ , where θ˜ is the actual stiffness parameters. Thus, the nominal values η θ are significantly overestimated and the variations between the different stiffness parameters are quite substantial. Table 1 shows the target, initial values as well as updated modal frequencies, modal assurance criteria (MAC) values and correlation coefficients of corresponding modes before and after updating. It can be seen that the frequencies of the updated model are very close to the actual ones and MAC values also got improved, validating the adopted algorithm. In Figs. 5-9 a comparison between the actual mode shapes (red lines) and the identified system mode shapes (blue lines) is shown for the first five measured modes. It can be observed that the two sets of curves are almost top of each other which also suggest
Table 1 Results of model updating for modal frequencies, MAC and correlation coefficients Experimental
Target
Preliminary
Identified
MAC
MAC
Order of Mode 1-1st Transverse 2-1st Vertical 3-2nd Transverse 4-1st Torsion 5-2nd Vertical
f (Hz) 0.9031 1.8594 2.0613 2.9558 4.4009
f (Hz) 1.4253 2.8991 3.0979 2.5194 8.9000
f (Hz) 0.9033 1.8594 2.0615 2.9618 4.4121
Initial 0.9832 0.9949 0.9715 0.9212 0.9706
Updated 0.9993 0.9997 0.9881 0.9994 0.9970
Correlation coefficient Initial -0.9876 0.9961 0.9864 0.9614 -0.9866
Updated 0.9981 0.9997 0.9896 0.9989 0.9969
480
Samim Mustafa et al. / International Journal of Steel Structures, 15(2), 473-485, 2015
Figure 5. Comparison of actual mode shapes and the identified system mode shapes for mode 1.
Figure 6. Comparison of actual mode shapes and the identified system mode shapes for mode 2.
that the adopted updating method is very much efficient in updating mode shapes though only a very few components of modes were measured. The profiles of correlation matrix before and after updating are shown in Fig. 10. The diagonal dominance of updated correlation matrix suggests that the measured mode shapes and the updated mode shapes are highly correlated. Figure 11 shows the iterative history for the most probable values of a few representative stiffness parameters, with convergence occurring in about 10 iterations. The model updating is performed using a work-station with dual quad core Intel® Xeon® 5.32 GHz processor and 12 GB of RAM under MATLAB® environment and the CPU time for 100 iterations is about 1945.17 min. Hence, large and complex
structures can be successfully updated by utilizing incomplete measured modal data with the methodology adopted. Therefore, the constraint of having limited number of sensors to perform model updating for a large size FE-model can be sorted out with the adaptation of the theory discussed in this paper.
5.5. Application to structural health monitoring The applicability of the adopted model updating method to perform SHM is presented in this section. As actual damage may not be possible to be introduced in the existing bridge, the numerical model is considered for the damage simulation. One vertical portal frame member (frame number 53) of the bridge model is assumed to be
Bayesian Probabilistic Approach for Model Updating and Damage Detection for a Large Truss Bridge
481
Figure 7. Comparison of actual mode shapes and the identified system mode shapes for mode 3.
Figure 8. Comparison of actual mode shapes and the identified system mode shapes for mode 4.
damaged as shown in Fig. 12. In order to introduce damage, the flange and web thicknesses of the outer four angles are reduced by 2.7 mm each from their original values which cause an approximate reduction of 8, 8.5, 9, and 36% in the cross-sectional area, moment of inertia about y and z axis and polar moment of inertia respectively. Modal parameter are then extracted from this damaged structure and a sample of zero-mean Gaussian noise with 1% coefficient of variation is added to the exact modal frequencies and modeshapes from the view point of realistic measurement. With all other values same as the undamaged case, the same iterative procedure is followed to update the preliminary model. The nominal stiffness values for this preliminary model are also selected from
the uniform distribution over 2 θ˜ to 3 θ˜ , where θ˜ is the actual stiffness parameters. The damage identification results for this affected vertical portal frame member are shown in Table 2. In order to determine damage, the most probable values of the stiffness parameters from the damaged and undamaged structure and their standard deviations are used to compute the probability that a given stiffness parameter θl has been reduced by a certain fraction d compared to the undamaged state of the structure (Vanik et al., 2000; Nakamura et al., 1998; Masri et al., 1996; Yuen et al., 2006; Yuen, 2010; Goller et al., 2012; Beck et al., 2001). An asymptotic Gaussian approximation (Papadimitriou et al., 1997) is used for the integrals
482
Samim Mustafa et al. / International Journal of Steel Structures, 15(2), 473-485, 2015
Figure 9. Comparison of actual mode shapes and the identified system mode shapes for mode 5.
Figure 10. Profiles of correlation matrix between measured and model modes (a) Before updating (b) After updating
involved to give dam
Pl
( d ) = P ( θl
pd
< ( 1 – d )θ l
ud
C)
∞
=
∫ P(θ
pd l
< ( 1 – d )θ l
ud
ud
θ l , C )p ( θl
ud
C ) dθ l
ud
–∞
*ud
*ud
( 1 – d )θ l – θl ≈ Φ ----------------------------------------------------------ud 2 pd 2 2 ( 1 – d ) ( σl ) + ( σl )
Figure 11. Iteration histories for a few representative stiffness parameters
(28)
where Φ(.) is the cumulative distribution function of the *ud *ud standard Gaussian random variable, θ l and θ l denote the most probable values of the stiffness parameters for the undamaged and (possibly) damaged structures respectively, ud pd and σl , σl are the corresponding standard deviations of the stiffness parameters.
483
Bayesian Probabilistic Approach for Model Updating and Damage Detection for a Large Truss Bridge
Figure 12. Section of vertical portal frame member for (a) undamaged, (b) damaged case. Table 2 Identification results for the damaged vertical portal member using five measured modes Parameter θ209 θ210 θ211 θ212
Target θ
Initial θ
Identified q
KN/m
KN/m
KN/m
Standard Deviation
2389023.25 4286.41 38638.10 102.18
6265153.96 11089.14 85302.98 235.14
2389023.25 4286.41 38639.60 102.07
8.33*10-08 6.41*10-06 8.63*10-04 6.38*10-07
Coefficient of Undamaged θ variation (KN/m) (COV) 3.48*10-14 1.49*10-09 2.23*10-08 6.25*10-09
2596000.00 4709.01 42220.18 159.57
Damage (%) 7.97 8.97 8.48 36.030
Figure 13. Probability of damage of axial stiffness parameters for all the elements.
Figure 14. Probability of damage of bending stiffness parameters about y-axis for all the elements.
The probabilities of damage for all the four stiffness parameters for 593 frame elements are shown in Figs. 1316 respectively. From these figures, it can be clearly seen that the frame number 53 has possible damage with a very high probability having an extent of damage of 8, 8.5, 9, and 36% in the cross-sectional area, moment of inertia about y and z axis and polar moment of inertia respectively. These plots suggest that the method is very sensitive as it has not only identified the damaged element; but also the extent of damage despite the introduction of minimal changes in geometrical properties of one of the members. The method has great potential to detect damage at the element property level without showing any false alarm despite having complexity of the analysed structure, which is a very appealing characteristic of this
method. The first mode being transverse, bending along transverse direction will be associated with maximum energy and hence the maximum effect will be on all the members bending in the transverse plane. Thus, it may be observed from Fig. 14 that the method shows relatively more extent of damage in all other undamaged members in regard to stiffness parameters about Y axis. Figure 17 shows the bar diagram (partly zoomed for better clarity) of the percentage change in the updated stiffness parameters between the undamaged and damaged structures. There are four lines corresponding to four damaged stiffness parameters considered for the frame element. The corresponding stiffness parameters for the frame element 53 are θ209, θ210, θ211, θ212. This figure also suggests that there is a substantial change in the stiffness
484
Samim Mustafa et al. / International Journal of Steel Structures, 15(2), 473-485, 2015
Figure 15. Probability of damage of bending stiffness parameters about z-axis for all the elements.
Figure 16. Probability of damage of torsional stiffness parameters for all the elements.
obtain a reliable baseline model. In this paper, both these issues are discussed and addressed scientifically by using Bayesian probabilistic approach for updating a large truss bridge. To get the most probable values of the model parameters, an efficient iterative algorithm is used that involves a series of coupled linear optimization problems. In the field study, the acceleration data were taken at twenty-eight output DOFs location only. It is found that the method is very much efficient in updating the model though with incomplete measured modal data which makes the adopted method a very deserving candidate for model updating of a large-scale structure with incomplete measured modal data. Further, the method successfully traces back to the correct parameter values even though the initial values are very far from the actual ones. Further, a methodology has been introduced to detect potential damage at the element property level as damage mainly cause changes in the sectional properties of the element. Four stiffness parameters per frame element are taken corresponding to the sectional properties for the parameterization of the stiffness matrix. In the illustrative example, it is found that the method successfully detects damage caused by the changes in the sectional properties. Additionally, the method does not show any false detection of damage despite having complexity in the structure.
References
Figure 17. Bar diagram of the percentage change in updated stiffness parameters between damaged and undamaged structure.
value in the concerned element compared to the other undamaged elements of the structure. For all other members that are undamaged, the difference between the mean stiffness parameter values of the undamaged and damaged structures is less than 1%, which is within the expected uncertainty level.
6. Conclusions The model updating of a large complex structure with incomplete measured modal data is an active area of research. The uncertainties associated with the measurement and the modeling errors should be taken into account to
Baruch, M. (1982). “Optimal correction of mass and stiffness matrices using measured modes.” Journal of American Institute of Aeronautics and Astronautics, 20(11), pp. 1623-1626. Beck, J. L. and Katafygiotis, L. S. (1998). “Updating models and their uncertainties. I: Bayesian statistical framework.” Journal of Engineering Mechanics, ASCE, 124(4), pp. 455-461. Beck, J. L., Au, S. K., and Vanik, M. W. (2001). “Monitoring structural health using a probabilistic measure.” Computer-Aided Civil and Infrastructure Engineering, 16(1), pp. 1-11. Beck, J. L. and Au, S. K. (2002). “Bayesian updating of structural models and reliability using Markov Chain Monte Carlo simulation.” Journal of Engineering Mechanics, ASCE, 128(4), pp. 380-391. Berman, A. (2000). “Inherently incomplete finite element model and its effects on model updating.” Journal of American Institute of Aeronautics and Astronautics, 38(11), pp. 2142-2146. Caesar, B. (1987). “Updating system matrices using modal testing data.” Proc. Fifth IMAC, pp. 453-459. Caicedo, J., Dyke, S., and Johnson, E. (2004). ”Natural excitation technique and eigensystem realization algorithm for phase I of the IASC-ASCE benchmark problem: simulated data.” Journal of Engineering Mechanics, 130(1), pp. 49-60. Carvalho, J., Datta, B. N., Lin, W., and Wang, C. (2006). “Symmetry preserving eigenvalue embedding in finite
Bayesian Probabilistic Approach for Model Updating and Damage Detection for a Large Truss Bridge
element model updating of vibration structures.” Journal of Sound and Vibration, 290, pp. 839-864. Chen, H. P. (2006). “Efficient methods for determining modal parameters of dynamic structures with large modifications.” Journal of Sound and Vibration, 298, pp. 462-470. Ching, J. and Chen, Y. C. (2007). “Transitional Markov Chain Monte Carlo method for Bayesian updating, model class selection, and model averaging.” Journal of Engineering Mechanics, 133, pp. 816-832. Collins, J. D., Hart, G. C., Hasselman, T. K., and Kennedy, B. (1974). “Statistical identification of structures.” Journal of American Institute of Aeronautics and Astronautics, 12 , pp. 185-190. CSI Computer & Structures Inc. (2009). Three dimentional static and dynamic finite element analysis and design of structures. SAP2000, Computer & Structures, Inc., Berkeley, CA. Debnath, N., Dutta, A., and Deb, S. K. (2012). “ Placement of sensors in operational modal analysis for truss bridges.” Mechanical Systems and Signal Processing, 31, pp. 196-216. Doebling, S. W., Farrar, C. R., Prime, M. B., and Shevitz, D.W. (1996). Damage identification and health monitoring of structural and mechanical systems from changes in their vibrations characteristics: A literature review. Technical Report LA-13070-MS, Los Alamos National Laboratory, Los Alamos, NM. Ewins, D. J. (2000). Modal testing: Theory, practice, and application, 2nd Ed., Research Studies, Baldock, UK. Feng, M. Q., Kim, J. M., and Xue, H. (1998). “Identification of a dynamic system using ambient vibration measurements.” Journal of Applied Mechanics, ASME, 65, pp. 10101021. Friswell, M. I. and Mottershead, J. E. (1995). Finite element model updating in structural dynamics. Kluwer Academic, Dordrecht, The Netherlands. Goller, B., Beck, J. L., and Schueller, G. I. (2012). “Evidence-based identification of weighting factors in Bayesian model updating using modal data.” Journal of Engineering Mechanics, 138, pp. 430-440. Haario, H., Laine, M., Mira, A., and Saksman, E. (2006). “DRAM: efficient adaptive MCMC.” Journal of Statistics and Computing, 16, pp. 339-354. Katafygiotis, L. S. and Beck, J. L. (1998). “Updating models and their uncertainties. II: Model identifiability.” Journal of Engineering Mechanics, ASCE, 124(4), pp. 463-467. Katafygiotis, L. S. and Yuen, K. V. (2001). “Bayesian spectral density approach for modal updating using ambient data.” Earthquake Engineering and Structural Dynamics, 30(8), pp. 1103-1123. Kinemetrics Inc. (2008a). “EpiSensor ES-U2, Uni-axial force balance accelerometers.” , retrieved April 2, 2015. Kinemetrics Inc. (2008b). “EpiSensor ES-T, Tri-axial force balance accelerometers.” , retrieved April 2, 2015. Marwala, T. (2010). Finite element model updating using computational intelligence techniques: applications to
485
structural dynamics. Springer. Masri, S. F., Nakamura. M., Chassiakos, A. G., and Caughey, T. K. (1996). “Neural network approach to the detection of changes in structural parameters.” Journal of Engineering Mechanics, 122(4), pp. 350-360. Metropolis, N., Rosenbluth, A. W., Rosenbluth, M. N., Teller, A. H., and Teller, E. (1953). “Equation of state calculations by fast computing machines.” Journal of Chemical Physics, 21, pp. 1087-1092. Mottershead, J. E. and Friswell, M. I. (1993). “Model updating in structural dynamics: A survey.” Journal of Sound and Vibration, 167, pp. 347-375. Nakamura, M., Masri, S. F., Chassiakos, A. G., and Caughey, T. K. (1998). “A method for non-parametric damage detection through the use of neural networks.” Earthquake Engineering and Structural Dynamics, 27(9), pp. 997-1010. Papadimitriou, C., Beck. J. L., and Katafygiotis, L. S. (1997). “Asymptotic expansions for reliability and moments of uncertain systems.” Journal of Engineering Mechanics, ASCE, 123(12), pp. 1219-1229. Salawu, O. S. (1997). “Detection of structural damage through changes in frequency: a review.” Engineering Structures, 19(9), pp. 718-723. Sohn, H., Farrar, C. R., Hemez, F. M, Shunk, D. D, Stinemates, D. W., and Nadler, B. R. (2003). A review of structural health monitoring literature: 1996-2001. Technical Report LA-13976-MS, Los Alamos National Laboratory, Los Alamos, NM. Vanik, M. W., Beck, J. L., and Au, S. K. (2000). “Bayesian probabilistic approach to structural health monitoring.” Journal of Engineering Mechanics, ASCE, 126(7), pp. 738-745. Van Overschee, P. and De Moor, B. (1993). “Subspace algorithm for the stochastic identification problem.” Automatica, 29(3), pp. 649-660. Wu, S. R. (2006). “Lumped mass matrix in explicit finite element method for transient dynamics of elasticity”. Journal of Computer Methods in Applied Mechanics and Engineering, 195(44), pp. 5983-5994. Yang, Y. B. and Chen, Y. J. (2009). “A new direct method for updating structural models based on measured modal data.” Journal of Engineering Structures, 31, pp. 32-42. Yuen, K. V. and Katafygiotis, L. S. (2002). “Bayesian modal updating using complete input and incomplete response noisy measurements.” Journal of Engineering Mechanics, ASCE, 128(3), pp. 340-350. Yuen, K. V., Beck, J. L., and Katafygiotis, L. S. (2006). “Efficient model updating and monitoring methodology using incomplete modal data without mode matching.” Journal of Structural Control and Health Monitoring, 13(1), pp. 91-107. Yuen, K. V. (2010). Bayesian methods for structural dynamics and civil engineering. John Wiley & Sons (Asia) Pte Ltd. Zhang, L., Wang, T., and Tamura, Y. (2010). “A frequencyspatial domain decomposition (FSDD) method for operational modal analysis.” Mechanical Systems and Signal Processing, 24(5), pp. 227-1239.