Network Access Control (NAC) technologies manage the access of devices to a network and .... Cisco Network Module for Integrated Services Routers offers an agentless solution ... behavior modeled by an AD can be used as a means to enhance and automate ..... Space/time trade-offs in hash coding with allowable errors.
Behavior-Based Network Access Control: A Proof-of-Concept Vanessa Frias-Martinez Salvatore J. Stolfo Angelos D. Keromytis Computer Science Department, Columbia University {vf2001, sal, angelos}@cs.columbia.edu
Abstract Current NAC technologies implement a pre-connect phase where the status of a device is checked against a set of policies before being granted access to a network, and a post-connect phase that examines whether the device complies with the policies that correspond to its role in the network. In order to enhance current NAC technologies, we propose a new architecture based on behaviors rather than roles or identity, where the policies are automatically learned and updated over time by the members of the network in order to adapt to behavioral changes of the devices. Behavior profiles may be presented as identity cards that can change over time. By incorporating an Anomaly Detector (AD) to the NAC server or to each of the hosts, their behavior profile is modeled and used to determine the type of behaviors that should be accepted within the network. These models constitute behavior-based policies. In our enhanced NAC architecture, global decisions are made using a group voting process. Each host’s behavior profile is used to compute a partial decision for or against the acceptance of a new profile or traffic. The aggregation of these partial votes amounts to the model-group decision. This voting process makes the architecture more resilient to attacks. Even after accepting a certain percentage of malicious devices, the enhanced NAC is able to compute an adequate decision. We provide proof-of-concept experiments of our architecture using web traffic from our department network. Our results show that the model-group decision approach based on behavior profiles has a 99% detection rate of anomalous traffic with a false positive rate of only 0.005%. Furthermore, the architecture achieves short latencies for both the pre- and post-connect phases. Keywords. Network Access Control Technologies, Intrusion Detection Systems.
1 Introduction Network Access Control (NAC) technologies manage the access of devices to a network and mitigate against inside threats within a network. This is accomplished by implementing a two-tier strategy: the pre-connection and the post-connection phases. The pre-connection phase checks whether a device attempting to connect to a network complies with a set of policies. These policies typically include checking the status of the antivirus (AV) software in the device and whether or not the required patches for the OS are installed. If the device is not up-to-date, it is either quarantined or rejected from connecting to the network. The post-connection phase controls whether the policies (AV software, patches) are still being complied with by the network hosts. It may also include traffic monitoring meant to detect any anomalous traffic using Signature-based or Anomaly-based Detection Systems (AD). The current generation of NAC technologies rely on the use of fixed roles in the network. A list of roles is initially declared manually using a pre-determined set of characteristics. Devices are then provided with roles in the network that can only be changed manually. These roles are not only used to decide what devices are granted access to the network, but also to monitor what type of actions are allowed for each device. In reality, networks are very dynamic environments where devices may change roles or new roles may have to be created. Unfortunately, updating and defining new roles manually becomes very demanding and highly inefficient as time elapses. Ideally, we seek a solution that can define and update roles automatically without the inception of a human in the loop.
1
In this paper we introduce a new Behavior-Based Network Access Control architecture, BB-NAC, in which the behavior profiles of network hosts modeled by an AD are used to automatically compute and update behavior-based policies to enhance security. This new strategy enhances current NAC technologies by accounting for host behavior and its changes. The use of behavior profiles allows us to automatically conform to changes in behavior and update security policies without human intervention. In our proposed architecture, AD sensors are used to model the profile of the hosts in the network. Profiles are communicated by devices as a representation of their typical behavior. As behaviors change, updated models computed by the AD are captured as new behavior profiles. These behavior profiles can be used as a declaration of intent of behavior. In this manner, devices that drift from their profile are either under attack or have lied about their typical behavior. In terms of deployment, BB-NAC can be implemented either as an agent NAC architecture where the AD is installed directly on each of the hosts in the network, or alternatively as an agentless NAC architecture using a unique AD installed on the NAC server. Here a NAC server denotes a server that sits on the edge of the network and listens to incoming and outgoing traffic. In an agent NAC architecture, each host computes its behavior profile and communicates it to the NAC server. In an agentless NAC architecture, the NAC server itself models the individual behavior of each host in the network and stores its profile locally. By modeling each profile individually, rather than as a group, profiles of similar behavior can be clustered together and differentiated from other types of behavior. As an aside, we note that our architecture can be applied to networks without a central control like Mobile Ad-hoc Networks (MANETs) by eliminating the NAC server from the architecture. The latter is beyond the scope of this paper. In the following sections, we present a generalized description of the architecture that can be implemented either as an agent or as an agentless version with minor modifications. In terms of execution, the BB-NAC architecture performs pre-connection and post-connection checks based upon a group decision made by the NAC server using the profiles of the devices already in the network. During pre-connection, a device attempting to access the network presents its profile to the NAC server that conducts a voting process among the stored profiles of the hosts already in the network to reach an access control decision. During post-connection, the validity of the traffic exchanged is similarly voted by the profiles in the network. If the group decision is positive, the device is granted access to services. Otherwise, the device is either quarantined or rejected from accessing a service. Individual hosts do not participate actively in the voting process, but rather it is the NAC server that conducts the voting among the group of individual models (profiles) stored on the NAC server. Throughout the paper, we refer to decisions made in this manner as model-group decision. Such model-group decision process increases the survivability of the network by minimizing the influence of malicious profiles. As mentioned previously, profile clustering is introduced to attain a more fine-grained definition of network behavior. In this manner, only hosts in clusters with sufficient knowledge participate in the voting process. Below we summarize the main contributions of this paper: • A new technique to automatically learn and update access control policies using behavior. This approach enhances existing NAC technologies by providing, to the best of our knowledge, the first behavior-based network access control. • A novel access control model based on a model-group decision process. Individual host’s behavior profiles stored on the NAC server are used to compute partial decisions. The aggregation of these partial votes amounts to the model-group decision. • An architecture resilient to attacks. The access control model continues to work even after allowing a certain number of malicious devices into the network. • An implementation for agent or agentless NAC technologies. By installing an AD on the NAC server or on the hosts, the model-group decision process is conducted by the NAC server in similar fashion.
2
• An architecture that is independent of the type of AD sensor used: content ADs, volumetric ADs, or others. In Section 2 we describe related work. Section 3 introduces the BB-NAC architecture. Section 4 shows experimental results and latency analysis of our architecture. Finally, Section 5 covers conclusions and future work.
2 Related Work To the best of our knowledge, we are the first to introduce behavior model exchange as a security feature. Possibly the closest concept to our approach was developed by Necula and Lee [5], [4] and [6] in their Proof-Carrying Code (PCC). However, our approach differs in the fact that behavior can be automatically learned from observation, whereas proofs are specified by hand. Furthermore, our architecture proposes the exchange of behavior models instead of safety proofs. Cooperative Anomaly Detection Sensors have been explored in WORMINATOR [8], COSSACK [7] and CATS [3] where a distributed environment shares alerts to strengthen each individual local security capabilities. We implement the concept of cooperation in the model-group decision process by allowing each host to participate in the access control decision rather than just sharing alerts. A number of NAC technologies are currently available in the market. The Trusted Network Connect (TNC) is an initiative of the Trusted Computing Group that proposes a non-proprietary standard to enable the enforcement of security policies on endpoints. Cisco Network Module for Integrated Services Routers offers an agentless solution authenticating, authorizing and remediating devices connected wired or wirelessly to the network. The Cisco Profiler executes an in-depth control of the endpoint devices of the network by passively monitoring their traffic. The Network Access Protection (NAP) platform from Windows, provides a client and server-side platform ( Longhorn) to implement policy validation, network access limitation, automatic remediation and ongoing compliance. Compared to all other previous NAC technologies, our architecture uses behavior computed by an AD instead of roles (host posture) as a security feature.
3 The BB-NAC Architecture We start with the conjecture that behavior modeled by an AD can be used as a means to enhance and automate security enforcement in a NAC architecture. We assume that profiles or behavior models represent the typical behavior of a device. As opposed to roles, profiles can be automatically computed and updated by an AD as a device changes behavior over time. In our architecture, devices initially present their profiles to the NAC server prior to entering a network. Devices are also required to present a bad model that represents a collection of all previously seen bad attacks modeled using the same AD. The bad model measures the amount of knowledge the device has about known bad behaviors and might be considered a generalization of the set of rules or signatures used in a standard AV. BB-NAC then follows the two-tier strategy commonly used in NAC architectures except that the pre-connect and post-connect phases are both based on a model-group decision process conducted on the NAC server i.e., an alert is raised whenever a set of profiles agree on the access control decision being made. Furthermore, the access control policies in the NAC are computed and updated automatically as the ADs compute new models. The pre-connect phase checks whether a device entering the network has up-to-date malware knowledge. Devices that do not have sufficient malware knowledge are quarantined or rejected from entering the network altogether. On the other hand, the post-connect phase is responsible for a continuous check of the traffic exchanged by the hosts in the network. The two-tier strategy is applied on a per-port basis. In the case of multiple ports, the two-tier strategy is executed separately for each individual port. The device is accepted only when it is deemed normal for all ports. Next, we describe the pre- and post-connect phases in more detail.
3
1
Servers 2
4
NAC Server
3 5
Clients Port ‘x’
Network
M1
M2
M3
M5
M4
NAC Status
Figure 1: Basic setup of the BB-NAC architecture. The NAC server stores the behavior profiles and bad models of each host in the network. It also stores the cluster information. Here, Mi = {Pi , Bi }.
3.1 Pre-connect Phase The pre-connect phase is responsible for checking whether a device attempting to enter the network has sufficient malware knowledge. During this phase, a device presents its behavior profile as well as its bad model to the NAC server. If the device is coming from a different network, the profiles presented are the ones modeled by the AD during its previous interactions. Otherwise, if the device is brand new, we assume that it is equipped with a vanilla profile or that it is given one by the network administrator prior to starting its interaction. Next, the NAC checks whether the device’s bad profile contains sufficient malware information to be accepted to the network. This step is similar to conventional NAC approaches where the status of the AV is checked to determine whether it is up-to-date. However, in our solution the access control decision is based on the group knowledge of malware among the hosts already in the network. This is unlike current NAC architectures where the amount of malware knowledge required is manually set up as a policy. In order to attain a more accurate access control, only hosts with similar profiles to the one attempting to enter the network will be involved in the access control decision. The NAC server divides the devices into clusters representing different behaviors. These individual clusters are then responsible for the access control decision. If the device is accepted, the NAC server will add its profile to the corresponding cluster. For simplicity, in this paper we assume that the clusters of behavior are formed based on the declaration of nature provided by the device itself i.e., a device declares itself to be a client or a server. As a rule, it is required that a device of the same type already exists in the network. Obviously, it may be the case that a device lies about its true nature. However, if a device starts behaving anomalously, it will be detected in the post-connect phase. Figure 1 shows the basic setup of our architecture. As can be seen, for any given Port ’x’ there are two differentiated clusters: one for clients and one for servers. For each cluster, the NAC server stores both the profile and the bad model of its host members. We use Mi to denote the set of behavior profile (Pi ) and bad model (Bi ) for each host i i.e., Mi = {Pi , Bi }. The behavior-based access control policy is determined by whether or not the device’s knowledge of malware is considered sufficient by the members of the cluster of identical nature. In short, each of
4
the bad profiles in the cluster participates in a voting process to make an access control decision defined as: n X V =( vi )/n
(1)
k=1
vi = 1, if Bi ⊂ Bdevice vi = 0, if Bi ⊃ Bdevice
(2)
where n denotes the number of hosts that vote, where each vote vi equals 1 when the new device knows at least as many bad attacks as host i, and vi = 0 when the new device knows fewer attacks that host i. V represents the fraction of hosts in the cluster that consider the device’s bad model has sufficient malware knowledge. The driving principle behind this calculation is a quantitative measurement that can grant or deny entrance to the network based on the agreement of a certain percentage of network host profiles. It may be the case that a group of malicious profiles collude to manipulate the vote. However, our architecture can withstand such attacks as long as the number of malicious profiles in the network does not dilute the percentage of agreement required among host profiles. In Section 4, we describe the impact of possible attacks on our architecture. Figure 2 depicts the voting process. At Step 1, the NAC server listens to a new server attempting to connect to the network. This new server presents its profile and bad model to the NAC server. During Step 2, the NAC server conducts the voting process among bad models in the cluster to determine whether the malware knowledge is sufficient. Finally at Step 3, the accepted server is added to the cluster of servers and its profile and bad model are in the NAC server. In terms of deployment, the voting process is always conducted by the NAC server using the stored host profiles for both the agent and agentless versions of the architecture.
3.2 Post-connect Phase The post-connect phase performs a continuous check on the traffic being exchanged by the hosts in the network. The goal is to guarantee normalcy of behavior in the network. In our architecture, this is achieved by using the profiles of each individual host in the network that are stored in the NAC server. Armed with these profiles, BBNAC determines whether or not the traffic is considered anomalous using a model-group decision process. The post-connect phase makes use of the clusters computed in the pre-connect phase. Profiles of similar behavior are clustered together so that only profiles akin to the source or destination of the traffic participate in the decision of traffic normalcy. Our architecture conducts a voting process where each profile votes for or against the normalcy of the observed traffic. The voting process is defined as: n X V =( Pk,d (t))/n
(3)
k=1
where Pk,d represents the behavior profile of host k for direction d (ingress or egress) in a cluster with n hosts. Because the traffic can be analyzed either at a packet or flow level, t denotes the granularity (packet or flow) at which the traffic is tested against the AD profiles. The output of Pk,d (t) equals 1 if the traffic unit is considered normal by Pk,d and otherwise 0 if it is considered anomalous. V represents the fraction of hosts in the network that consider the traffic unit to be normal. In Section 4, we discuss the impact of malicious devices trying to manipulate the voting process. Another key ingredient of the post-connect phase is that the observed traffic is used to compute new behavior profiles for each of the hosts as time elapses. If the observed traffic is considered normal by the cluster, it is used to compute a new profile for the members involved in the exchange. On the other hand, if the traffic is deemed anomalous, it is used to update the bad models of the hosts in the cluster. These new computations automatically update the pre-connect and post-connect security policies. Issues concerning concept drift are addressed in Section 5
Bad models vote for new server profile
1
Servers
B1
2 4
¦
NAC Server B2
3
B4
Model (new server)
5
Accept/Reject
Clients
Network
(a) Step 1: New server presents its model to NAC server.
Servers
(b) Step 2: NAC server conducts the voting process.
1 2
4 6
NAC Server 3 5
Clients
Network Port ‘x’ M1
M2
M3
M5
M4
M6
NAC Status
(c) Step 3: New server is accepted and NAC status is updated.
Figure 2: Schematics of the Pre-connect Phase. 4.3. In terms of deployment of the agent version of the architecture, new profiles are computed by the hosts and communicated to the NAC server which stores them locally. In an agentless version, on the other hand, the NAC server itself computes the new profiles and stores them locally. In both versions, the voting process is always conducted by the NAC server among the profiles stored locally. Figure 3 depicts a possible scenario during the post-connect phase. In this setting, traffic is exchanged from host 1 to host 5 (Step 1). During Step 2, the NAC server implements two checks. First, it checks whether the output traffic of host 1 is considered normal by host 1 and all the other profiles in its cluster. Second, it checks whether the input to host 5 is considered normal by host 5 and all the other profiles in its cluster. In this instance, the second check reveals an attack. As presented, this two-layer check makes the architecture more resilient to insider threats. Next, in Step 3, the source is placed into quarantine to determine whether or not it is infected. Lastly in Step 4, the NAC server updates the malware knowledge of the bad models and updates the queue with the hosts in quarantine.
6
Profiles vote for traffic_unit Servers
P1
1
P2
traffic to 5
2
3
P3
traffic to 5
5
¦
Normal/Attack
¦
Normal/Attack
P4
4
Clients
NAC Server
P5
Network
(a) Step 1: Traffic is exchanged from host 1 to host 5.
(b) Step 2: NAC server conducts two voting processes. The cluster of servers votes on the output traffic of host 1 and the cluster of clients votes on the input traffic to host 5.
Bad Model Update
Servers 1 2 B2
+
BAD
B4
+
BAD
B3
+
BAD
B5
+
BAD
4
3
5
M1
NAC Server
QUARANTINED
Clients NAC Status
Network
(c) Step 3: Traffic is deemed anomalous and the sender is placed in quarantine.
(d) Step 4: The NAC status is updated with the detected attack. Sender is placed in the quarantine queue.
Figure 3: Schematics of the Post-connect phase.
4 Experiments and Evaluation of the Architecture For initial evaluation of our architecture, we collected web traffic from the Computer Science department network at Columbia University for a period of three weeks. We only considered IPs within the local network and divided them into two clusters: servers and clients. The nature of the machines is known from the collection of local IPs kept by the department. Since the pre- and post-connect phases are executed separately for each individual port, we chose port 80 to validate our architecture. Experiments for other ports would be executed in a similar fashion. For our proof-of-concept experiments, we modeled the profiles of all the webservers (a total of four) in the department using the anomaly detection sensor Anagram [11]. Anagram is a content anomaly sensor that models a mixture of n-grams to detect suspicious network packet payloads. The profile content models are saved as Bloom filters [1] which are space and privacy preserving data structures consisting of a vector of 0s and 1s. In general, Bloom filters suffer from false positives but not from false negatives. Furthermore, Bloom filters can be exchanged among devices and NAC servers minimizing the risk of privacy violation. Although we only used Anagram, it is important to note that our architecture is flexible enough to allow any AD to be used. In order to compute the profiles, we used between 370K and 700K clean training packets obtained from the first two weeks of the collected traffic. These profiles were trained until stability was reached i.e., the point in time when 7
the ratio of observed n-grams divided by the total number of n-grams was below a threshold. In addition, the bad models for each webserver were computed following the technique described by Wang et al. [11]. Each profile was trained with signature content from Snort rules [9] and with 600 virus samples collected from vxheavens [10]. In terms of actual deployment in a network, the BB-NAC architecture would have to be installed in a NAC server at the edge of the network. In addition, the NAC server would have to store the profiles and bad models of each of the webservers in the server cluster.
4.1 Evaluation of the Pre-connect phase In order to add artificial diversity to our network and create a more meaningful proof-of-concept experiment, we compute a bad model for each of the four webservers in such a way that each bad model contains 10% less malware knowledge than its previous model. Such computation is meant to simulate the behavior of users that have forgotten to update their AVs one or multiple times. Therein, server1’s bad model contains all the collection of Snort rules and virus samples, server2’s bad model contains 10% less than server1 randomly excluded from the collection, server3’s bad model contains 10% less than server2 randomly excluded from the collection, and server4’s bad model contains 10% less than server3 randomly excluded from the collection. While in a real network percentages may vary from server to server, a value of 10% was arbitrarily chosen for this proof-of-concept experiment to validate that the access control policy functions properly. In our setup, we assume that three out of the four webservers are members of the network and that the fourth device (self declared as a server) attempts to enter the network. This configuration allows us to evaluate three different scenarios: (i) Only one server agrees on the acceptance of the new server (one out of three, 33%), (ii) Two servers (66%) agree on the acceptance of the new server, and (iii) All three (100%) servers agree to accept the new server to the network. Given the fact that the bad models are represented as Bloom filters, each vote in the voting process is calculated as follows: vi = 1, if |Bi ∧ Bdevice | / |Bi | = 1 vi = 0, if |Bi ∧ Bdevice | / |Bi | < 1
(4)
where vi is the vote of server i, Bi is the bad model of server i, and Bdevice is the bad model of the device attempting to enter to the network. Here, ∧ represents the bitwise AND between two Bloom filters and || denotes the number of 1s of the resulting AND. Equation 4 calculates the fraction of 1s in common between a network host bad model and a new device bad model with respect to the number of ones in the network host’s bad model. In other words, the cardinality of the AND measures how different or similar two models are to each other. If the device’s bad model is equal to or it is a superset of server i bad model, its final vote is vi = 1. Otherwise, if the new device’s bad model is a subset of the server i bad model its final vote is vi = 0. The final group vote is represented by the percentage of devices that agree on the decision, as expressed in equation 1. In order to avoid attacks in which the new device presents a Bloom filter filled with all 1s as its bad model, or one computed with good and bad traffic meant to trick the vote in equation 4, the presented bad model is also checked against all normal profiles already in the network. If normal traffic is detected as part of the bad model, the device is rejected. This process is accomplished by calculating the AND cardinality of the presented bad model with each of the host profiles. Any cardinality above the false positive rate of the Bloom filter (which means that common n-grams exist) will reject the device. Table 1 shows the pre-connect results after conducting the voting process for the three different scenarios previously described. The top entry in each column represents the server attempting to get connected to the network. The remaining three servers represent the devices making the decision. For instance, in Column 2 we assume that the hosts already in the network are server1, server2 and server3 while server4 is attempting to enter the network. 8
Scenario (i) 33% (ii)66% (iii) 100%
server4 in REJ REJ REJ
server3 in ACC REJ REJ
server2 in ACC ACC REJ
server1 in ACC ACC ACC
Table 1: Voting process results for the Pre-connect phase. ACC denotes a device accepted to the network and REJ denotes a device rejected from entering to the network. In Column 3, server1, server2 and server4 are considered to be the network hosts and server3 is the one attempting to access the network. Similar reasonings apply to the remaining columns. As can be seen in Column 2, server4 is rejected in all cases since its bad model is the one with the least malware knowledge of all. When server3 attempts to enter the network, its malware knowledge is a superset of server4. Therefore, it is only accepted when one device needs to agree on the pre-connect decision. However, because server3 is only a subset of the bad models of server2 and server1, it is not accepted for higher rates of required agreement. Similar reasonings apply for server2 and server1. Note that different specific percentages in the voting process result in a more or less strict access control. More importantly, the results show that as long as the specific percentage of clean profiles is kept in the network, the voting process will be resilient to attacks by malicious devices that lied about its bad profile in order to manipulate access control. Future work will focus on applying control-theoretic concepts in a feed-back loop to provide an automated means of calibrating the sensitivity of the decision process. In case of failure, a network manager may fine tune the decision process to impose a predefined policy. Devices rejected during this phase are placed in quarantine where the device’s bad model is tested against a group of known attacks, so that a new reinforced bad model (Bloom filter) can be computed. The main advantage of having the malware knowledge in a model (Bloom filter), as opposed to having a list of signatures, is the fast processing time. AND-ing Bloom filters and calculating cardinalities is a much faster process that comparing signatures. Finally, we emphasize the importance of balancing the strictness of the access control with the latency of the system. Obviously, very demanding access control policies typically result in longer latencies due to quarantines. However, less demanding access control policies risk further attacks to the network.
4.2 Evaluation of the Post-connect phase We used the third week of collected traffic to test the post-connect phase in the BB-NAC architecture. For every incoming packet to any of the webservers, each server votes on the normalcy of the packet using its model or behavior profile. The evaluation of the post-connect phase is achieved by computing the false positive (FP) and detection rates (DR) of the voting process. In this context, FP represents the percentage of normal traffic falsely identified as anomalous by the group of network hosts, while DR denotes the percentage of bad traffic deemed as anomalous by the group of hosts. In order to measure the FP and DR of the voting process, we poisoned the collected traffic with the following known worms and viruses captured from real traffic: three versions of CodeRed, CodeRed II, WebDAV, a php forum attack, Mirela and the nsiislog.dll buffer overflow vulnerability (MS03-022) which exploits the IIS Windows media service. We explore four different scenarios for the voting process: (i) A 25% of agreement among webservers is required. Since we are only considering four webservers this translates to a voting process in which only one vote is needed for an anomalous designation. (ii) A 50% of agreement among webservers is required, which means that at least two webservers have to agree on the anomalous nature of the observed traffic. (iii) 75% of the webserver’s profiles have to agree on the decision (3 webservers in our network) and (iv) A 100% agreement, in which all profiles have to agree on the decision. These percentages represent quite a large spread designed to reveal the trend of the FP and
9
Percentage (i) 25% (ii) 50% (iii) 75% (iv) 100%
DR 100% 99% 99% 83%
FP 0.032% 0.02% 0.005% 0.001%
Server server1 server2 server3 server4
Table 2: DR and FP: Group rates.
DR 100% 83% 99% 99%
FP 0.02% 0.009% 0.015% 0.01%
Table 3: DR and FP: Individual rates.
DR in the voting process. Because we are using the content-based sensor Anagram as the AD, each profile votes based on whether the content of the packet (n-grams) being tested was seen during the training of the AD. Table 2 summarizes the group FP and DR rates for the four scenarios described. As can be seen, when only one server vote is sufficient to decide whether the traffic is anomalous (25% row), the DR is 100% and the FP is 0.032%. As the percentage of servers that need to agree increases, the DR decreases since it becomes more difficult for the four profiles to agree on the identification of anomalous traffic. On the other hand, the FP rate decreases considerably as the percentage of servers that have to agree increases. Obviously, with more servers involved in the vote there is a greater amount of information about normal traffic and hence it is less probable for normal packets to be mistakenly classified as anomalous. Given that high DR and low FP are the objectives of a good sensor, it appears that choosing an agreement of the 75% of the servers provides the best collaborative solution for the architecture. Such policy guarantees a very low FP of 0.005% and a DR of 99%. Other percentages translate into either smaller DR or larger FP rates. As in the pre-connect phase, the results also show that as long as the specific percentage of clean profiles is met (e.g., 75% in our example), the voting process will be robust to attacks by groups of malicious profiles trying to manipulate the vote. For example, in a network with 100 initial clean profiles, a group attack would need to introduce at least 35 malicious profiles in order to dilute the 75% agreement (75% of 135 profiles is 101 and the network would only have 100 clean profiles). To test our theory that collaborating ADs are more powerful than individual ADs, we ran an experiment where only the server-specific AD’s tests a packet without taking into account the decision of other devices with similar behavior. In this setting, only the server that is the destination of the traffic votes on the normalcy of the packets. As in the previous experiment, the third week of collected traffic was used together with real worms to poison the traffic. Table 3 shows the FP and DR for each of the servers when they run their own individual AD. The main conclusion drawn from comparing the best collaborative solution in Table 2 with Table 3 is that groups of ADs collaborating on the decision of normalcy or anomalous nature of the traffic, typically enhance the FP, the DR or both global rates when compared to individual ADs. For instance, in the case of server2, its individual DR is 83% and its individual FP rate is 0.009%. In contrast, the best collaborative solution results in an improved DR of 99% and a lower FP rate of 0.005%. While one may argue that in some instances the individual DR improves and the FP rate worsens (e.g., server1), the sum of all the individual ADs will always be worse off than the best collaborative solution. We conclude that the collaborative voting process improves the security enforcement of our architecture.
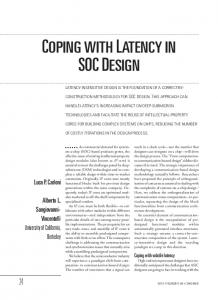
4.3 NAC Security Enforcement Over Time: Concept Drift We present a preliminary analysis on how our architecture conforms to concept drift i.e., the automatic update of security enforcement policies over time. The motivation is to account for and distinguish changes in the normal behavior of users from changes in behavior generated by an attack. Previous works such as FLORA [12] and STAND [2] considered algorithms in which the sensor only trusted the latest observed samples. In both, new samples were added to a set as they arrived, subsequently deleting the old samples. Furthermore, STAND detected anomalous behavior by comparing continuous models over time. We borrow these ideas in order to show how the voting process implemented in BB-NAC conforms to concept drift. As it is structured, Anagram considers a model 10
100
ANDModels
Group Detection Rate
90 80
AllModels 70 60 50 40 30 20 10 0
0
1
2
3
4
5
6
Training epoch
Figure 4: Group Detection Rate for two alternative concept drift algorithms: ANDModels and AllModels.
stable whenever the amount of new, unseen n-grams is below a certain threshold [11]. If we assume a first approach where new models are computed keeping the information from previous models, the DR rate will eventually start to decrease. This corresponds to the expectation that the longer the training period goes, the more likely that bad data will be used in the modeling. To show this directly, we collected traffic in the Computer Science department at Columbia University for a period of two weeks. Using Anagram, new models were computed until they reached stability while keeping all the information in the Bloom filter from the previous models. We refer to this technique as AllModels. In Figure 4 we plot the DR for a group of four webservers with the best collaborative solution i.e., a packet is considered anomalous if 75% of the servers agree. Units in the x axis represent each moment in time (epoch) when one or more servers in the network computed a new behavior profile. Initially, the group DR for the four webservers starts at 99%. Next, server1 computes a new model (epoch 1) and the group DR remains constant. We then proceed to poison the training traffic for server1 and server2 and have both compute new models (epoch 2). As a result, at epoch 2 the group detection rate decreases to 84% due to the fact that two profiles are poisoned and thus fail to correctly classify the traffic. Subsequent epochs involve the computation of new models by all the servers. However, the group anomaly detection is permanently damaged and does not vary from DR of 84%. The explanation behind this damage is that the training process just adds n-grams to the previous old models but still keeps the content of the attacks. Therefore, we conclude that a different approach is needed. An alternative approach is one where we start new clean models every time a model is trained. In such a case, the profiles erase previously seen information that may be repeated in the future. A direct consequence of this approach is an expensive increase of the FP rate. Thus, the elimination of previously seen information does not appear to be a viable alternative. Instead, we opt for a solution where every time a new Bloom filter profile is computed, the new profile is AND-ed with all its previous q profiles keeping only common data seen in continuous training sets such that: Pi = Pi ∧ Pi−1 ... ∧ Pi−q . We refer to this technique as ANDModels. This process allows us to detect and eliminate anomalous content that may have poisoned the models while they were being trained as shown by [2]. By keeping only the common data observed in q consecutive models, we guarantee that as long as we have one initial clean model, future models will also be clean. Obviously, the moment a device acquires a new different behavior, the resulting ANDModel may be almost empty since old and new profiles might not have much content in common. This situation would generate a very high FP rate because the Bloom filter contains very few normal n-grams. As a solution, we repeat the AND process s times and OR the results as shown in Equation 5. Each ANDModel represents a clean model in the past, and by OR-ing them we stitch together the last s old and new behaviors [12]. Pi = OR(t=0,s−1) (Pi−t ∧ Pi−1−t ... ∧ Pi−q−t ) 11
(5)
The higher the value of q in Equation 5, the more difficult it will be for the enemy to attack the architecture since all q models would have to be poisoned. Similarly, the higher the value of s, the more old behaviors are kept in the model. Going back to our previous example in Figure4 where server1 and server2 had permanently damaged the DR of the architecture, we applied ANDModels with values q=2, s=1 and repeated the simulation (Figure 4). With the new algorithm, the DR retains its initial value along the various epochs. In our experiments, we also note an increase in the FP rate of the sensor, probably due to the fact that ANDModels is eliminating content seen only in the last training period. The approach introduced here demonstrates that our architecture conforms to concept drift.
4.4 BB-NAC Latency Analysis We estimate the latency of the pre-connect phase as follows: l = la + (1 − ρ) × lq
(6)
where la represents the latency of the AND-ing between Bloom filters, variable ρ represents the probability that a device has an up-to-date bad model, and lq represents the latency of the quarantine. For every AND operation, we estimated la ≈ 18ms 1 . In case the AND operations cannot be run in parallel, la should be multiplied by the number of hosts in the cluster. For devices with up-to-date bad models, ρ = 1 and Equation 6 becomes l = la . On the other hand, if a device does not have an up-to-date bad model, it is quarantined and provided with a new bad model that represents the bad knowledge from all the other hosts. This new bad model is computed by OR-ing the host’s bad models, where each OR operation is completed in approximately 18ms. As an example, l ranges from 180ms to 342ms for a cluster of 10 devices and ρ = 0. The latency per packet during the post-connect phase is calculated as presented by Wang et al. in [11]: l = ((1 − F P ) × lBF ) + (F P × lq )
(7)
where lBF is the latency to check whether a certain n-gram is found in the profile’s Bloom filter, and F P stands for false positive rate. A typical value for lBF corresponds to about 5ms. If the checks cannot be performed in parallel for all profiles, lBF would translate to n × lBF where n stands for the number of hosts in the cluster responsible for the access control decision. For a cluster of 10 devices and a F P = 0.005, l ≈ 5.785ms–50.56ms.
5 Conclusions and Future Work In this paper, we have introduced a novel NAC architecture, BB-NAC, which enforces security based on the exchange of behavior profiles. Each host in the network is represented with a profile and a bad model which are then used during pre-connect and post-connect phases to detect up-to-date malware knowledge and zero-day attacks. Our architecture enhances previous NAC technologies by automatically updating the behavior-based security policies according to the hosts’ behavior evolution on a per-port basis. The experiments serve as a proof-of-concept for the novel behavior-based network access control presented here. We have shown that ADs collaborating through a voting process offer a more powerful approach to enforce security over individual ADs. Furthermore, our experiments confirm that BB-NAC is resilient to attacks even after accepting a percentage of malicious hosts into the network. Future work will include evaluating the two-tier strategy for additional ports. We are also investigating the clustering of devices based on their profiles instead of a self declaration of nature. Lastly, we plan to evaluate the performance of BB-NAC when using non-content anomaly sensors. For this purpose, we are currently designing a non-content AD that we plan to use in order to reproduce similar pre-connect and post-connect tests for the architecture. 1
The numerical values discussed in this subsection were obtained using a 1.73GHz Intel Pentium M Processor and a set of Bloom filters of size 16MB.
12
Acknowledgements This work was partially supported by NSF Grant CNS-06-27473 and by DARPA Grant HR0011-06-1-0034. Any opinions, findings, and conclusions or recommendations expressed in this material are those of the authors and do not necessarily reflect the views of the NSF or the U.S. Government.
References [1] B.H. Bloom. Space/time trade-offs in hash coding with allowable errors. In Communications of the ACM, volume 13, issue 7, July, 1970. [2] G. Cretu, A. Stavrou, S. Stolfo, and A. Keromytis. Data sanitization: Improving the forensic utility of anomaly detection systems. In Proceedings of the Third Workshop on Hot Topics in System Dependability, 2007. [3] F. Dressler, G. Munz, and G. Carle. Attack detection using cooperating autonomous detections systems (cats). In Wilhelm-Schickard Institute of Computer Science, Computer Networks and Internet, 2004. [4] G.C. Necula. Proof-carrying code. In The 24th Annual ACM SIGPLAN-SIGACT Symposium on Principles of Programming Languages, POPL97, 1997. [5] G.C. Necula and P. Lee. Safe kernel extensions without run-time checking. In 2nd Symposium on Operating Systems Design and Implementation, OSDI’96, October 1996. [6] G.C. Necula and P. Lee. Efficient representation and validation of proofs. In IEEE Symposiym on Logic in Computer Science, LICS’98, 1998. [7] C. Papadopoulos, R. Lindell, J. Mehringer, A. Hussain, and R. Govindan. Cossack: Coordinated suppression of simulatenous attacks. In Proceedings of DISCEX III, 2003. [8] J. Parekh, K. Wang, and S. Stolfo. Privacy-preserving payload-based correlation for accurate malicious traffic detection. In Large Scale Attack Defense, LSAD, 2006. [9] Snort rulesets. http://www.snort.org/pub-in/downloads.cgi. [10] VXHeavens. vx.netlux.org. [11] K. Wang, J. Parekh, and S. Stolfo. Anagram: A content anomaly detector resistant to mimicry attack. In In Proceedings of the Nineth International Symposium on Recent Advances in Intrusion Detection(RAID), 2006. [12] Gerhard Widmer and Miroslav Kubat. Learning in the presence of concept drift and hidden contexts. Machine Learning, 23(1):69–101, 1996.
13