636
JOURNAL OF COMPUTERS, VOL. 9, NO. 3, MARCH 2014
Benchmarking Website Performance in the Public Sector: A Non Parametric Approach Corrado lo Storto Dept. of Industrial Engineering, University of Naples Federico II, Naples, Italy Email:
[email protected]
Abstract— In this paper the outcome of a benchmarking study that compares organization websites in the public sector is presented. In particular, 31 websites of Italian public universities are compared considering the website cognitive efficiency as a measure of its overall performance, i.e. usability and accessibility. Data Envelopment Analysis is performed to generate a measurement for the cognitive efficiency, while cross-efficiency is used to alleviate the weak discriminating capability of the basic DEA model, and have a ranking of sample websites. Seven university websites are 100% cognitive efficient and average efficiency is at 61.63%. Results also show that website cognitive efficiency is positively influenced by the user perceived attractiveness and negatively by the time over-consumption during navigation. Index Terms—Benchmarking, Data Envelopment Analysis, cross-efficiency, Public Administration, website, efficiency, cognition, human-computer interaction
I. BACKGROUND Since late 1970s, both in developed and underdeveloped countries, the public sector is facing a continuous pressure to increase the amount of value for money delivered to citizens and businesses, by lowering its operating costs to become more efficient, assuring greater accountability and improving the quality of services provided to users, being consequently more customer focused and responsive to the needs of stakeholders [1]. Following this general trend, a significant reform of the public sector organizations was started since the early 1990s in Italy, too. A wide range of initiatives that affected different areas (i.e., health services, education, etc.) and levels (local and central government) of the public sector were launched, all of them aimed at improving value for money, ensuring an easy access to more common administrative services, modernizing them, simplifying and making the administrative action more efficient. The emergence of the pervasive ICT paradigm is having an important weight in the reorganization and innovation process occurring in the public sector. Indeed, recent trends in the digital technologies are revolutionizing the way the public sector organizations, citizens and businesses are interacting together. The WWW based-technologies, supporting an easy and less costly access to integrated databases, huge data storage, and a rapid information exchange between the citizens and the public sector © 2014 ACADEMY PUBLISHER doi:10.4304/jcp.9.3.636-643
organizations, allowed the establishment of a new reference framework in which the public sector services classified as front office services are supplied to citizens via internet, while services classified as back office services are supplied to other offices through conventional networks. The digital technologies have a significant potential impact on public services and value for money, and help providing citizens with services anytime and anywhere by using portable devices. The wide diffusion of the World Wide Web (WWW) infrastructure in the recent years has made available online a large variety of cost efficient e-government services, and a growing number of people may access to a huge amount of information published on the public administration websites [2]. The WWW offers several benefits and opportunities to citizens and public sector offices, i.e. to transfer and exchange information in a timely fashion, to publish up to date news, to publish a huge amount of information without incurring high printing and distribution costs, to increase transparency and accountability of the Public Administration, and finally enhancing trust of people. However, such benefits and opportunities cannot be achieved if the website interfaces that users can access are scarcely usable and accessible [3]. Indeed, according to the Technology Acceptance Model [4], the perceived usefulness and ease of use of a website positively influences the users’ intention to use it. While until the last decade most of the effort in the public sector organizations was focused on the measurement and improvement of internal efficiency, now the effort has shifted to measure the level of users (citizens and businesses) satisfaction and their appreciation for services provided. With the emergence of the e-governance paradigm, the benchmarking practice in the public sector has received more attention than in the past [1]. As the public sector organizations are facing an increasing pressure to improve service quality on the one side, and, in the same time, to reduce costs on the other side, benchmarking has become one important practice that may successfully support the public sector organizations in their effort to increase the value for money delivered to citizens, identifying performance gaps, developing and implementing action plans in order to improve performance in terms of cost efficiency and customer satisfaction [5, 6, 7]. Indeed, benchmarking may help the public sector organizations to set goals that
JOURNAL OF COMPUTERS, VOL. 9, NO. 3, MARCH 2014
reflect more their strategic mission, which are more realistic and achievable, thus creating worthwhile challenges, and allowing greater efficiency and accountability, and to better understand and meet the citizens needs in the provision of services through the WWW infrastructure [8, 9, 10]. For this reason, evaluating the performance of an e-government website has become an important concern in the implementation of benchmarking studies, and website usability and accessibility are considered important factors when the public sector performance has to be assessed relatively to issues such as administrative efficiency, social inclusion, transparency, etc., and measuring the website-user interaction performance in this modified citizen centric framework cannot be disregarded any longer.1 This paper adopts the integrative framework developed in ref. [14, 15] to implement a benchmarking study in the field of higher education in the public sector. In particular, the cognitive efficiency of the websites of a sample of 31 Italian public universities is measured. This framework is based on concepts driven from theories of information processing and cognition, and considers the website cognitive efficiency as a measure of its overall performance, i.e. usability and accessibility. Cognitive efficiency is then calculated performing Data Envelopment Analysis (DEA). II. THE CONCEPT OF WEBSITE COGNITIVE EFFICIENCY The performance of websites has been evaluated in the literature using different approaches. Many methods and approaches to website performance measurement have been suggested focusing on website functionality, i.e. audits and expert technical reviews, testing involving real users, automatic testing tools, contextual interviews, focus groups, heuristic evaluation, individual interviews, use cases, observations and log activity [16, 17, 18]. A number of approaches privilege users’ needs satisfaction associated to their interaction with the website when they use it, the level of website usability and ease of use, adopting the Technology Acceptance Model as reference framework [4], i.e. the data quality measurement models [19, 20], the WebQualTM model [21], the service quality models, such as the e-TailQ [22, 23], the SITEQUAL model [24], multivariate models [25] the SERVQUAL model [26, 27], the E-S-QUAL model [28]. Generally, in all these approaches, the website performance is evaluated adopting subjective assessments that are based on the website user personal judgments. 1
As the International Organization for Standards (ISO) claims, the usability a website is the extent to which it can be used by users to achieve specified goals with effectiveness, efficiency and satisfaction in a given context of use (ISO 9241 standards), or the capability of the website to be understood, learned, used and liked by the user, when used under specified conditions (ISO/IEC CD 9126-1 standards). Website accessibility relates to the extent a website can be used by all potential users, i.e. by people with all abilities and disabilities (WCAG 1.0 and WCAG 2.0 guidelines) [11]. Both website usability and accessibility influence the users satisfaction when they interact with the interface and their perceived efficiency of this interaction. Behind these two concepts there are two complementary design approaches that, to a certain extent, share common principles [12, 13].
© 2014 ACADEMY PUBLISHER
637
They implicitly assume that website performance fundamentally depends on the cognitive capabilities of the website users when they interact with the website and give meanings to the website [29, 30]. Cognition and information processing capabilities are important issues that determine how users perceive website quality [31]. The perceived ease of navigation, the website information structure comprehension, and the easy search for important information are indeed critical concepts in any website evaluation. However, the traditional website evaluation methods privilege the use of qualitative data, and in general they are unable to take into account the users’ emotions and experiences [32]. Further, these approaches are unable to model the cognitive process of website users that determines their feeling about the website when they experience it. The integrative framework that is used here to assess the website performance is based on the idea that the user-website interaction forms a unique coupled cognitive system in which the websites, providing the users with patterns of action and an additive short-memory, support them in their work keeping their internal mental information processing activity less complex [14, 15]. Thus, the external information resources provided by the websites become a part of the users cognitive system [33]. The websites address how users’ cognition evolves during interaction as the websites dynamically assume new configurations that better fit the users information processing capability, while information and knowledge are continuously transformed through dynamically adapting mental, external and technological representational states as the physical structures in the external representations (the website) constrain the range of possible cognitive behaviors, allowing some of them but prohibiting others. When the users interact with the websites, they have to bear a cognitive cost because of the efforts made to search, interpret and process information. If the website users are either unable to locate critical information or to manage the information overload, being more or less disoriented because information already collected is either redundant or ambiguous, they will find difficult to proceed with their search or retrieve supplementary information necessary to accomplish the task. That will make their search activity psychologically and cognitively costly. In the course of their interaction with the websites, the cognitive state of the website users may thus be characterized in terms of being more or less ambiguous and uncertain. Interacting with the website may be also a source of gratification and satisfaction to users, both of them associated to the quality of interaction itself and the way this latter develops, and, finally, to the successful goal attainment. Moreover, a reduced amount of time necessary to achieve a task is usually associated to more efficient information processing and better website design. These perceived benefits are important to the website users as they reflect a positive outcome from the outlay of scarce resources and the fulfillment of previously unmet needs [14, 15]. Thus, a website should be capable to eliminate or at least reduce the users working memory overload associated to
638
JOURNAL OF COMPUTERS, VOL. 9, NO. 3, MARCH 2014
the need to mentally retain and integrate different information and knowledge amounts, and, in the same time, to provide the users with a pleasant and satisfying experience. Cognitive efficiency (CEff) may thus be considered an important measure of the amount of cognitive work the users have to perform outside their working memory to carry on a task, given the constraining nature of the website interface: ∑ cognitive benefits CEff = ∑ cognitive costs Table 1 displays the cognitive dimensions – benefits (O) and costs (I) – of the framework used to measure the website cognitive efficiency. The framework considers 3 types of cognitive costs generated by the perceived uncertainty, ambiguity and over-consumption of time related both to the website structure characteristics and navigation of users, and 3 types of cognitive benefits associated to the experience of the users in their interaction with the website as perceived usefulness, satisfaction and attraction for website. TABLE 1 DEA MODEL VARIABLES
Variable
Type
Associated measure
UNC_S
I
cognitive cost due to perceived uncertainty determined by website structure
AMB_S
I
cognitive cost due to perceived ambiguity determined by website structure
TIME_S
I
cognitive cost due to perceived time overconsumption influenced by website structure
UNC_N
I
AMB_N
I
TIME_N
I
USE_E
O
cognitive benefit determined by perceived website usefulness
SAT_E
O
cognitive benefit determined by perceived satisfaction for website usage
ATT_E
O
cognitive benefit determined by perceived attractiveness for website
cognitive cost due to perceived uncertainty determined by website navigation cognitive cost due to perceived ambiguity determined by website structure cognitive cost due to perceived time overconsumption affected by website structure
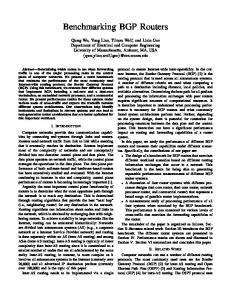
III. THE MEASUREMENT OF THE WEBSITE COGNITIVE EFFICIENCY BY IMPLEMENTING DEA The benchmarking analysis and measurement of websites cognitive efficiency can be implemented by performing Data Envelopment Analysis (DEA). DEA is a non parametric technique that identifies the efficient units from a given set and combine them to generate an efficient frontier that is used as a benchmark to measure the relative efficiency of the inefficient units. The efficiency measurements depends on a restricted set (the reference set) of units with which the unit under evaluation is compared to [34]. Variables associated to measures of the user perceived cognitive costs and benefits are adopted as inputs and outputs, without any explicit assumption about the underlying relation between them. The website cognitive efficiency (CEff) is thus calculated as the classical engineering ratio of outputs to inputs. Figure 1 graphically shows how DEA works and © 2014 ACADEMY PUBLISHER
measures efficiency. Five websites, WSA, WSB, WSC, WSD, WSE should be compared. It is assumed that the usage of each website produces only 2 kind of cognitive benefits and 1 kind of cost. Let us assume that each website generates the same amount of cognitive cost. Under the assumption of convexity, the line segments that respectively connect websites WSA to WSC and WSC to WSE are called the efficient frontier. The efficient frontier defines the maximum combinations of benefits that can be produced for the given amount of cost. Indeed, the segment WSAWSC lies beyond both the segment WSAWSB that can be drawn between websites WSA and WSB and the segment WSBWSC drawn between WSB and WSC. As a consequence, a convex combination of WSA and WSC will generate the most benefit for the given cost. Websites WSA and WSC are efficient as they are on the efficient frontier, but as WSB lies under the efficient frontier, it should be considered inefficient and its cognitive inefficiency CEff can be measured by the relative length of segment WSACWSB (where WSAC is a virtual website formed through a combination of website WSA and website WSC which form the reference set of WSB, and the ratio OWSB/OWSAC measures the efficiency). In a similar way, segment WSCWSE is beyond the segments WSCWSD and WSEWSD, and segment WSCEWSD measures the inefficiency of website WSD. The efficient frontier is generated solving a sequence of linear programming problems, one for each unit included in the sample. Given the set of units, for each unit DEA determines the optimal set of input weights and output weights that maximize its efficiency score. Assuming that there are n units, r inputs and s outputs, the relative efficiency measurement of a unit k is obtained by solving the following fractional model [35]: s
∑ vi yik
i =1 r
max
∑ u j x jk j =1 s
s.t.
∑ vi yip
i =1 r
p =1,...,n
∑ u j x jp j =1
vi , u j ≥ 0
i =1,...,s
j =1,...,r
where yip is the amount of output i produced by unit p, xjp is the amount of input j used by unit p, vi is the weight given to output i, and uj is the weight given to input j. This model can be converted into n linear programs which can be more easily solved to calculate the relative efficiency of each unit, as follows: max s.t.
s
∑ vi yik
i =1 r
∑ u j x jk = 1 j =1 s
r
i =1
j =1
∑ vi yip − ∑ u j x jp ≤ 0
p =1,...,n i =1,...,s
j =1,...,r vi , u j ≥ 0
JOURNAL OF COMPUTERS, VOL. 9, NO. 3, MARCH 2014
Several scholars have suggested different methods based on DEA to have units rankings [36, 37]. The crossefficiency approach is particularly useful to alleviate the weak discrimination capability of the basic DEA model [38]. The calculation of each unit cross-efficiency occurs in two steps [39]. In the first step, the basic DEA evaluation is carried out and optimal weights assigned to inputs and outputs for every unit are determined. In the second step, the cross-efficiencies matrix X is generated. The element ceij in i-th row and j-th column of crossmatrix X is the ratio ceij = effj(ui, vi) of outputs and inputs of unit j, weighted by the optimal weights of unit i. As a consequence, column j contains the efficiency scores of unit j calculated using optimal weights of unit i, for i=1,…,n. The average score of elements in column j provides the cross-efficiency score of unit j. The crossefficiency scores calculated for all units are used to rank these latter. All measurements of elements in matrix X are between 0 and 1, while the elements in the diagonal are the basic DEA efficiency scores.
639
graduation and professional qualification examinations was considered as a reference task for the benchmarking analysis, while 5 young engineers graduated from the University of Naples Federico II were involved as website user-evaluators of all sample websites. An experimental laboratory setting was implemented to carry on the empirical study. The 5 young engineering graduates were invited to browse the 31 websites and provide their judgments. A questionnaire purposefully created was used to collect data from users during their interaction with websites and measure their cognitive costs and benefits. Nine groups of statements allowed to have the same number of measurement scales of the framework cognitive constructs. Users were requested to express their agreement or disagreement for the statement content using a 1-9 level measurement grid. As Table 2 shows, the α Cronbach index higher than 0.7 indicates a good internal fit and consistency of single scales [40]. TABLE 2 ALFA-CRONBACH INDEX OF SCALES variable UNC_S
CEff =
w1benefit1 + w 2benefit 2 v1cost1
Figure 1. An example about how DEA works
IV. THE BENCHMARKING STUDY A. Method The sample contains 31 websites of Italian public research and teaching universities, and is largely representative as the most important academic institutions in terms of students enrolled and amount of researchers and professors are included. In general, universities provide the online users with several services, i.e. online enrollment to single courses and undergraduate or graduate diploma degrees, download of teaching material, the availability of a great amount of information relative to course programs, examinations, records of their academic career, etc. that can be more or less easily searched and retrieved. As the website usability and accessibility evaluation depends on the assessment context, goals and task performed during the interaction of the users with the website, major attention was necessary in the analysis to identify and circumscribe a specific task and a homogenous group of website usersevaluators. The search for information relative to the © 2014 ACADEMY PUBLISHER
α 0.92
# scale items 3
AMB_S
0.90
9
TIME_S
0.87
3
UNC_N
0.85
4
AMB_N
0.94
13
TIME_N
0.79
5
USE_E
0.91
7
SAT_E
0.89
4
ATT_E
0.83
5
Judgments provided by users for every scale were averaged generating a unique measurement for the underlying construct. These measurements were used to run DEA. B. Results Table 3 shows the Pearson correlations between cognitive cost and benefit variables. Cognitive costs associated to website structure and navigation are negatively correlated to the cognitive benefits perceived by the users when they interact with the websites. The correlation signs support the rationale behind the website cognitive efficiency evaluation framework adopted. The strong measurements and positive signs of correlations between cognitive costs are also indicating that ambiguity and uncertainty influence each other in the interaction of the users with the websites. Table 4 reports the outcome of DEA efficiency calculation. The CCR DEA efficiency (CCReff) was calculated, adopting a radial measure for efficiency and an input orientation approach [35]. In the input orientation approach it is assumed that cognitive costs should be reduced to make a not efficient website 100% efficient keeping the same amount of perceived cognitive benefits. Cognitive efficiency measures show that 7 out 31 websites result 100% cognitive efficient. The average efficiency of the sample is at 61.63% with a standard deviation of 27.25%.
640
JOURNAL OF COMPUTERS, VOL. 9, NO. 3, MARCH 2014
TABLE 3 PEARSON CORRELATIONS BETWEEN COGNITIVE VARIABLES 1 1 UNC_S
2
3
4
5
6
7
8
9
1.00
2 AMB_S
.95 1.00
3 TIME_S
.94
.91 1.00
4 UNC_N
.63
.65
.71 1.00
5 AMB_N
.60
.63
.68
.94 1.00
6 TIME_N
.67
.65
.71
.80
7 USE_E
-.27
-.36
-.35
-.43
-.47
-.44 1.00
8 SAT_E
-.31
-.38
-.34
-.50
-.53
-.51
.95 1.00
9 ATT_E
-.37
-.39
-.41
-.59
-.61
-.63
.86
.82 1.00
.90
1.00
The university websites considered as inefficient have
an efficiency score lower than 100%. According to the framework, a website is inefficient if a virtual website can be generated as a linear combination of some websites in the sample, and this virtual website offers at least the same amount of cognitive benefits to the user charging a lower amount of cognitive costs compared to the real website under examination. The average efficiency of the 24 inefficient websites is 54.43% with a standard deviation of 19.74%, while the scores of inefficient websites range between 12.44% and 86.42%. Table 4 also shows the reference sets of the inefficient websites. The number of times each 100% efficient website compares in an inefficient website reference set is useful to understand to what extent an efficient website has unique features in terms of cognitive benefits delivered to users and costs borne by them.
TABLE 4 DEA OUTCOME WS WS1 WS2 WS3 WS4 WS5 WS6 WS7 WS8 WS9 WS10 WS11 WS12 WS13 WS14 WS15 WS16 WS17 WS18 WS19 WS20 WS21 WS22 WS23 WS24 WS25 WS26 WS27 WS28 WS29 WS30 WS31
Description Università Politecnica Marche Università di Bari Politecnico di Bari Università di Bergamo Università di Bologna Università di Brescia Università di Cagliari Università della Calabria Università di Camerino LIUC Università di Catania Università di Ferrara Università di Firenze Università di Genova Università di Lecce Politecnico di Milano Università di Napoli Federico II Seconda Università di Napoli (SUN) Università di Napoli Parthenope Università di Padova Università di Palermo Università di Parma Università di Pisa Università di Roma La Sapienza Università di Roma Tor Vergata Università di Salerno Università del Sannio Università di Sassari Politecnico di Torino Università di Trento Università di Udine
CCReff 25.18 71.85 66.81 65.51 50.25 50.72 24.54 63.64 39.72 100 12.44 42.74 40.35 60.91 26.79 86.42 54.95 100 100 69.64 52.65 100 36.97 100 58.48 14.97 100 75.5 68.18 100 51.18
CROSSeff 19.62 62.99 59.05 48.91 42.93 44.12 21.60 53.88 32.05 92.43 8.29 39.23 35.48 52.31 22.96 64.76 42.90 94.60 89.22 59.82 47.35 94.81 28.00 92.89 49.29 10.76 87.61 57.24 59.56 91.87 36.19
In the sample, the websites of the Università di Napoli Parthenope and the Università del Sannio have only themselves as a reference website. On the contrary, WS10, WS18, WS22, WS24 and WS30 are frequently included in the reference sets of several inefficient websites. In particular, WS18 and WS22 are respectively in the reference sets of 16 and 15 inefficient websites. This information may be used to make more focused comparisons of websites, privileging only a restricted number of websites and/or cognitive dimensions. The cognitive efficiency rate calculated by the CCR DEA © 2014 ACADEMY PUBLISHER
peers WS10
WS18
WS19
WS22
WS24
WS27
WS30
+ + + +
+
+ +
+ + + + + +
+
+
+ + +
+
+
+ + + +
+
+ + +
+
+
+ + +
+ + +
+ + +
+
+ +
+ + +
+
+ +
+ +
+
+ +
+
+ + +
+ +
+ +
+ +
+
model for an inefficient website does not provide any ranking among all websites, but only its relative inefficiency compared to that of the websites which form its reference set. Thus, the website of the Università di Napoli Federico II is only 54.95% efficient in comparison to the Università LIUC and Seconda Università di Napoli, while the website of the Politecnico di Milano is inefficient at 13.58% (or 86.42% efficient) compared to a virtual website that combines together the websites of the Università La Sapienza of Roma and the Università di Trento that have generated its reference set.
JOURNAL OF COMPUTERS, VOL. 9, NO. 3, MARCH 2014
641
TABLE 5 REGRESSION ANALYSIS OUTCOME Model 1
Model 2
variable
B
t
intercept
99.882
UNC_S
3.425
Model 3
p-level
B
t
p-level
B
t
p-level
10.084
0.000
116.260
11.860
0.000
-25.701
-3.065
0.005
0.581
0.566
UNC_N
-4.250
-0.700
0.490
AMB_N
-3.663
-0.589
0.561
TIME_N
-6.145
-1.851
0.075
USE_E
1.576
0.450
0.656
SAT_E
1.243
0.291
0.773
ATT_E
9.014
3.266
0.003
AMB_S
-3.826
-0.621
0.540
TIME_S
-7.699
-1.592
0.123
overall fit
overall fit
Multiple R
0.703
0.794
overall fit 0.889
Multiple R²
0.494
0.631
0.791
Adjusted R²
0.438
0.590
0.767
F(3,27)
8.790
15.395
34.003
p-level
0.000
0.000
0.000
TABLE 6 IMPROVEMENT TRAJECTORIES OF INEFFICIENT WEBSITES WS WS1 WS2 WS3 WS4 WS5 WS6 WS7 WS8 WS9 WS11 WS12 WS13 WS14 WS15 WS16 WS17 WS20 WS21 WS23 WS25 WS26 WS28 WS29 WS31
%Δ UNC_S -79.98 -49.11 -62.30 -68.25 -70.36 -69.00 -81.21 -63.65 -64.74 -89.10 -57.62 -63.02 -56.28 -77.73 -31.95 -67.42 -45.49 -56.07 -63.03 -67.59 -85.68 -47.32 -57.05 -66.77
% AMB_S -80.51 -40.39 -50.20 -64.89 -55.95 -61.29 -82.30 -61.12 -64.19 -87.56 -57.26 -59.65 -52.99 -73.21 -13.58 -69.00 -30.36 -47.35 -63.03 -68.11 -85.03 -37.14 -50.39 -61.64
% TIME_S -82.51 -35.89 -61.05 -67.65 -63.89 -67.86 -84.64 -55.39 -60.28 -88.71 -69.15 -63.76 -66.45 -78.12 -22.74 -72.59 -54.81 -60.61 -68.93 -65.48 -85.90 -48.26 -58.39 -62.11
%UNC_N -74.82 -28.15 -33.19 -34.49 -49.75 -49.28 -75.46 -38.77 -60.28 -87.56 -57.26 -59.65 -39.09 -74.58 -34.43 -48.58 -30.36 -48.91 -63.03 -41.81 -88.37 -40.05 -31.82 -48.82
Table 4 also reports the cross-efficiency calculations. The average score is at 52.99%, while the maximum and minimum scores are at 94.81% and 8.29%, with the website of the Università di Parma (WS22) ranked first and the website of the Università di Catania (WS11) the last. The uncensored efficiency scores generated by the cross-efficiency calculation allow to easily regress the efficiency measurement on the benefit and cost dimensions of the cognitive efficiency integrative framework. Table 5 illustrates the outcome of the regression analysis that adopted the cross-efficiency score as dependent variable and the cognitive cost and benefit
© 2014 ACADEMY PUBLISHER
%AMB_N -75.72 -35.71 -33.19 -43.50 -49.75 -51.27 -75.60 -36.36 -63.41 -88.65 -57.26 -61.47 -41.37 -74.83 -17.76 -45.05 -30.36 -47.35 -67.54 -41.52 -88.67 -24.50 -31.82 -65.81
%TIME_N -75.40 -40.02 -34.39 -73.13 -66.17 -53.60 -77.26 -37.24 -65.93 -88.91 -58.43 -61.81 -45.73 -73.21 -13.58 -56.17 -46.83 -50.75 -72.24 -41.52 -88.67 -44.60 -39.85 -68.57
%USE_E 0 3.28 0 0 0 1.90 10.29 4.25 47.67 112.48 1.26 16.74 14.99 3.45 4.58 30.22 22.34 1.47 53.94 10.96 30.72 18.05 1.09 44.67
%SAT_E 36.61 2.50 0 12.64 0 0 0 0 23.57 114.50 0 6.96 0 12.23 5.04 0 0 0 37.47 0 0 0 0 34.43
%ATT_E 6.11 0 0 0 0 0 0 0 0 0 0 0 0 0 0 0 0 0 0 0 0 0 0 0
variables as independent variables. Due to the reduced size of sample, three regression models were built including each time the cognitive variables of the specific characteristic of the website-user interaction (website structure, navigation, user experience). The statistical fit of the regression models is acceptable, but few variables have a clear effect on the dependent variable. Results show that the website cognitive efficiency is negatively influenced by the over consumption of time perceived by the users during their navigation on the website and positively by their attractiveness for the website characteristics and content. Table 6 illustrates some
642
JOURNAL OF COMPUTERS, VOL. 9, NO. 3, MARCH 2014
information that further make evident the strength of the framework adopted to measure the website cognitive efficiency in the practice of benchmarking. This table shows how DEA can be used to identify effective improvement trajectories for inefficient websites. The efficiency score provided by DEA suggests the degree of inefficiency of a website compared with a virtual website on the frontier defined by its reference set. For instance, the website of the Università di Brescia that is efficient only at 50.72% may become 100% cognitively efficient if the cognitive costs of the users perceived as uncertainty or ambiguity associated to the website structure are reduced by 69% or about 61%. In theory, cognitive efficiency of inefficient websites might be improved either by increasing the cognitive benefits perceived by the users or by decreasing their cognitive efforts.
information that can be used in the benchmarking analysis: a relative rating of websites classifying them as “efficient” or “inefficient”, the reference set for each inefficient website, that is the set of relatively efficient websites to which it has been most directly compared in calculating its efficiency rating; the relative amount of cognitive costs reduction required to make a website more usable and/or accessible. The benchmarking framework based on the cognition theories suggests a holistic view of measuring a website performance that is useful to acquire useful preliminary insights. However, in order to carry on a more in depth investigation necessary to grasp details of the users cognitive behavior during their interaction with the website, some complementary methods and techniques such as eye-tracking and A/B split testing could be purposefully adopted in the benchmarking study.
V. CONCLUSION This paper has presented the outcome of a benchmarking study that has compared 31 websites of Italian public research and teaching universities considering the website cognitive efficiency as a measure of its overall performance, i.e. usability and accessibility. The website cognitive efficiency is measured as the ratio of the cognitive benefits to cognitive costs that the users perceive when they interact with the website. Cognitive efficiency is thus a measure of the amount of cognitive work the users have to perform outside their working memory when they are engaged in a given task, given the constraining nature of the website interface. The study has adopted an integrative framework that uses Data Envelopment Analysis to generate a measure of the website efficiency and some theories of individual information processing and human-computer cognition to identify and evaluate sources of cognitive costs and benefits for website users when they interact with a website. Data show that only 7 university websites are 100% cognitive efficient and the average efficiency is at 61.63%. The average distance of the bulk of the Italian university websites from the 7 best usable and accessible ones that behave as benchmarks is thus remarkable. The average improvement needed in terms of cognitive effort reduction is indeed between -51.60% and -64.38%, achieving about -90% for the worst website in sample. Results also show that website cognitive efficiency is positively influenced by the user perceived attractiveness and negatively by the time over-consumption during navigation. This outcome suggest that, on average and independently of the specific case (website) examined, the improvement strategies aimed at reducing the time consumed in the user-website interaction and increasing the website attractiveness are important tools to enhance the website overall usability and appreciation. The implementation of DEA has revealed to be a very useful method in the practice of website benchmarking in the public sector, as it provides insights as to the potential improvement capabilities of a website, indicates sources of cognitive inefficiency, and also makes it possible to take into account the existence of preferences when efficiency score are calculated. DEA supplies several © 2014 ACADEMY PUBLISHER
ACKNOWLEDGMENT This paper is the revised and extended version of the paper “Measuring performance in the PA sector: an analysis of websites efficiency” presented at the International Conference on Internet Services Technology and Information Engineering (ISTIE 2013), May 11–12, 2013, Bogor, Indonesia, and published in [41]. The author is grateful to the anonymous referees for their comments. REFERENCES [1] A. Gunasekaran, “Benchmarking in public sector organizations”, Benchmarking: An International Journal, vol. 12, no. 4, 2005, pp. 289-292, 2005. [2] R. Heeks. Implementing and managing eGovernment: an international text. London: Sage, 2006. [3] J. J Cappel, and Z. Huang, “A usability analysis of company websites”, The Journal of Computer Information Systems, vol. 48, no. 1, pp. 117-123, 2007. [4] F. D. Davis, R. P. Bagozzi, and P. R. Warshaw, “User acceptance of computer technology: a comparison of two theoretical models”, Management Science, vol. 35, no. 8, pp. 982-1003, 1989. [5] M. J. Spendolini, The Benchmarking Book, New York: AMACOM Books, 1992. [6] S. Tillema, “Public sector benchmarking and performance improvement: what is the link and can it be improved?”, Public Money and Management, vol. 30, no. 1, pp. 69-75, 2010. [7] C. lo Storto, “Evaluating technical efficiency of Italian major municipalities: a Data Envelopment Analysis model”, Procedia Social and Behavioral Sciences, vol. 81, pp. 346-350, 2013. [8] D. N. Ammons, Municipal Benchmarks: Assessing Local Performance and Establishing Community Standards. London: Sage, 2001. [9] H. Hatry, Performance Measurement: Getting Results. Washington, DC: Urban Institute Press, 1999. [10] H. Hatry, “Performance Measurement: Fashions and Fallacies”, Public Performance & Management Review, vol. 25, no. 4, pp. 352-8, 2002. [11] WCAG2.0. Guidelines. http://www.w3.org/TR/WCAG20 (retrieved on Nov. 2012). [12] A. Dey “Usability and accessibility: best friends or worst enemies?”http://unpan1.un.org/intradoc/groups/public/doc
JOURNAL OF COMPUTERS, VOL. 9, NO. 3, MARCH 2014
[13] [14]
[15]
[16]
[17]
[18] [19]
[20]
[21]
[22] [23]
[24]
[25]
[26]
[27]
[28]
uments/APCITY/UNPAN023374.pdf (retrieved on Nov. 2012). K. Gladstone, C. Rundle, and T. Alexander, “Accessibility and usability of eCommerce systems”, Lecture Notes in Computer Science, vol. 2398, pp. 11-18, 2002. C. lo Storto, “A distributed cognition framework to compare e-commerce websites using Data Envelopment Analysis”, World Academy of Science, Engineering and Technology, vol. 52, no. 28, pp. 71-78, 2009. C. lo Storto, “Evaluating ecommerce websites cognitive efficiency: An integrative framework based on data envelopment analysis”, Applied Ergonomics, vol. 44, no. 6, pp. 1004-1014, 2013. S. Y. Chen, and R.D. Macredie, “The assessment of usability of electronic shopping: a heuristic evaluation”, International Journal of Information Management, vol. 25, no. 6, pp. 516-532, 2005. B. Magoutas, K. U. Schmidt, G. Mentzas, and L. Stojanovic, “An adaptive e-questionnaire for measuring user perceived portal quality”, International Journal of Human-Computer Studies, vol. 68, pp. 729-745, 2010. J. Nielsen, and H. Loranger, Prioritizing web usability. Berkeley, CA: New Riders Press, 2006. A. Caro, C. Calero, I. Caballero, and M. Piattini, “A proposal for a set of attributes relevant for Web portal data quality”, Software Quality Journal, vol. 16, no. 4, pp. 513542, 2008. M. Heo, “Assessing user needs of Web portals: a measurement model”, Information Research, vol. 18, no. 2, paper 578, 2013 [Available at http://InformationR.net/ir/18-2/paper578.html] E. T. Loiacono, R. T. Watson, and D. L. Goodhue, “WebQual: An Instrument for Consumer Evaluation of Websites”, International Journal of Electronic Commerce, vol. 11, no. 3, pp. 51-87, 2007. D. M. Szymanski, and R. T. Hise, “e-Satisfaction: An Initial Examination,” Journal of Retailing, vol. 76, no. 3, pp. 309-322, 2000. M. Wolfbinbarger, and M. C. Gilly, “e-TailQ: Dimensionalizing, Measuring, and Predicting Retail Quality”, Journal of Retailing, vol. 79, no. 3, pp. 183-98, 2003. B. Yoo, and N. Donthu, “Developing a Scale to Measure the Perceived Quality of an Internet Shopping Site (SITEQUAL)”, Quarterly Journal of Electronic Commerce, vol 2, no. 1, pp. 31-45, 2001. M. A. Moraga, C. Calero, and M. Piattini, “A first proposal of a portal quality model”, Proceedings of the IADIS International Conference, E-society (Avila, Spain). Berlin: IADIS Press, 2004, pp. 630-638. H. Landrum, V. Prybutok, X. Zhang, and D. Peak, “Measuring IS system service quality with SERVQUAL: users’ perceptions of relative importance of the five SERVPERF dimensions”, International Journal of an Emerging Transdiscipline, vol. 12, no. 1, pp. 17-35, 2009. V. A. Zeithaml, A. Parasuraman, and A. Malhotra, “Service Quality Delivery Through Websites: A Critical Review of Extant Knowledge”, Journal of the Academy of Marketing Science, vol. 30, no. 4, pp. 362 – 375, 2002. A. Parasuraman, V. A. Zeithaml, and A. Malhotra (2005). “E-S-QUAL: a multiple-item scale for assessing electronic
© 2014 ACADEMY PUBLISHER
643
[29] [30]
[31]
[32]
[33]
[34] [35] [36]
[37]
[38]
[39]
[40] [41]
service quality”, Journal of Service Research, vol. 7, no. 3, pp. 213-233. K. E. Weick, Sensemaking in Organizations, London: Sage, 1995. R. Agarwal, and V. Venkatesh, “Assessing a firm’s Web presence: a heuristic evaluation procedure for the measurement of usability”, Information System Research, vol. 13, pp. 168-186, 2002. P. Zhang, and G. M. von Dran, “Satisfactor and dissatisfactors: a two-factor model for website design and evaluation”, Journal of the American Society for Information Science, vol. 51, no. 4, pp. 1253-1268, 2000. M. Chamorro-Koc, V. Popovic, and M. Emmison, “Human experience and product usability: principles to assist the design of user-product interaction”, Applied Ergonomics, vol. 40, pp. 648-656, 2009. W.H. Edmondson, R. Beale, “Projected cognition – extending distributed cognition for the study of human interaction with computers”, Interacting with Computers, vol. 20, pp. 128-140, 2008. W. W. Cooper, L.M. Seiford, and K. Tore, Introduction to Data Envelopment Analysis and its uses. New York: Springer, 2006. A. Charnes, W. W. Cooper, and E. Rhodes, “Measuring efficiency of decision making units”, European Journal of Operations Research, vol. 2, no. 6, pp. 429-444, 1978. N. Adler, L. Friedman, and Z. Sinuany-Stern, “Review of ranking methods in the data envelopment analysis context”, European Journal of Operational Research, vol. 140, pp. 249-265, 2002. C. lo Storto, and G. Ferruzzi, “Benchmarking economical efficiency of renewable energy power plants: a Data Envelopment Analysis approach”, Advanced Materials Research, vol. 772, pp. 699-704, 2013. T. R. Sexton, R. H. Silkman, and A. J. Hogan, “Data envelopment analysis: critique and extensions”, in Measuring Efficiency: an Assessment of data Envelopment Analysis, R. H. Silkman, Ed., New York: Jossey-Bass, pp. 73-105, 1986. R. H. Green, J. R. Doyle, and W. D. Cook, “Preference voting and project ranking using data envelopment analysis and cross-evaluation”, European Journal of Operational Research, vol. 90, pp. 461–472, 1996. J. C. Nunnally, and I. H. Bernstein, Psychometric Theory, New York: McGraw-Hill, 1994. C. lo Storto, “Measuring Performance in the Public Administration Sector: An Analysis of Websites Efficiency”, Advanced Science Letters, vol. 20, no. 1, pp. 272-275, 2014.
Corrado lo Storto holds a Laurea in Aeronautical Engineering, an MBA and a PhD in Science of Industrial Innovation. He is an Associate Professor in Engineering Management and Economics with the School of Engineering, University of Naples Federico II, Italy. His research interests include technology and innovation management, knowledge management, complex systems analysis and performance measurement, and on these subjects he has published several papers in international journals and refereed conference proceedings. He is the Chair of the IEEE Italian Technology Management Chapter.