Chuck Rhykerd, Dean Mitchell, and John Mattingly. Prepared by ... a Lockheed Martin Company, for the United States Department of Energy's. National Nuclear ...
SANDIA REPORT SAND2009-6550 Unlimited Release Printed September 2009
Benchmarks for GADRAS Performance Validation Chuck Rhykerd, Dean Mitchell, and John Mattingly
Prepared by Sandia National Laboratories Albuquerque, New Mexico 87185 and Livermore, California 94550 Sandia is a multiprogram laboratory operated by Sandia Corporation, a Lockheed Martin Company, for the United States Department of Energy’s National Nuclear Security Administration under Contract DE-AC04-94AL85000.
Issued by Sandia National Laboratories, operated for the United States Department of Energy by Sandia Corporation. NOTICE: This report was prepared as an account of work sponsored by an agency of the United States Government. Neither the United States Government, nor any agency thereof, nor any of their employees, nor any of their contractors, subcontractors, or their employees, make any warranty, express or implied, or assume any legal liability or responsibility for the accuracy, completeness, or usefulness of any information, apparatus, product, or process disclosed, or represent that its use would not infringe privately owned rights. Reference herein to any specific commercial product, process, or service by trade name, trademark, manufacturer, or otherwise, does not necessarily constitute or imply its endorsement, recommendation, or favoring by the United States Government, any agency thereof, or any of their contractors or subcontractors. The views and opinions expressed herein do not necessarily state or reflect those of the United States Government, any agency thereof, or any of their contractors.
2
SAND2009-6550 Unlimited Release September 2009
Benchmarks for GADRAS Performance Validation Chuck Rhykerd, Dean Mitchell, and John Mattingly Contraband Detection Technology Sandia National Laboratories P.O. Box 5800 Albuquerque, New Mexico 87185-0782
Abstract The performance of the Gamma Detector Response and Analysis Software (GADRAS) was validated by comparing GADRAS model results to experimental measurements for a series of benchmark sources. Sources for the benchmark include a plutonium metal sphere, bare and shielded in polyethylene, plutonium oxide in cans, a highly enriched uranium sphere, bare and shielded in polyethylene, a depleted uranium shell and spheres, and a natural uranium sphere. The benchmark experimental data were previously acquired and consist of careful collection of background and calibration source spectra along with the source spectra. The calibration data were fit with GADRAS to determine response functions for the detector in each experiment. A one‐dimensional model (pie chart) was constructed for each source based on the dimensions of the benchmark source. The GADRAS code made a forward calculation from each model to predict the radiation spectrum for the detector used in the benchmark experiment. The comparisons between the GADRAS calculation and the experimental measurements are excellent, validating that GADRAS can correctly predict the radiation spectra for these well‐defined benchmark sources. This work was funded by the DOE NNSA Technical Integration Program.
.
3
Acronyms and Nomenclature μCi GADRAS HDPE HEU HPGe LANL LLNL Pu
microcuries Gamma Detector Response and Analysis Software high density polyethylene highly enriched uranium high purity germanium Los Alamos National Laboratory Lawrence Livermore National Laboratory plutonium
4
Contents 1 2
3
4
5
6
7
Introduction .......................................................................................................................................... 9 LLNL Plutonium Sphere Benchmark.................................................................................................... 10 2.1 Description................................................................................................................................. 10 2.2 Source ........................................................................................................................................ 10 2.3 Detector and Calibration ........................................................................................................... 11 2.4 Benchmark Model ..................................................................................................................... 13 2.5 File Locations with the GADRAS Distribution ............................................................................ 16 2.6 Summary.................................................................................................................................... 17 2.7 References ................................................................................................................................. 17 2.8 Filenames................................................................................................................................... 17 LLNL Plutonium Sphere in Polyethylene Benchmark.......................................................................... 18 3.1 Description................................................................................................................................. 18 3.2 Source ........................................................................................................................................ 18 3.3 Detector and Calibration ........................................................................................................... 19 3.4 Benchmark Model ..................................................................................................................... 22 3.5 File Locations with the GADRAS Distribution ............................................................................ 25 3.6 Summary.................................................................................................................................... 26 3.7 References ................................................................................................................................. 26 3.8 Filenames................................................................................................................................... 26 Plutonium Oxide Benchmark .............................................................................................................. 27 4.1 Description................................................................................................................................. 27 4.2 Sources ...................................................................................................................................... 27 4.3 Detector and Calibration ........................................................................................................... 28 4.4 Benchmark Models.................................................................................................................... 30 4.5 Comparison of Measured and Computed Spectra .................................................................... 32 4.6 File Locations with the GADRAS Distribution ............................................................................ 36 4.7 Summary.................................................................................................................................... 37 LLNL Highly Enriched Uranium Sphere Benchmark ............................................................................ 37 5.1 Description................................................................................................................................. 37 5.2 Source ........................................................................................................................................ 37 5.3 Detector and Calibration ........................................................................................................... 38 5.4 Benchmark Model ..................................................................................................................... 41 5.5 File Locations with the GADRAS Distribution ............................................................................ 42 5.6 Summary.................................................................................................................................... 43 5.7 References ................................................................................................................................. 43 5.8 Filenames................................................................................................................................... 43 LLNL Highly Enriched Uranium Sphere in Polyethylene Benchmark .................................................. 44 6.1 Description................................................................................................................................. 44 6.2 Source ........................................................................................................................................ 44 6.3 Detector and Calibration ........................................................................................................... 45 6.4 Benchmark Model ..................................................................................................................... 48 6.5 File Locations with the GADRAS Distribution ............................................................................ 50 6.6 Summary.................................................................................................................................... 50 6.7 References ................................................................................................................................. 50 SNL Natural and Depleted Uranium Spheres and Shell Benchmark................................................... 52 7.1 Description................................................................................................................................. 52 7.2 Sources ...................................................................................................................................... 52 5
Detector and Calibration ........................................................................................................... 55 7.3 7.4 Benchmark Models.................................................................................................................... 58 7.4.1 1‐kg DU Metal Sphere ........................................................................................................... 60 7.4.2 3‐kg DU Metal Sphere ........................................................................................................... 62 7.4.3 3.4‐kg DU Metal Shell............................................................................................................ 64 7.4.4 7.4‐kg U(nat) Metal Sphere................................................................................................... 66 7.5 File Locations with the GADRAS Distribution ............................................................................ 68 7.6 Summary.................................................................................................................................... 68 7.7 References ................................................................................................................................. 68 8 Conclusions ......................................................................................................................................... 69
Figures Figure 2‐1: LLNL plutonium sphere; dimensions are in centimeters (from Gosnell Figure 2b). ................ 10 Figure 2‐2: Barium‐133 detector calibration ............................................................................................. 11 Figure 2‐3: Cesium‐137 detector calibration ............................................................................................. 12 Figure 2‐4: Cobalt‐60 detector calibration................................................................................................. 12 Figure 2‐5: Detector response function parameters ................................................................................. 13 Figure 2‐6: One‐dimensional model .......................................................................................................... 14 Figure 2‐7: Benchmark model compared to Pu Ball measurement........................................................... 15 Figure 2‐8: Benchmark model compared to Pu Ball measurement, 0‐150 keV......................................... 15 Figure 2‐9: Benchmark model compared to Pu Ball measurement, 300‐500 keV .................................... 16 Figure 2‐10: Benchmark model compared to Pu Ball measurement, 500‐800 keV .................................. 16 Figure 3‐ 1: LLNL plutonium sphere; dimensions are in centimeters (from Gosnell Figure 2b) ................ 18 Figure 3‐2: Barium‐133 detector calibration ............................................................................................. 20 Figure 3‐3: Cesium‐137 detector calibration ............................................................................................. 20 Figure 3‐4: Cobalt‐60 detector calibration................................................................................................. 21 Figure 3‐5: Detector response function parameters ................................................................................. 21 Figure 3‐6: One‐dimensional model .......................................................................................................... 22 Figure 3‐7: Benchmark model compared to Pu Ball with polyethylene measurement............................. 23 Figure 3‐8: Benchmark model compared to Pu Ball with polyethylene measurement, 0‐150 keV .......... 24 Figure 3‐9: Benchmark model compared to Pu Ball with polyethylene measurement, 300‐500 keV ...... 24 Figure 3‐10: Benchmark model compared to Pu Ball with polyethylene measurement, 500‐800 keV .... 25 Figure 3‐11: Benchmark model compared to Pu Ball with polyethylene measurement, 2000‐2300 keV 25 Figure 4‐1: Comparison of measured (gray) and computed spectra (red) for the calibration sources..... 29 Figure 4‐2: Detector response function parameters ................................................................................. 30 Figure 4‐3: One‐dimensional model of Known1 ........................................................................................ 31 Figure 4‐4: Comparison of forward calculation (red) with background‐subtracted measured spectrum for Known1..................................................................................................................................... 33 Figure 4‐5: Comparison of forward calculation (red) with background‐subtracted measured spectrum for Known2..................................................................................................................................... 34 Figure 4‐6: Comparison of forward calculation (red) with background‐subtracted measured spectrum for Known3..................................................................................................................................... 35 Figure 4‐7: Comparison of forward calculation (red) with background‐subtracted measured spectrum for Known4..................................................................................................................................... 36 Figure 5‐1: LLNL HEU sphere; dimensions are in centimeters (from Gosnell Figure 2a) ........................... 37 Figure 5‐2: Barium‐133 detector calibration ............................................................................................. 39 Figure 5‐3: Cesium‐137 detector calibration ............................................................................................. 39 Figure 5‐4: Cobalt‐60 detector calibration................................................................................................. 40 Figure 5‐5: Detector response function parameters ................................................................................. 40
6
Figure 5‐6: One‐dimensional model .......................................................................................................... 41 Figure 5‐7: Benchmark model compared to HEU Ball measurement........................................................ 42 Figure 5‐8: Benchmark model compared to HEU Ball measurement, 0‐300 keV...................................... 42 Figure 6‐1: LLNL HEU sphere; dimensions are in centimeters (Gosnell Figure 2a).................................... 44 Figure 6‐2: Barium‐133 detector calibration, model (red), measured (gray) ............................................ 46 Figure 6‐3: Cesium‐137 detector calibration, model (red), measured (gray)............................................ 46 Figure 6‐4: Cobalt‐60 detector calibration, model (red), measured (gray) ............................................... 47 Figure 6‐5: Detector response function parameters ................................................................................. 47 Figure 6‐6: One‐dimensional model .......................................................................................................... 48 Figure 6‐7: Benchmark model (red) compared to HEU Ball measurement (gray)..................................... 49 Figure 6‐8 Benchmark model (red) compared to HEU Ball measurement (gray), 0‐300 keV..................... 50 Figure 7‐1: 1‐kg DU metal sphere measurement geometry ...................................................................... 53 Figure 7‐2: 3‐kg DU metal sphere measurement geometry ...................................................................... 53 Figure 7‐3: 3.4‐kg DU metal shell measurement geometry; the shell has an inside radius of 9.365 cm and a wall thickness of 1.6 mm............................................................................................................. 54 Figure 7‐4: 7.4 kg U(nat) metal sphere measurement geometry .............................................................. 54 Figure 7‐5: Calibration measurement geometry ....................................................................................... 55 Figure 7‐6: Cobalt‐57 detector calibration................................................................................................. 56 Figure 7‐7: Cesium‐137 detector calibration ............................................................................................. 56 Figure 7‐8: Cobalt‐60 detector calibration................................................................................................. 57 Figure 7‐9: Thorium‐228 detector calibration ........................................................................................... 57 Figure 7‐10: Detector response function parameters ............................................................................... 58 Figure 7‐11: 1‐kg DU metal sphere model compared to measurement, 1600 – 2400 keV; the red model shows lines added to the set of Pa234m gamma emissions, the green model shows the spectrum computed using the original ENSDF data ...................................................................................... 59 Figure 7‐12: One‐dimensional model of the 1‐kg DU metal sphere .......................................................... 60 Figure 7‐13: 1‐kg DU metal sphere model compared to measurement.................................................... 61 Figure 7‐14: 1‐kg DU metal sphere model compared to measurement, 0 – 1100 keV ............................. 61 Figure 7‐15: 1‐kg DU metal sphere model compared to measurement, 1100 – 3000 keV ....................... 62 Figure 7‐16: One‐dimensional model of the 3‐kg DU metal sphere .......................................................... 62 Figure 7‐17: 3‐kg DU metal sphere model compared to measurement.................................................... 63 Figure 7‐18: 3‐kg DU metal sphere model compared to measurement, 0 – 1100 keV ............................. 63 Figure 7‐18: 3‐kg DU metal sphere model compared to measurement, 1100 – 3000 keV ....................... 64 Figure 7‐20: One‐dimensional model of the 3.4 kg DU metal shell........................................................... 64 Figure 7‐21: 3.4‐kg DU metal shell model compared to measurement .................................................... 65 Figure 7‐22: 3.4‐kg DU metal shell model compared to measurement, 0 – 1100 keV.............................. 65 Figure 7‐23: 3.4‐kg DU metal shell model compared to measurement, 1100 – 3000 keV........................ 66 Figure 7‐23: One‐dimensional model of the 7.4 kg U(nat) metal sphere .................................................. 66 Figure 7‐25: 7.4‐kg U(nat) metal sphere model compared to measurement ........................................... 67 Figure 7‐26: 7.4‐kg U(nat) metal sphere model compared to measurement, 0 – 1100 keV..................... 67 Figure 7‐27: 7.4‐kg U(nat) metal sphere model compared to measurement, 1100 – 3000 keV............... 68
Tables Table 2‐1: Plutonium sphere isotopics....................................................................................................... 10 Table 2‐2: Calibration sources.................................................................................................................... 11 Table 2‐3: One‐dimensional model parameters ........................................................................................ 14 Table 3‐1: Plutonium sphere isotopics ....................................................................................................... 19 Table 3‐2: Calibration sources .................................................................................................................... 19
7
Table 3‐3: One‐dimensional model parameters ......................................................................................... 23 Table 4‐1: Descriptions of Known1 through Known4 ................................................................................ 28 Table 4‐2: Calibration sources.................................................................................................................... 28 Table 4‐3: Fluorine and the original 236Pu and 241Pu concentrations that were derived from analysis of the gamma‐ray spectra with the assumption that the material age was 20 years for all samples ....................................................................................................................................................... 32 Table 4‐4: Gamma rays emitted by alpha‐neutron reactions with oxygen ............................................... 32 Table 5‐1: HEU sphere isotopics ................................................................................................................ 38 Table 5‐2: Calibration sources.................................................................................................................... 38 Table 5‐3: One‐dimensional model parameters ........................................................................................ 41 Table 6‐1: HEU sphere isotopics ................................................................................................................ 45 Table 6‐2: Calibration sources.................................................................................................................... 45 Table 6‐3: One‐dimensional model parameters ........................................................................................ 49 Table 7‐1: Nominal depleted uranium isotopics........................................................................................ 52 Table 7‐2: Nominal natural uranium isotopics........................................................................................... 52 Table 7‐3: Calibration sources.................................................................................................................... 55 Table 7‐4: Parameters of the 1‐kg DU metal sphere one‐dimensional model .......................................... 60 Table 7‐5: Parameters of the 3‐kg DU metal sphere one‐dimensional model .......................................... 62 Table 7‐6: Parameters of the 3.4‐kg DU metal sphere one‐dimensional model ....................................... 64 Table 7‐7: Parameters of the 7.4 kg U(nat) metal sphere one‐dimensional model .................................. 66
8
1 Introduction The Gamma Detector Response and Analysis Software (GADRAS) is frequently used by radiation spectra analysts, but formal documentation of the validity of the software’s performance is needed. This report, completed in fiscal year 2009, summarizes the comparison of the predictions of GADRAS to a series of experimental benchmarks for relevant radioactive sources. The benchmark data were previously recorded under carefully controlled conditions including careful calibration of the detector, good background measurements, careful source measurement, and documentation of the source dimensions. GADRAS was employed to model the detector response function for each benchmark from the calibration data, a one‐dimensional model (pie chart) was created from the benchmark source dimensions, and a forward calculation of the model’s radiation spectrum was obtained for each benchmark. The following benchmarks are reported and test the GADRAS code’s ability to model the associated radiation physics: •
Weapons‐grade plutonium, 2.38 kg sphere, bare – neutron and photon transport
•
Weapons‐grade plutonium, 2.38 kg sphere in polyethylene – neutron and photon transport and gamma signatures from neutron capture in hydrogen
•
Plutonium oxide, 998 g, 333 g, and 997 g in cylindrical containers – neutron and photon transport and gamma signatures from alpha interactions with oxygen (distinguishes plutonium oxide from plutonium metal)
•
Highly enriched uranium, 2.11 kg sphere, bare – photon transport
•
Highly enriched uranium, 2.11 kg sphere in polyethylene – photon transport and transmission through hydrogenous material
•
Natural uranium, 2.11 kg sphere – electron and photon transport, and Bremsstrahlung photon production
•
Depleted uranium, 1.0 kg and 3.0 kg spheres – electron and photon transport, and Bremsstrahlung photon production
•
Depleted uranium shell, 3.4 kg – electron and photon transport, and Bremsstrahlung photon production
Each of the following sections documents the comparison of the benchmark experimental and GADRAS model data.
9
2 LLNL Plutonium Sphere Benchmark 2.1 Description In February 2008, Lawrence Livermore National Laboratory (LLNL) hosted a series of benchmark measurements of their 2.38 kg plutonium sphere to permit developers of radiation analysis codes to acquire test data. The benchmark tests the ability to correctly simulate plutonium (Pu) metal, which is primarily driven by the code’s ability to accurately model neutron and photon transport. This benchmark does not include previous measurements on the 2.38 kg sphere. The same plutonium sphere was also measured in February 1990. However, in‐situ characterization measurements were not performed in association with the 1990 measurements, so it was necessary to extrapolate characterization data that were made at a different distance and in a different facility.
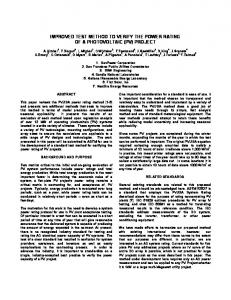
2.2 Source The source is a 2.387 ± 0.013 kg sphere of delta‐phase plutonium metal with a conical section removed. (See Figure 2‐1, Webster and Wong 1976) The outer radius of the plutonium is 3.5 cm, and the sphere is clad by 0.1524 cm of stainless steel. The source was originally constructed in 1979. Original plutonium isotopics are given in Table 2‐1 (Gosnell and Pohl 1999, Hansen, et. al. 1979).
Figure 2‐1: LLNL plutonium sphere; dimensions are in centimeters (from Gosnell Figure 2b). Table 2‐1: Plutonium sphere isotopics
Nuclide Pu‐236
Mass Fraction
Pu‐238
1.414×10‐4
Pu‐239
9.346×10‐1
Pu‐240
5.996×10‐2
Pu‐241
4.935×10‐3
Pu‐242
2.581×10‐4
1.740×10‐10 *
Am‐241 7.198×10‐5 * Pu‐236 trace content computed from GADRAS fit of the data 10
2.3 Detector and Calibration Measurements were collected with an Ortec Detective‐EX100, which is a 12% efficient high purity germanium (HPGe) detector. The activity of each calibration source (Barium‐133, Cesium‐137, and Cobalt‐60) is given in Table 2‐2. Note that each calibration source was measured at a distance of 155 cm from the front face of the detector, which is the same as the distance that was used for measurements of the plutonium sphere. Table 2‐2: Calibration sources Nuclide
Reference Activity Reference Date Calibration Date (μCi) Ba‐133 11.77 01 Aug 1983 27 Feb 2008 Cs‐137 11.51 01 Jun 1986 27 Feb 2008 Co‐60 4000. 10 Oct 1975 27 Feb 2008 * Source identification (ID) in GADRAS
Calibration Source ID 133BA_1R986 137CS_2S285 60CO_B212
Detector response function parameters were estimated from the calibration measurements shown in Figure 2‐2 through Figure 2‐4. Note that in those figures, the measured gamma spectrum is shown in gray, and the spectrum computed for the calibration source is shown in red. Insets in these figures show peaks of interest on an expanded energy scale. The resulting detector response function parameters, estimated from the calibration measurements, are shown in Figure 2‐5. 3
10
3
10
2
10
2
10
1
Counts / keV
10
0
10
1
10
-1
10
50
100
150
200
250
300
350
400
0
10
-1
10
500
1000
1500
Energy (keV) Figure 2‐2: Barium‐133 detector calibration
11
2000
2500
3000
3
10
3
10
2
10
2
10
1
Counts / keV
10
0
10
1
10
-1
10
520
540
560
580
600
620
640
660
680
700
0
10
-1
10
500
1000
1500
2000
2500
3000
Energy (keV)
Figure 2‐3: Cesium‐137 detector calibration 3
10
3
10
2
10
2
Counts / keV
10
1
10
1
10
0
10
1150
1200
1250
1300
1350
1400
0
10
-1
10
500
1000
1500
Energy (keV) Figure 2‐4: Cobalt‐60 detector calibration
12
2000
2500
3000
Figure 2‐5: Detector response function parameters
2.4 Benchmark Model As shown in Figure 2‐1, the geometry of LLNL plutonium sphere is not exactly one‐dimensional. However, in order to correctly model the physical effects dictating the measured gamma spectrum, in this case it is only necessary to preserve the following two properties of the source: • •
Surface area: primarily dictates the photon leakage Plutonium mass: primary dictates the neutron leakage
The one‐dimensional model of the source is shown in Figure 2‐6. Note that the conical section removed from the actual source has been modeled as a central void that preserves the actual source’s surface area and volume. Stainless steel is modeled as iron, at density 7.66 g/cc. Details of the one‐dimensional model parameters are recorded in Table 2‐3. Model plutonium isotopics are the same as listed in Table 2‐1.
13
Figure 2‐6: One‐dimensional model Table 2‐3: One‐dimensional model parameters Shell #
Material (Age)
Density (g/cc)
1
Void
2 3
Plutonium, δ‐phase,29 yrs Iron
1.29×10‐3 15.80 7.66
Inner Radius (cm) 0 1.90 3.50
Outer Radius Mass (kg) (cm) 1.90 3.71×10‐5 3.50 2.384 3.652 0.188
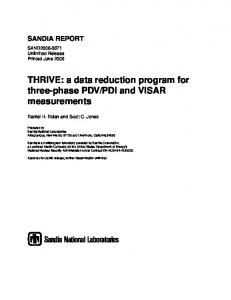
The gamma spectrum calculated for this model is shown in Figure 2‐7, where it is compared to the actual measurement. Note that the measured spectrum is shown in gray, and the computed spectrum is shown in red. For this measurement, the distance from the sphere’s center to the front face of the detector was 155 cm. In this case, there are no significant discrepancies between the benchmark measurement and the model.
14
PuBall bare Sum
live-time(s) = 2820 chi-square = 1.92
7
10
6
10
5
Counts / keV
10
4
10
3
10
2
10
1
10
0
10
-1
10
500
1000
1500
2000
2500
3000
Energy (keV)
Figure 2‐7: Benchmark model compared to Pu Ball measurement Figure 2‐8, Figure 2‐9, and Figure 2‐10 display the data from Figure 2‐7 on an expanded energy scale, in order to display peaks of particular interest in the 0‐150 keV, 300‐500 keV, and 500‐800 keV ranges, respectively. 7
Counts / keV
10
6
10
5
10
4
10
20
40
60
80
100
120
Energy (keV) Figure 2‐8: Benchmark model compared to Pu Ball measurement, 0‐150 keV
15
140
5
Counts / keV
10
4
10
3
10
2
10
320
340
360
380
400
420
440
460
480
500
Energy (keV)
Figure 2‐9: Benchmark model compared to Pu Ball measurement, 300‐500 keV 4
Counts / keV
10
3
10
2
10
1
10
550
600
650
700
750
Energy (keV) Figure 2‐10: Benchmark model compared to Pu Ball measurement, 500‐800 keV
2.5 File Locations with the GADRAS Distribution Data that were recorded in 2008 are distributed with GADRAS in the following folder:
GADRAS\Detector\LLNL\HPGe12%PuBall
Data that were recorded in 1990 are distributed with GADRAS in the following folder:
16
800
GADRAS\Detector\LLNL\HPGe40%SNM
2.6 Summary The preceding benchmark demonstrates that GADRAS is capable of accurately computing the gamma spectrum for plutonium metal.
2.7 References Webster, W., and C. Wong. Measurements of the Neutron Emission Spectra from Spheres of N, O, W, 235U, 238U, and 239Pu, Pulsed by 14‐MeV Neutrons, UCID‐17332. Lawrence‐Livermore National Laboratory, 1976. Gosnell, T.B, and Pohl, B.A. “Spectrum Synthesis—High‐Precision, High‐Accuracy Calculation of HPGe Pulse‐Height Spectra from Thick Actinide Assemblies,” Lawrence‐Livermore National Laboratory, November 1999. Hansen, L.F., Wong, C., Komoto, T.T., Pohl, B.A., Goldberg, E., Howerton, R.J., and Webster, M. Neutron and Gamma‐Ray Spectra from 232TH, 235U, 238U, and 239Pu after Bombardment with 14MeV Neutrons, Nuclear Science and Engineering, 72, 25‐51 (1979).
2.8 Filenames Filename Cal.dat SNM.PCF,1
Path C:\GADRAS\Detector\LLNL\HPGe12%PuBall C:\GADRAS\Detector\LLNL\HPGe12%PuBall
SNM.PCF,3
C:\GADRAS\Detector\LLNL\HPGe12%PuBall
SNM.PCF,5
C:\GADRAS\Detector\LLNL\HPGe12%PuBall
Detector.dat PUBALL‐LLNL‐2008_NEW.1dm
C:\GADRAS\Detector\LLNL\HPGe12%PuBall C:\GADRAS\Detector\LLNL\HPGe12%PuBall
SNM.PCF,7
C:\GADRAS\Detector\LLNL\HPGe12%PuBall
SNM.PCF,14 = sum of 8‐13
C:\GADRAS\Detector\LLNL\HPGe12%PuBall
17
Figure or Table Table 2‐2 Fig. 2‐2 Ba‐133 Fig. 2‐3 Cs‐137 (weak) Fig. 2‐4 Co‐60 Fig. 2‐5 Fig. 2‐6 Table 2‐3 1D model Figs. 2‐2 through 2‐4, 2‐7 through 2‐10 Background, 56,199 seconds Figs. 2‐7 through 2‐10 PuBall bare SUM
3 LLNL Plutonium Sphere in Polyethylene Benchmark 3.1 Description In February 2008, Lawrence Livermore National Laboratory (LLNL) hosted a series of benchmark measurements of their 2.38 kg plutonium sphere to permit developers of radiation analysis codes to acquire test data. The benchmark tests the ability to correctly simulate weapons‐grade plutonium metal in a solid spherical geometry, which is primarily driven by the code’s ability to accurately model neutron and photon transport. It also tests the code’s ability to accurately simulate gamma signatures resulting from neutron capture in hydrogen, which is primarily driven by the code’s ability to correctly calculate secondary gamma production by neutron interactions. The calibration data were collected on 27 Feb 2008 and the Pu ball data were collected on 26 Feb 2008.
3.2 Source The source is a 2.387 ± 0.013 kg sphere of delta‐phase plutonium metal with a conical section removed. (See Figure 3‐1, Webster and Wong 1976) The outer radius of the plutonium is 3.5 cm, and the sphere is clad by 0.1524 cm of stainless steel. The source was originally constructed in 1979. Original plutonium isotopics are given in Table 3‐1 (Gosnell and Pohl 1999, Hansen, et. al. 1979).
Figure 3‐ 1: LLNL plutonium sphere; dimensions are in centimeters (from Gosnell Figure 2b)
18
Table 3‐1: Plutonium sphere isotopics
Nuclide Pu‐236
Mass Fraction
Pu‐238
1.414×10‐4
Pu‐239
9.346×10‐1
Pu‐240
5.996×10‐2
Pu‐241
4.935×10‐3
Pu‐242
2.581×10‐4
1.740×10‐10 *
Am‐241 7.198×10‐5 * Pu‐236 trace content computed from GADRAS fit of the data
3.3 Detector and Calibration Measurements were collected with an Ortec Detective‐EX, which is a 12% efficient high purity germanium (HPGe) detector. The activity of each calibration source (Barium‐133, Cesium‐137, and Cobalt‐60) is given in Table 3‐2. Note that each calibration source was measured at a distance of 155 cm from the front face of the detector, which is the same as the distance that was used for measurements of the plutonium sphere. Table 3‐2: Calibration sources Nuclide
Reference Activity Reference Date Calibration Date (μCi) Ba‐133 11.77 01 Aug 1983 27 Feb 2008 Cs‐137 11.51 01 Jun 1986 27 Feb 2008 Co‐60 4000. 10 Oct 1975 27 Feb 2008 * Source identification (ID) in GADRAS
Calibration Source ID* 133BA_1R986 137CS_2S285 60CO_B212
Detector response function parameters were estimated from the calibration measurements shown in Figure 3‐2 through Figure 3‐4. Note that in those figures, the measured gamma spectrum is shown in gray, and the spectrum computed for the calibration source is shown in red. Insets in these figures show peaks of interest on an expanded energy scale. The resulting detector response function parameters, estimated from the calibration measurements, are shown in Figure 3‐4Figure 2‐5: Detector response function parameters .
19
3
10
3
10
2
10
2
10
1
Counts / keV
10
0
10
1
10
-1
10
50
100
150
200
250
300
350
400
0
10
-1
10
500
1000
1500
2000
2500
3000
Energy (keV)
Figure 3‐2: Barium‐133 detector calibration 3
10
3
10
2
10
2
10
1
Counts / keV
10
0
10
1
10
-1
10
520
540
560
580
600
620
640
660
680
700
0
10
-1
10
500
1000
1500
Energy (keV) Figure 3‐3: Cesium‐137 detector calibration
20
2000
2500
3000
3
10
3
10
2
10
2
Counts / keV
10
1
10
1
10
0
10
1150
1200
1250
1300
1350
1400
0
10
-1
10
500
1000
1500
Energy (keV)
2000
2500
3000
Figure 3‐4: Cobalt‐60 detector calibration
Figure 3‐5: Detector response function parameters
21
3.4 Benchmark Model As shown in Figure 3‐1, the geometry of LLNL plutonium sphere is not exactly one‐dimensional. However, in order to correctly model the physical effects dictating the measured gamma spectrum, in this case it is only necessary to preserve the following two properties of the source: • •
Surface area: primarily dictates the photon leakage Plutonium mass: primarily dictates the neutron leakage
The one‐dimensional model of the source is shown in Figure 3‐6. Note that the conical section removed from the actual source has been modeled as a central void that preserves the actual source’s surface area and volume. The polyethylene shell is modeled as 3.25 inch inner diameter and 5.00 inch outer diameter. The 0.1524 cm stainless steel shell is modeled as iron at a density of 7.66 g/cc. Details of the one‐dimensional model parameters are recorded in Table 3‐3. Model plutonium isotopics are the same as listed in Table 3‐1.
Figure 3‐6: One‐dimensional model
22
Table 3‐3: One‐dimensional model parameters Shell #
Material (Age)
Density (g/cc)
Inner Radius (cm)
1.29×10‐3
1
Void
2
Plutonium, δ‐phase,29 yrs
3
Iron
15.80 7.66 ‐3
Outer Radius Mass (kg) (cm)
0
1.90
3.71×10‐5
1.90
3.50
2.384
3.50
3.652
0.188
8.255
2.78×10‐3
4
Void
1.29×10
3.65
5
Polyethylene (PE)
0.95
8.255
12.70
5.913
The gamma spectrum calculated for this model is shown in Figure 3‐7, where it is compared to the actual measurement. Note that the measured spectrum is shown in gray, and the computed spectrum is shown in red. For this measurement, the distance from the sphere’s center to the front face of the detector was 155 cm. In this case, there are no significant discrepancies between the benchmark measurement and the model.
PuBall in PE
live-time(s) = 300.00 chi-square = 1.07
5
10
4
10
3
Counts / keV
10
2
10
1
10
0
10
-1
10
-2
10
500
1000
1500
2000
2500
Energy (keV)
3000
Figure 3‐7: Benchmark model compared to Pu Ball with polyethylene measurement Figure 3‐8 through Figure 3‐11 display the data from Figure 3‐7 on an expanded energy scale, in order to display peaks of particular interest in the 0‐150 keV, 300‐500 keV, 500‐800 keV and 2000‐2300 keV ranges, respectively.
23
6
Counts / keV
10
5
10
4
10
3
10
20
40
60
80
100
120
140
Energy (keV)
Figure 3‐8: Benchmark model compared to Pu Ball with polyethylene measurement, 0‐150 keV 4
Counts / keV
10
3
10
2
10
1
10
320
340
360
380
400
420
Energy (keV)
440
460
480
500
Figure 3‐9: Benchmark model compared to Pu Ball with polyethylene measurement, 300‐500 keV
24
3
Counts / keV
10
2
10
1
10
0
10
550
600
650
700
750
800
Energy (keV)
Figure 3‐10: Benchmark model compared to Pu Ball with polyethylene measurement, 500‐800 keV 1
Counts / keV
10
0
10
-1
10
-2
10
2050
2100
2150
2200
2250
Energy (keV)
2300
Figure 3‐11: Benchmark model compared to Pu Ball with polyethylene measurement, 2000‐2300 keV
3.5 File Locations with the GADRAS Distribution Data that were recorded in 2008 are distributed with GADRAS in the following folder:
GADRAS\Detector\LLNL\HPGe12%PuBall 25
3.6 Summary The preceding benchmark demonstrates that GADRAS is capable of accurately computing the gamma spectrum for plutonium metal, moderated with polyethylene.
3.7 References Webster, W., and C. Wong. Measurements of the Neutron Emission Spectra from Spheres of N, O, W, 235U, 238U, and 239Pu, Pulsed by 14‐MeV Neutrons, UCID‐17332. Lawrence‐Livermore National Laboratory, 1976. Gosnell, T.B, and Pohl, B.A. “Spectrum Synthesis—High‐Precision, High‐Accuracy Calculation of HPGe Pulse‐Height Spectra from Thick Actinide Assemblies,” Lawrence‐Livermore National Laboratory, November 1999. Hansen, L.F., Wong, C., Komoto, T.T., Pohl, B.A., Goldberg, E., Howerton, R.J., and Webster, M. Neutron and Gamma‐Ray Spectra from 232TH, 235U, 238U, and 239Pu after Bombardment with 14MeV Neutrons, Nuclear Science and Engineering, 72, 25‐51 (1979).
3.8 Filenames Filename Cal.dat SNM.PCF,1
Path C:\GADRAS\Detector\LLNL\HPGe12%PuBall C:\GADRAS\Detector\LLNL\HPGe12%PuBall
SNM.PCF,3
C:\GADRAS\Detector\LLNL\HPGe12%PuBall
SNM.PCF,5
C:\GADRAS\Detector\LLNL\HPGe12%PuBall
Detector.dat PUBALL‐LLNL‐2008‐ PE_NEW2.1dm
C:\GADRAS\Detector\LLNL\HPGe12%PuBall C:\GADRAS\Detector\LLNL\HPGe12%PuBall
SNM.PCF,7
C:\GADRAS\Detector\LLNL\HPGe12%PuBall
SNM.PCF,15
C:\GADRAS\Detector\LLNL\HPGe12%PuBall
26
Figure or Table Table 3‐2 Fig. 3‐2 Ba‐133 Fig. 3‐3 Cs‐137 (weak) Fig. 3‐4 Co‐60 Fig. 3‐5 Fig. 3‐6 Table 3‐3 1D model Figs. 3‐2 through 3‐4, 3‐7 though 3‐ 11, Background, 56,199 seconds Figs. 3‐7 through 3‐11 Pu Ball in PE
4 Plutonium Oxide Benchmark 4.1 Description Gamma‐ray measurements of three containers of plutonium oxide were recorded in April and May of 2002. The HPGe detector had an efficiency of 109% relative to a 3″x3″ NaI detector at 1332 keV. The mass of the plutonium oxide was approximately 1 kg for two of the containers and the mass was 332 grams for the third container. These sources are referred to as Known1, Known2, and Known4. A spectrum for a nominal 1‐kg sample of metallic plutonium, which is referred to as Known3, was also recorded during the same series of measurements. This benchmark tests the ability to correctly compute spectra for plutonium oxide. The configurations of the oxide sources and the measurement facility are less than ideal, but the measurements still serve the purpose of testing the ability to compute gamma rays associated with alpha interactions with oxygen, which are the main features that distinguish plutonium oxide from metallic plutonium. Deficiencies that are associated with these measurements relative to what is desirable for benchmark measurements are listed below: •
•
•
The plutonium oxide was contained in cylindrical containers. The height of the material was approximately the same as the diameter of the container for each of the sources, so the oxide can be approximated by spherical configuration. It would have been preferable if the sources were actually formed into spheres. The measurements were recorded in a small room with thick concrete walls. This environment produced an unusually high amount of neutron reflection. Consequently, the continuum that is produced by interactions of low‐energy neutrons with the HPGe detector was elevated. Gamma rays derived from neutron capture by hydrogen and iron in the concrete were also evident in the spectra. The detector was characterized in a different room and at a different distance than the distance at which the plutonium oxide samples were measured.
4.2 Sources Table 4‐1 describes the three plutonium oxide samples and the metallic plutonium sample. The height of the plutonium oxide was approximately the same as the diameter of the container for all of the oxide samples. The concentrations of 240Pu are known for each of the samples, but concentrations of other plutonium isotopes were estimated from the gamma‐ray spectra or, in the case of 242Pu, from isotopic analysis of other samples with similar 240Pu concentrations. The exact dimensions of the containers are not known.
27
Table 4‐1: Descriptions of Known1 through Known4 Mass (grams)
240
Pu (wt. %)
Packaging
Source
Form
Known1
Oxide
998
16.14%
The PuO2 was inside a 2‐ to 3‐mm‐thick steel can, which was contained in a plastic bag to control contamination. The bagged can was contained in another 2‐ to 3‐mm thick steel can.
Known2
Oxide
332.7
10.12%
The PuO2 was inside a 2‐ to 3‐mm‐thick steel can.
Known3
Metallic
953
5.8
The metallic plutonium was inside in a 2‐ to 3‐mm‐ thick steel can.
Known4
Oxide
997
5.8
The PuO2 was inside a 2‐ to 3‐mm‐thick steel can.
4.3 Detector and Calibration The HPGe detector was calibrated at a distance of 51 cm within a large bay. A tin and copper filter was placed in front of the detector to attenuate low‐energy gamma rays. The detector was surrounded by a cylindrical bismuth shield that was approximately 1 inch thick. Table 4‐2 lists activities of the calibration sources on the date measurements were performed. Table 4‐2: Calibration sources Nuclide
Activity (μCi) 0.491 7.45 9.94 5.88 8.38
57
Co Ba 137 Cs 60 Co 152 Eu
133
Detector response function parameters were determined by characterizing the detector using GADRAS Version 15.3.8. Comparisons of measured versus computed spectra for the calibration sources are presented in Fig. 4‐1. The detector response parameters that were derived from the characterization measurements are shown in the screen capture that is presented in Fig. 4‐2.
28
Co-57 @ 51 cm
Ba-133 @ 51 cm
live-time(s) = 589.16 chi-square = 0.56
4
10
10
102
103
Counts / Channel
Counts / Channel
3
101
0
10
10-1
1
10
-1
60
80
100
120
140
160
180
10
200
Energy (keV)
100
200
300
400
Co-60 @ 51 cm
live-time(s) = 591.03 chi-square = 0.58
500
Energy (keV)
Cs-137 @ 51 cm 4
live-time(s) = 588.01 chi-square = 0.76
4
10
10
103
103
Counts / Channel
Counts / Channel
102
100
-2
10
live-time(s) = 591.85 chi-square = 0.69
102
1
10
100
102
1
10
100
-1
-1
10
200
400
600
800
10
1000
Energy (keV)
Eu-152 @ 51 cm
200
400
600
800
1000
1200
1400
1600
1800
Energy (keV)
live-time(s) = 588.77 chi-square = 0.74
4
10
Counts / Channel
103
102
1
10
100
-1
10
200
400
600
800
1000
1200
Energy (keV)
1400
1600
1800
2000
Figure 4‐1: Comparison of measured (gray) and computed spectra (red) for the calibration sources
29
2000
Figure 4‐2: Detector response function parameters
4.4 Benchmark Models Descriptions of the source configurations are incomplete, so estimates were made in order to create one‐dimensional models of the sources. Neither the can diameters nor the material densities are known exactly, so the assumption was made that the density of each of these samples is equal to 3 g/cc, which is typical of plutonium oxide unless an effort is made to compress the material. The sources were then modeled as solid spheres with diameters that were selected to give the proper masses of the plutonium oxide. Figure 4‐3 shows the one‐dimensional model for Known1, which is the double‐canned plutonium oxide sample.
30
Figure 4‐3: One‐dimensional model of Known1 The ages of the oxides are not known, so it was assumed that all samples were 20 years old. The initial concentrations of 236Pu were estimated to give the proper intensities for the 2614‐keV photopeaks from the 208Tl daughter. The initial 241Pu concentrations were estimated by fitting the intensities of peaks from 241Am, which is a daughter of 241Pu. The fluorine concentrations were estimated from the intensities of peaks at 1275 keV. Another factor that was accommodated in spectral calculations was the observation that the high‐ energy continuum, which is produced by interactions of neutrons with the HPGe detector, was much higher than the intensity that is observed in most environments. There are two factors that contributed to this observation. One factor is that 252Cf must have been present in the facility because peaks at 1435.8 and 1596.2 keV were observed, and 252Cf is the only isotope that could have produced peaks at these energies with the observed intensity ratio. The location of the 252Cf source is not known, and it may have been stored in an adjacent room. The background spectrum, which was recorded in another location, did not exhibit peaks at 1435.8 and 1596.2 keV. The high‐energy continuum would also have been enhanced because the thick concrete walls, floor and ceiling would have produced considerably more neutron reflection than a typical environment. These factors were accommodated by including 252 Cf as an independent source term, and a neutron reflection scalar that is one of the gamma‐ray response function parameters was also adjusted to fit the spectra. Table 3 lists the fluorine concentration, the initial 236Pu and 241Pu concentrations, and the neutron scalar terms that were derived in this way.
31
Table 4‐3: Fluorine and the original 236Pu and 241Pu concentrations that were derived from analysis of the gamma‐ray spectra with the assumption that the material age was 20 years for all samples Source Known1 Known2 Known3 Known4
Distance (cm) 159 101 143 *115
236
Pu (wt. %) 4.5e‐8 7.0e‐9 1.0e‐8 1.7‐8
Fluorine (ppm) 1700 350 100 400
24i
Pu (wt. %) 2.0 0.7 0.3 0.5
Neutron Scalar 20 10 17 12
* One log file indicates that the distance was 101 cm and another file lists the distance as 156 cm. Since this discrepancy was not resolved, the distance that gave the best fit to the spectrum (115 cm) was applied.
The computed spectra for the plutonium samples exhibited neutron capture peaks for hydrogen, iron and copper. The radiation sources that were modeled for the plutonium oxide and plutonium metal samples would not have produced these features with the observed intensities, but that neutron interactions with concrete and steel rebar could have produced most of this emission. Neutron capture by copper in the cryostat was the probable source for neutron capture by copper. The forward calculations compensate by adding components to reproduce the features associated with neutron capture by hydrogen, iron and copper. The yields of gamma rays derived from alpha interactions with oxygen that are used by the radiation transport code were derived from measurements that are reported in this document. The yields, which are represented as gamma per neutron from alpha‐n reactions, are listed in Table 4. The yields are estimated to be accurate to within about 25%. Emission at 870.7 keV is observed in almost all plutonium oxide samples. The intensity of this emission, which is produced by the 14N(α,p)17O reaction, varies with the processing and storage of the material. The intensity that is listed in Table 4‐4 is an average of the best fits for the three plutonium oxide samples. Table 4‐4: Gamma rays emitted by alpha‐neutron reactions with oxygen Target Nucleus 14
N 18 O 17 O 18 O 18 O
Gamma‐Ray Energy (keV) 870.7 1395.1 1633.8 2438.0 2789.5
Intensity (gammas/neutron) 0.28 0.12 0.44 0.029 0.013
Doppler broadened No Yes No No No
4.5 Comparison of Measured and Computed Spectra Figures 4 through 7 compare computed spectra with measurements for the four “Known” samples. The measurements are represented by gray spectra and the computed spectra are shown in red. Each figure shows six energy ranges, which exhibits the entire spectra as well as segments that are associated with gamma rays emitted by alpha‐oxygen interactions. The alpha‐oxygen gamma rays are absent in spectra that are shown in Fig. 6, which corresponds to the metallic plutonium sample. The agreement between measured and computed spectra is generally good after compensating for the neutron‐induced continua
32
and neutron capture reactions by materials in the measurement facility. However, the intensities of x‐ rays in the computed spectra for the plutonium oxide sampled were consistently greater that measured intensities, whereas the x‐ray intensity was accurate for the metallic plutonium sample. The cause for this discrepancy will be investigated in future work. (a)
(b) 6
6
10
10
105
Counts / Channel
Counts / Channel
105 4
10
103 102 1
10
104
3
10
102 100 -1
1
10
2000
4000
6000
8000
10
10000
Energy (keV)
600
800
1000
Energy (keV)
500
250
400
200
Counts / Channel
Counts / Channel
400
(d)
(c)
300
200
100
150
100
50
0
1360
1380
1400
1420
0
1440
Energy (keV)
1610
1620
1630
1640
1650
1660
2800
2810
2820
Energy (keV)
(f)
(e) 100
60
50
Counts / Channel
80
Counts / Channel
200
60
40
20
0
40
30
20
10
2410
2420
2430
2440
2450
Energy (keV)
2460
2470
0
2480
2770
2780
2790
Energy (keV)
Figure 4‐4: Comparison of forward calculation (red) with background‐subtracted measured spectrum for Known1
33
(a)
(b) 6
6
10
10
105 105
Counts / Channel
Counts / Channel
104 3
10
102 1
10
100
104
3
10
102
10-1 -2
1
10
2000
4000
6000
8000
10
10000
Energy (keV)
(c)
600
800
1000
(d) 60
50
Counts / Channel
80
Counts / Channel
400
Energy (keV)
100
60
40
20
40
30
20
10
0
1360
1380
1400
1420
0
1440
Energy (keV)
1610
1620
1630
1640
1650
1660
2800
2810
2820
Energy (keV)
(f)
(e) 35
16
30
14 12
25
Counts / Channel
Counts / Channel
200
20
15
10
8 6 4
5
0
10
2
2410
2420
2430
2440
2450
Energy (keV)
2460
2470
0
2480
2770
2780
2790
Energy (keV)
Figure 4‐5: Comparison of forward calculation (red) with background‐subtracted measured spectrum for Known2
34
(b)
(a) 6
6
10
10
105 105
Counts / Channel
Counts / Channel
104 3
10
102 1
10
100
104
3
10
102
10-1 -2
1
10
2000
4000
6000
8000
10
10000
Energy (keV)
600
800
1000
Energy (keV)
100
60
50
Counts / Channel
80
Counts / Channel
400
(d)
(c)
60
40
20
40
30
20
10
0
1360
1380
1400
1420
0
1440
Energy (keV)
1610
1620
1630
1640
1650
1660
2800
2810
2820
Energy (keV)
(f)
(e) 30
14
12
Counts / Channel
25
Counts / Channel
200
20
15
10
5
0
10
8
6
4
2
2410
2420
2430
2440
2450
Energy (keV)
2460
2470
0
2480
2770
2780
2790
Energy (keV)
Figure 4‐6: Comparison of forward calculation (red) with background‐subtracted measured spectrum for Known3
35
(a)
(b) 6
6
10
10
105
4
10
Counts / Channel
Counts / Channel
105
103 102 101
104
103
100 -1
2
10
2000
4000
6000
8000
10
10000
Energy (keV)
(c)
400
600
800
1000
Energy (keV)
(d) 180
160
160
140
140
120
Counts / Channel
Counts / Channel
200
120 100 80 60
100 80 60 40
40
20
20 0
1360
1380
1400
1420
0
1440
Energy (keV)
1610
1620
1630
1640
1650
1660
2800
2810
2820
Energy (keV)
(f)
(e) 100
40 35
80
Counts / Channel
Counts / Channel
30
60
40
25 20 15 10
20 5 0
2410
2420
2430
2440
2450
2460
2470
Energy (keV)
0
2480
2770
2780
2790
Energy (keV)
Figure 4‐7: Comparison of forward calculation (red) with background‐subtracted measured spectrum for Known4
4.6 File Locations with the GADRAS Distribution The data for this benchmark are distributed with GADRAS in the following folder:
GADRAS\Detector\Benchmark\PuO2
36
4.7 Summary The preceding benchmark demonstrates that GADRAS is capable of computing accurate spectra for plutonium oxide, particularly for features associated with alpha‐oxygen interactions. However, the source configurations and the measurement facility were not ideally suited for benchmark measurements. Access to more suitable benchmark measurements is desirable.
5 LLNL Highly Enriched Uranium Sphere Benchmark 5.1 Description In January 2009, Lawrence Livermore National Laboratory (LLNL) hosted a series of benchmark measurements of their 2.11 kg uranium sphere to permit developers of radiation analysis codes to acquire test data. This benchmark tests the ability to correctly simulate highly enriched uranium (HEU) metal in a solid spherical geometry, which is primarily driven by the code’s ability to accurately model photon transport. Calibration data were acquired on 20 Jan 2009, and HEU measurements were made on 21 Jan 2009.
5.2 Source The source is a 2.112 kg sphere of highly enriched (> 93% U‐235) uranium metal with a conical section removed. (See Figure 5‐1, Webster and Wong 1976) The outer radius of the uranium is 3.15 cm. The source was originally constructed in 1979. Original uranium isotopics are given in Table 5‐1 (Gosnell and Pohl 1999, Hansen, et. al. 1979).
Figure 5‐1: LLNL HEU sphere; dimensions are in centimeters (from Gosnell Figure 2a)
37
Table 5‐1: HEU sphere isotopics Nuclide
Mass Fraction
U‐232
8.0E‐11 *
U‐234
9.951E‐03
U‐235
9.324E‐01
U‐236
6.022E‐03
U‐238
5.162E‐02
Ra‐226 3.0E‐10** * trace U‐232 computed from GADRAS fit of the HEU spectra ** trace Ra‐226 computed from GADRAS fit on the HEU spectra
U‐232 is produced in reactors and is present in American HEU. When uranium is mined, most of the Ra‐226 is chemically separated, but traces of Ra‐226 remain and become incorporated into HEU.
5.3 Detector and Calibration Measurements were collected with an Ortec Detective‐EX100, which is a 12% efficient high purity germanium (HPGe) detector. The activity of each calibration source (Barium‐133, Cesium‐137, and Cobalt‐60) is given in Table 5‐2. Note that each calibration source was measured at a distance of 101. cm from the front face of the detector, which is the same as the distance used for measurements of the uranium sphere. The Barium and Cesium calibration sources are the same as used in the Feb 2008 plutonium ball benchmark. Table 5‐2: Calibration sources Nuclide
Reference Activity (μCi) Reference Date Calibration Date Calibration Source ID Ba‐133 11.77 01 Aug 1983 20 Jan 2009 133BA_1R986 Cs‐137 11.51 01 Jun 1986 20 Jan 2009 137CS_2S285 Co‐60 12.05 01 Jun 1986 20 Jan 2009 60CO_2U256 * Source identification (ID) in GADRAS
Detector response function parameters were estimated from the calibration measurements shown in Figure 5‐2 through Figure 5‐4. Note that in those figures, the measured gamma spectrum is shown in gray, and the spectrum computed for the calibration source is shown in red. Insets in these figures show peaks of interest on an expanded energy scale. The resulting detector response function parameters, estimated from the calibration measurements, are shown in Figure 5‐5.
38
10
Counts / keV
10
10
10
4 10
3 10
3
10
2
2
1 10
10
10
4
1
50
100
150
200
250
300
0
-1
500
1000
1500
2000
2500
3000
Energy (keV)
Figure 5‐2: Barium‐133 detector calibration 10
4
Counts / keV
10
10
3
10
2
10
10
10
10
10
3
2
1
1 10
10
4
0
520
540
560
580
620
640
660
680
700
0
-1
500
1000
1500
Energy (keV) Figure 5‐3: Cesium‐137 detector calibration
600
39
2000
2500
3000
10
3 10
10
10
Counts / keV
10
10
1
0
1 10
10
2
2 10
10
3
-1
1150
1200
1250
1300
1350
1400
0
-1
500
1000
1500
2000
2500
3000
Energy (keV)
Figure 5‐4: Cobalt‐60 detector calibration
Figure 5‐5: Detector response function parameters
40
5.4 Benchmark Model As shown in Figure 5‐1, the geometry of LLNL HEU sphere is not exactly one‐dimensional. However, in order to correctly model the physical effects dictating the measured gamma spectrum, in this case it is only necessary to preserve the following property of the source: • Surface area: primarily dictates the photon leakage The one‐dimensional model of the source is shown in Figure 5‐6. Note that the conical section removed from the actual source has been modeled as a central void that preserves the actual source’s surface area and volume. Stainless steel is modeled as iron at density 7.66 g/cc. Details of the one‐dimensional model parameters are recorded in 5‐3. Model HEU isotopics are the same as listed in Table 5‐1.
Figure 5‐6: One‐dimensional model
Table 5‐3: One‐dimensional model parameters Shell # 1 2 3
Material (Age) Void HEU,30 yrs Iron
Density (g/cc) ‐3
1.29×10 18.95 7.66
Inner Radius (cm) Outer Radius (cm) 0 1.67 1.67 3.151
3.151 3.303
Mass (kg) 2.52×10‐5 2.114 0.153
The gamma spectrum calculated for this model is shown in Figure 5‐7, where it is compared to the actual measurement. Note that the measured spectrum is shown in gray, and the computed spectrum is shown in red. For this measurement, the distance from the sphere’s center to the front face of the detector was 101. cm. In this case, there are no significant discrepancies between the benchmark measurement and the model.
41
HEUBall Sum of Rec. 6-8
live-time(s) = 5142 chi-square = 1.70
6
10
5
10
4
Counts / keV
10
3
10
2
10
1
10
0
10
-1
10
500
1000
1500
2000
2500
3000
Energy (keV)
Figure 5‐7: Benchmark model compared to HEU Ball measurement Figure 5‐8 displays the data from Figure 5‐7 on an expanded energy scale, in order to display peaks of particular interest in the 0‐300 keV. 6
10
5
Counts / keV
10
4
10
3
10
2
10
1
10
50
100
150
200
250
Energy (keV)
Figure 5‐8: Benchmark model compared to HEU Ball measurement, 0‐300 keV
5.5 File Locations with the GADRAS Distribution Data that were recorded in 2008 are distributed with GADRAS in the following folder:
GADRAS\Detector\LLNL\DetectiveEX100
42
300
5.6 Summary The preceding benchmark demonstrates that GADRAS is capable of accurately computing the gamma spectrum for highly enriched uranium metal.
5.7 References Webster, W., and C. Wong. Measurements of the Neutron Emission Spectra from Spheres of N, O, W, 235U, 238U, and 239Pu, Pulsed by 14‐MeV Neutrons, UCID‐17332. Lawrence‐Livermore National Laboratory, 1976. Gosnell, T.B, and Pohl, B.A. “Spectrum Synthesis—High‐Precision, High‐Accuracy Calculation of HPGe Pulse‐Height Spectra from Thick Actinide Assemblies,” Lawrence‐Livermore National Laboratory, November 1999. Hansen, L.F., Wong, C., Komoto, T.T., Pohl, B.A., Goldberg, E., Howerton, R.J., and Webster, M. Neutron and Gamma‐Ray Spectra from 232TH, 235U, 238U, and 239Pu after Bombardment with 14MeV Neutrons, Nuclear Science and Engineering, 72, 25‐51 (1979).
5.8 Filenames Filename Cal.dat CAL.PCF,1
Path C:\GADRAS\Detector\LLNL\DetectiveEX100 C:\GADRAS\Detector\LLNL\DetectiveEX100
CAL.PCF,4
C:\GADRAS\Detector\LLNL\DetectiveEX100
CAL.PCF,2
C:\GADRAS\Detector\LLNL\DetectiveEX100
CAL.PCF,5
C:\GADRAS\Detector\LLNL\DetectiveEX100
Detector.dat HEBALL_NEW.1dm
C:\GADRAS\Detector\LLNL\DetectiveEX100 C:\GADRAS\Detector\LLNL\DetectiveEX100
CAL.PCF,9
C:\GADRAS\Detector\LLNL\DetectiveEX100
43
Figure or Table Table 5‐2 Fig. 5‐2 Ba‐133 Fig. 5‐3 Cs‐137 (weak) Fig. 5‐4 Co‐60 Fig. 5‐2 through 5‐4, 5‐7 through 5‐11 Background 54,080 seconds Fig. 5‐5 Fig. 5‐6 Table 5‐3 1D model Figs. 5‐7 through 5‐11 HEUBall bare SUM
6 LLNL Highly Enriched Uranium Sphere in Polyethylene Benchmark 6.1 Description In January 2009, Lawrence Livermore National Laboratory (LLNL) hosted a series of benchmark measurements of their 2.1 kg uranium sphere with polyethylene shielding to permit developers of radiation analysis codes to acquire test data. This benchmark tests the ability to correctly simulate highly enriched uranium (HEU) metal in a solid spherical geometry, which is primarily driven by the code’s ability to accurately model photon transport. It also tests the code’s ability to accurately simulate photon transmission through hydrogenous and metallic shielding materials, which is also primarily driven by the code’s ability to accurately model photon transport. Calibration data were acquired on 20 Jan 2009, and HEU measurements were made on 21 Jan 2009.
6.2 Source The source is a 2.112 kg sphere of highly enriched (> 93% U‐235) uranium metal with a conical section removed. (See Figure 6‐1, Webster and Wong 1976) The outer radius of the uranium is 3.15 cm. The source was originally constructed in 1979. Original uranium isotopics are given in (Gosnell and Pohl 1999, Hansen, et. al. 1979).
Figure 6‐1: LLNL HEU sphere; dimensions are in centimeters (Gosnell Figure 2a).
44
Table 6‐1: HEU sphere isotopics
Nuclide Mass Fraction U‐232 8.0E‐11 * U‐234 9.951E‐03 U‐235 9.324E‐01 U‐236 6.022E‐03 U‐238 5.162E‐02 Ra‐226 3.0E‐10** * trace U232 computed from GADRAS fit of the HEU spectra ** trace RA226 computed from GADRAS fit on the HEU spectra
U‐232 is produced in reactors and is present in American HEU. When uranium is mined, most of the Ra‐ 226 is chemically separated, but traces of Ra‐226 remain and become incorporated into HEU.
6.3 Detector and Calibration Measurements were collected with an Ortec Detective‐EX100, which is a 12% efficient high purity germanium (HPGe) detector. The activity of each calibration source (Barium‐133, Cesium‐137, and Cobalt‐60) is given in Table 6‐2. Note that each calibration source was measured at a distance of 101 cm from the front face of the detector, which is the same as the distance that was used for measurements of the uranium sphere. The Barium and Cesium calibration sources are the same as used in the Feb 2008 Plutonium ball benchmark. Table 6‐2: Calibration sources Nuclide
Reference Activity (μCi)
Ba‐133 11.77 Cs‐137 11.51 Co‐60 12.05 * Source identification (ID) in GADRAS
Reference Date Calibration Date 01 Aug 1983 01 Jun 1986 01 Jun 1986
20 Jan 2009 20 Jan 2009 20 Jan 2009
Calibration Source Model 133BA_1R986 137CS_2S285 60CO_2U256
Detector response function parameters were estimated from the calibration measurements shown in Figure 6‐2 through Figure 6‐4. Note that in those figures, the measured gamma spectrum is shown in gray, and the spectrum computed for the calibration source is shown in red. Insets in these figures show peaks of interest on an expanded energy scale. The resulting detector response function parameters, estimated from the calibration measurements, are shown in Figure 6‐5.
45
10
Counts / keV
10
10
10
4 10
3 10
3
10
2
2
1 10
10
10
4
1
50
100
150
200
250
300
0
-1
500
1000
1500
2000
2500
3000
Energy (keV)
Figure 6‐2: Barium‐133 detector calibration, model (red), measured (gray) 10
4
Counts / keV
10
10
3
10
2
10
10
10
10
10
3
2
1
1 10
10
4
0
520
540
560
580
600
620
640
680
700
0
-1
500
1000
1500
2000
Energy (keV) Figure 6‐3: Cesium‐137 detector calibration, model (red), measured (gray)
660
46
2500
3000
10
3 10
10
10
Counts / keV
10
10
1
0
1 10
10
2
2 10
10
3
-1
1150
1200
1250
1300
1350
1400
0
-1
500
1000
1500
2000
2500
3000
Energy (keV)
Figure 6‐4: Cobalt‐60 detector calibration, model (red), measured (gray)
Figure 6‐5: Detector response function parameters
47
6.4 Benchmark Model As shown in Figure 6‐1, the geometry of LLNL HEU sphere is not exactly one‐dimensional. However, in order to correctly model the physical effects dictating the measured gamma spectrum, in this case it is only necessary to preserve the following property of the source: • Surface area: primarily dictates the photon leakage The one‐dimensional model of the source is shown in Figure 6‐6. Note that the conical section removed from the actual source has been modeled as a central void that preserves the actual source’s surface area and volume. Stainless steel was modeled as iron at density 7.66 g/cc. Details of the one‐ dimensional model parameters are recorded in Table 6‐3. Model HEU isotopics are the same as listed in Table 6‐1.
Figure 6‐6: One‐dimensional model
48
Table 6‐3: One‐dimensional model parameters Shell # 1 2 3 4 5
Material (Age) Density (g/cc) Inner Radius (cm) 0 Void 1.29×10‐3 HEU,30 yrs 18.95 1.67 Iron 7.66 3.151 ‐3 3.303 Void 1.29×10 Polyethylene 0.95 8.255
Outer Radius (cm) 1.67 3.151 3.303 8.255 12.70
Mass (kg) 2.52×10‐5 2.114 0.153 2.85E‐3 5.912
The gamma spectrum calculated for this model is shown in Figure 6‐7, where it is compared to the actual measurement. Note that the measured spectrum is shown in gray, and the computed spectrum is shown in red. For this measurement, the distance from the sphere’s center to the front face of the detector was 101 cm. In this case, there are no significant discrepancies between the benchmark measurement and the model.
HEUBallPE, sum of 15-17
live-time(s) = 3300 chi-square = 1.12
5
10
4
Counts / keV
10
3
10
2
10
1
10
0
10
-1
10
500
1000
1500
2000
2500
Energy (keV)
3000
Figure 6‐7: Benchmark model (red) compared to HEU Ball measurement (gray) Figure 6‐8 displays the data from Figure 6‐7 on an expanded energy scale, in order to display peaks of particular interest in the 0‐300 keV.
49
6
10
5
Counts / keV
10
4
10
3
10
2
10
1
10
50
100
150
200
250
300
Energy (keV)
Figure 6‐8 Benchmark model (red) compared to HEU Ball measurement (gray), 0‐300 keV
6.5 File Locations with the GADRAS Distribution Data that were recorded in 2008 are distributed with GADRAS in the following folder:
GADRAS\Detector\LLNL\DetectiveEX100
6.6 Summary The preceding benchmark demonstrates that GADRAS is capable of accurately computing the gamma spectrum for highly enriched uranium metal.
6.7 References Webster, W., and C. Wong. Measurements of the Neutron Emission Spectra from Spheres of N, O, W, 235U, 238U, and 239Pu, Pulsed by 14‐MeV Neutrons, UCID‐17332. Lawrence‐Livermore National Laboratory, 1976. Gosnell, T.B, and Pohl, B.A. “Spectrum Synthesis—High‐Precision, High‐Accuracy Calculation of HPGe Pulse‐Height Spectra from Thick Actinide Assemblies,” Lawrence‐Livermore National Laboratory, November 1999. Hansen, L.F., Wong, C., Komoto, T.T., Pohl, B.A., Goldberg, E., Howerton, R.J., and Webster, M. Neutron and Gamma‐Ray Spectra from 232TH, 235U, 238U, and 239Pu after Bombardment with 14MeV Neutrons, Nuclear Science and Engineering, 72, 25‐51 (1979).
50
Filenames Cal.dat CAL.PCF,1
Filename
Path C:\GADRAS\Detector\LLNL\DetectiveEX100 C:\GADRAS\Detector\LLNL\DetectiveEX100
CAL.PCF,4
C:\GADRAS\Detector\LLNL\DetectiveEX100
CAL.PCF,2
C:\GADRAS\Detector\LLNL\DetectiveEX100
CAL.PCF,5
C:\GADRAS\Detector\LLNL\DetectiveEX100
Detector.dat HEUBALLPE_NEW.1dm
C:\GADRAS\Detector\LLNL\DetectiveEX100 C:\GADRAS\Detector\LLNL\DetectiveEX100
CAL.PCF,18
C:\GADRAS\Detector\LLNL\DetectiveEX100
51
Figure or Table Table 6‐2 Fig. 6‐2 Ba‐133 Fig. 6‐3 Cs‐137 (weak) Fig. 6‐4 Co‐60 Fig. 6‐2 to 6‐4, 6‐7 to 6‐11 Background 54,080 seconds Fig. 6‐5 Fig. 6‐6 Table 6‐3 1D model Figs. 6‐7 to 6‐11 HEUBall in PE SUM
7 SNL Natural and Depleted Uranium Spheres and Shell Benchmark 7.1 Description In June 2005, Sandia National Laboratories (SNL) conducted a series of benchmark measurements of uranium spheres and shells to acquire test data. The sources that were measured were: • • • •
1‐kg depleted uranium metal sphere 3‐kg depleted uranium metal sphere 3.4‐kg depleted uranium shell 7.4‐kg natural uranium metal sphere
This benchmark tests the ability to correctly simulate depleted and natural uranium metal in solid spherical and spherical shell geometries, which is primarily driven by the code’s ability to accurately model electron and photon transport. It also tests the code’s ability to correctly simulate Bremsstrahlung photon production, which is primarily driven by the code’s ability to accurately model electron interactions with matter.
7.2 Sources The sources for this benchmark were spheres and shells fabricated from either depleted uranium (DU) or natural uranium [U(nat)] metal: • • • •
1‐kg DU metal sphere 3‐kg DU metal sphere 3.4‐kg DU shell 7.4‐kg U(nat) metal sphere
Each of the spherical sources is solid. The DU shell has an inside radius of 9.365 cm and a wall thickness of 1.6 mm. The precise isotopic composition of the sources has never been measured. The nominal composition of depleted uranium is listed in Table 7‐1 and Table 7‐2 lists the nominal composition of natural uranium. The nominal density of both materials is 18.95 g/cm3. Table 7‐1: Nominal depleted uranium isotopics Nuclide U234 U235 U238
Mass Fraction 0.0015% 0.2% 99.8%
Table 7‐2: Nominal natural uranium isotopics Nuclide U234 U235 U238
Mass Fraction 0.0054% 0.72% 99.27%
52
Each source was measured by a high purity germanium (HPGe) detector in a low background chamber as shown in Figure 7‐1 through Figure 7‐4. A 12‐mm‐thick piece of polyethylene was placed on the front face of the detector to eliminate beta interactions with the detector housing. Each source was measured at a distance of 26.1 cm from the front face of the detector.
Figure 7‐1: 1‐kg DU metal sphere measurement geometry
Figure 7‐2: 3‐kg DU metal sphere measurement geometry
53
Figure 7‐3: 3.4‐kg DU metal shell measurement geometry; the shell has an inside radius of 9.365 cm and a wall thickness of 1.6 mm
Figure 7‐4: 7.4 kg U(nat) metal sphere measurement geometry The sources were also described in detail in (Mattingly 2005).
54
7.3 Detector and Calibration Calibration measurements were collected with an Ortec 65% efficient HPGe detector in a low back‐ ground chamber as shown in Figure 7‐5. As shown, a 12‐mm‐thick piece of HDPE was placed on the front face of the detector; the HDPE served to eliminate beta interactions with the detector housing. Each calibration source was measured at a distance of 26.1 cm from the front face of the detector, which is the same as the distance that was used for measurements of the uranium spheres. The activity of each calibration source (Colbalt‐57, Cesium‐137, Cobalt‐60, and Thorium‐228) is given in Table 7‐3.
Figure 7‐5: Calibration measurement geometry Table 7‐3: Calibration sources Nuclide Co57 Cs137 Co60 Th228
Reference Activity (μCi) 144.0 10.01 98.92 55.51
Reference Date
Calibration Date
15 Feb 2002 15 May 1995 01 Nov 1988 15 May 1995
03 Jun 2005 03 Jun 2005 03 Jun 2005 03 Jun 2005
Detector response function parameters were estimated from the calibration measurements shown in Figure 7‐6 through Figure 7‐9. Note that in those figures, the measured gamma spectrum is shown in gray, and the spectrum computed for the calibration source is shown in red. Insets in these figures show peaks of interest on an expanded energy scale. The resulting detector response function parameters, as they were estimated from the calibration measurements, are shown in Figure 7‐10.
55
106 106
5
5
10
10
4
Counts / keV
10
4
Counts / keV
10
103
103 2
10
101 0
10
2
10
-1
10
100
200
300
400
500
600
700
Energy (keV)
1
10
0
10
-1
10
500
1000
1500
2000
2500
3000
Energy (keV)
Figure 7‐6: Cobalt‐57 detector calibration 106 106
5
5
10
10
4
Counts / keV
10
4
Counts / keV
10
103
103 2
10
101 0
10
2
10
-1
10
450
500
550
600
650
700
750
800
Energy (keV)
1
10
0
10
-1
10
500
1000
1500
Energy (keV) Figure 7‐7: Cesium‐137 detector calibration
56
2000
2500
3000
106
q
106
5
5
10
10
C o u n ts / k e V
4
Counts / keV
4
10
10
103
2
10
3
10
101
0
10
2
1100
10
1200
1300
1400
1500
Energy (keV)
101
0
10
500
1000
1500
2000
2500
3000
Energy (keV)
Figure 7‐8: Cobalt‐60 detector calibration 105
Counts / keV
104
3
10
2
10
1
10
0
10
500
1000
1500
Energy (keV) Figure 7‐9: Thorium‐228 detector calibration
57
2000
2500
3000
Figure 7‐10: Detector response function parameters
7.4 Benchmark Models The two principal spectral features of depleted and natural uranium metal are: • •
Photopeaks and Compton continua from the beta decay of Pa234m The Bremsstrahlung photon continuum, also from the beta decay of Pa234m
Consequently, this benchmark tests the ability to accurately simulate electron and photon transport phenomena, including coupled electron‐photon transport for Bremsstrahlung photon production. The implementation of coupled electron‐photon transport in GADRAS is described in detail (Mattingly 2005). In addition, during these experiments, a collection of high‐energy photopeaks were observed that do not appear in standard gamma emission databases. These are shown in Figure 7‐11, which was taken from Varley and Mattingly 2008. The calculation shown in green is based upon the standard distribution of the Evaluated Nuclear Structure Data Files (ENSDF), which is the basis for almost every other published database of gamma emissions. The ENSDF is missing several gamma lines, most probably emitted by Pa234m, in the region between 1900 and 2200 keV. The calculation shown in red includes those gamma lines. As a result of this series of measurements, these gamma lines were inserted into the GADRAS gamma emission database by Varley in 2008.
58
104
Counts / keV
103
2
10
1
10
0
10
-1
10
1700
1800
1900
2000
2100
Energy (keV)
2200
2300
Figure 7‐11: 1‐kg DU metal sphere model compared to measurement, 1600 – 2400 keV; the red model shows lines added to the set of Pa234m gamma emissions, the green model shows the spectrum computed using the original ENSDF data For each of the benchmark sources • • • •
1‐kg DU metal sphere 3‐kg DU metal sphere 3.4‐kg DU shell 7.4‐kg U(nat) metal sphere
each of the following subsections documents the one‐dimensional model of the source and compares the spectrum computed using that model to the measurement of the actual source. Each subsection shows a schematic of the one‐dimensional model and provides a table detailing the properties of each shell in the model. Each subsection also contains three plots comparing the model to the benchmark measurement. The plots show the following energy ranges: • • •
0 – 3000 keV 0 – 1100 keV 1100 – 3000 keV
The first range shows the overall comparison between the model and the measurement. The second range compares the lower energy portion of the spectrum, which is dominated by the gamma emissions of U238, Th234, Pa234m, and Pa234, and Bremsstrahlung due to Pa234m beta decay. The third range compares the upper energy portion of the spectrum, which is primarily dominated by Bremsstrahlung due to Pa234m beta decay and the higher energy gamma emissions of Pa234m. Overall and in each case the computed gamma spectrum matches the measurement. Over the majority of the full energy range, the computed spectrum is within 5% to 10% of the measurement. However, n
59
all cases the continuum below 300 keV exhibits a systematic error: the calculation tends to overpredict the measurement by as much as 20%. This error is most probably due to cross‐section approximations used in the electron transport calculation to estimate the Bremsstrahlung continuum. The current version of GADRAS employs a low‐ order angular expansion of the electron scatter cross‐section, which may produce an error like the one observed for deep penetration of low energy electrons. Future versions of GADRAS will investigate augmenting the electron cross‐sections to determine if that eliminates the error. However, the overprediction of the low‐energy continuum for depleted and natural uranium metal does not constitute a critical error. Relative to the accuracy of the computation over the rest of the spectrum, the low‐energy error is slight enough that it is unlikely to significantly impact an assessment developed by an analyst.
7.4.1 1-kg DU Metal Sphere
Figure 7‐12: One‐dimensional model of the 1‐kg DU metal sphere Table 7‐4: Parameters of the 1‐kg DU metal sphere one‐dimensional model Shell # 1
Material DU metal
Density (g/cm3) 18.95
Inner Radius (cm) 0
60
Outer Radius (cm) 2.327
Mass (kg) 1.0
106 5
10
4
Counts / keV
10
3
10
102 101 0
10
-1
10
-2
10
500
1000
1500
2000
2500
3000
Energy (keV)
Figure 7‐13: 1‐kg DU metal sphere model compared to measurement 106
5
Counts / keV
10
104
3
10
2
10
200
400
600
800
1000
Energy (keV) Figure 7‐14: 1‐kg DU metal sphere model compared to measurement, 0 – 1100 keV
61
104
3
10
Counts / keV
2
10
101
0
10
10-1
-2
10
1200
1400
1600
1800
2000
2200
2400
2600
2800
3000
Energy (keV)
Figure 7‐15: 1‐kg DU metal sphere model compared to measurement, 1100 – 3000 keV
7.4.2 3-kg DU Metal Sphere
Figure 7‐16: One‐dimensional model of the 3‐kg DU metal sphere Table 7‐5: Parameters of the 3‐kg DU metal sphere one‐dimensional model Shell #
Material
1
DU metal
Density (g/cm3) 18.95
Inner Radius (cm) 0
62
Outer Radius (cm) 3.356
Mass (kg) 3.0
106 5
10
4
Counts / keV
10
3
10
102 101 0
10
-1
10
-2
10
500
1000
1500
2000
2500
3000
Energy (keV)
Figure 7‐17: 3‐kg DU metal sphere model compared to measurement 106
5
Counts / keV
10
104
3
10
2
10
200
400
600
800
1000
Energy (keV) Figure 7‐18: 3‐kg DU metal sphere model compared to measurement, 0 – 1100 keV
63
104
3
10
Counts / keV
2
10
101
0
10
10-1
-2
10
1200
1400
1600
1800
2000
2200
2400
2600
2800
3000
Energy (keV)
Figure 7‐19: 3‐kg DU metal sphere model compared to measurement, 1100 – 3000 keV
7.4.3 3.4-kg DU Metal Shell
Figure 7‐20: One‐dimensional model of the 3.4 kg DU metal shell Table 7‐6: Parameters of the 3.4‐kg DU metal sphere one‐dimensional model Shell # 1 2
Material Void (air) DU metal
Density (g/cm3) 1.29×10‐3 18.95
Inner Radius (cm) 0 9.365
64
Outer Radius (cm) 9.365 9.525
Mass (kg) 4.4×10‐3 3.4
106 5
10
4
Counts / keV
10
3
10
102 101 0
10
-1
10
-2
10
500
1000
1500
2000
2500
3000
Energy (keV)
Figure 7‐21: 3.4‐kg DU metal shell model compared to measurement 107
6
Counts / keV
10
105
4
10
3
10
200
400
600
800
1000
Energy (keV) Figure 7‐22: 3.4‐kg DU metal shell model compared to measurement, 0 – 1100 keV
65
105
4
10
Counts / keV
3
10
102
1
10
100
-1
10
1200
1400
1600
1800
2000
2200
2400
2600
2800
3000
Energy (keV)
Figure 7‐23: 3.4‐kg DU metal shell model compared to measurement, 1100 – 3000 keV
7.4.4 7.4-kg U(nat) Metal Sphere
Figure 7‐24: One‐dimensional model of the 7.4 kg U(nat) metal sphere Table 7‐7: Parameters of the 7.4 kg U(nat) metal sphere one‐dimensional model Shell # 1
Material Density (g/cm3) U(nat) metal 18.95
Inner Radius (cm) 0
66
Outer Radius (cm) 4.534
Mass (kg) 7.4
106 5
10
4
Counts / keV
10
3
10
102 101 0
10
-1
10
-2
10
500
1000
1500
2000
2500
3000
Energy (keV)
Figure 7‐25: 7.4‐kg U(nat) metal sphere model compared to measurement 106
5
Counts / keV
10
104
3
10
2
10
200
400
600
Energy (keV)
800
1000
Figure 7‐26: 7.4‐kg U(nat) metal sphere model compared to measurement, 0 – 1100 keV
67
104
3
10
Counts / keV
2
10
101
0
10
10-1
-2
10
1200
1400
1600
1800
2000
2200
2400
2600
2800
Energy (keV)
3000
Figure 7‐27: 7.4‐kg U(nat) metal sphere model compared to measurement, 1100 – 3000 keV
7.5 File Locations with the GADRAS Distribution The data for this benchmark are distributed with GADRAS in the following folder:
GADRAS\Detector\Benchmark\DU‐Benchmark
7.6 Summary The preceding benchmark demonstrates that GADRAS is capable of accurately computing the gamma spectrum for depleted and natural uranium metal. A small systematic error at low‐energy was noted. However, that error is unlikely to significantly impact assessments developed by gamma spectroscopic analysts.
7.7 References John Mattingly, “Implementation and Testing of Electron Transport in GADRAS,” SAND2005‐7785, Sandia National Laboratories, 2005. Eric S. Varley and John Mattingly, “Corrections to the Evaluated Nuclear Structure Data Files (ENSDF) to Accurately Reproduce Measurements of Special Nuclear Material,” SAND2008‐5107, Sandia National Laboratories, 2008.
68
8 Conclusions Comparisons of GADRAS forward calculations using one‐dimensional models of several benchmark sources produced excellent agreement with experimental data. The radiation sources included weapons‐grade plutonium metal, plutonium oxide, highly enriched uranium, natural uranium, and depleted uranium. The excellent agreement validates the use of GADRAS for interpretation of radiation spectra by analysts. The sources selected require that the software to properly model photon, neutron, and electron transport, neutron capture and gamma emission by hydrogen, photon transport through hydrogenous materials, Bremsstrahlung photon production, and gamma signatures from alpha interactions with oxygen (distinguishes plutonium oxide from plutonium metal). A few minor discrepancies between calculated spectra and experiment were noted, including small systematic errors at low energies. It is unlikely that these small errors would negatively influence assessments. While the plutonium oxide benchmark demonstrates the code’s abilities to correctly simulate the alpha‐oxygen interactions, benchmark data on truly one‐dimensional (spheres) plutonium oxide sources is desirable. Overall, the GADRAS computations of radiation spectra from one‐dimensional models accurately match experimental data for a wide range of benchmark radiation sources of interest. This demonstrates and validates that the GADRAS code is well suited for use by analysts in their assessments of radiation spectra.
69
Distribution This document will be distributed electronically. MS0782 Chuck Rhykerd 6418 MS0782 Dean Mitchell 6418 MS0782 John Mattingly 6418 MS0782 Susan H. Rhodes 6418 MS0899 Technical Library 9536
70