the scale and complexity of the data, the concept of big data has been introduced, and has attracted significant attention from the government, industry, and ...
LU_LAYOUT_Layout 1 9/23/15 12:47 PM Page 50
BigProvision: A Provisioning Framework for Big Data Analytics Huan Li, Kejie Lu, and Shicong Meng Abstract
In the past few years, big data has attracted significant attention, and many analytics platforms, such as Hadoop, have been developed to enable the analysis of massive data. Nevertheless, it is still very challenging to provision, let alone optimize, a comprehensive system that includes various aspects, from the computing infrastructure to the analytics programs. To tackle this challenge, in this article, we propose a novel provisioning framework, BigProvision, to provision big data analytics systems. The main idea of the framework is to first evaluate and model the performance of different big data analytics approaches, given a set of sample data and various analytics requirements, such as the expected results, budget, response time, and so on. Based on the evaluation and modeling results, BigProvision can generate a provisioning configuration that can be used to configure the whole system for big data analytics. To evaluate the performance of the proposed framework, we develop an experimental prototype that supports three analytics platforms, Hadoop, Spark, and GraphLab. Our experiments show that for the classic PageRank analysis, both GraphLab and Spark can outperform Hadoop under different requirements. Moreover, by modeling the results, our prototype can determine the expected settings, such as the number of machines and network capacity, for the system that shall handle the complete data set. The prototype and experiments demonstrate that the proposed framework has great potential to facilitate the provision and optimization of future big data analytics systems.
F
rom genomic sequences to large-scale social networks, from satellite imagery data to scientific experimental observations, new technologies are collecting more and more data at an increasing rate than ever before. With the present technology, it is not uncommon to generate terabytes or even petabytes every day. Because of the scale and complexity of the data, the concept of big data has been introduced, and has attracted significant attention from the government, industry, and academia. To obtain meaningful information from the sea of bits, quite a lot of big data analytics systems have been developed in the past few years. Nevertheless, to realize big data analytics, a big data analyzer has to encompass a lot of technical details. As illustrated in Fig. 1, to provision a comprehensive system, a set of requirements must be taken into account, including the expected results, budget, response time, reliability, accuracy, and so on. Moreover, the set of analytics func-
Huan Li is with Beihang University. Kejie Lu is with Shanghai University of Electric Power and the University of Puerto Rico at Mayagüez. Shicong Meng is with IBM T. J. Watson Research Center. This work was supported in part by the 973 program of China (No. 2014CB340300), the National Nature Science Foundation of China (No. 61170293), the International Science & Technology Cooperation Program of China (No. 2014DFG12370), and the Shanghai Oriental Scholar Program.
50
0890-8044/15/$25.00 © 2015 IEEE
tions can generally be categorized into three layers: infrastructure, platform, and software. In the infrastructure layer, a network of machines shall be set up for computing, storage, and communications. In the literature, most existing implementations at the infrastructure layer are based on cloud computing. Nevertheless, many details still must be specified. For example, if a public cloud is used, one needs to specify the number of machines (or virtual machines) to be used, the configurations among distributed machines, and so on, all of which are not trivial because without fine-grained provision, the performance is unpredictable. In the platform layer, Hadoop [1] is certainly the de facto computing paradigm in practice. Currently, it is widely used by many major big data analyzers, including Internet companies such as Yahoo, Amazon, Facebook, and Twitter, among many others, and traditional data analytics companies, such as SAS. The question is, is Hadoop the best programming abstraction solution for all big data analytics problems? Perhaps the answer is no, but it is not easy to prove. In the software layer, different platforms provide various programming abstractions to support big data analytics problems. However, it is still very difficult to develop a program that can yield the best performance under a certain set of requirements, such as the response time and storage cost at the same time, and so on. In particular, the amount of effort for designing and implementing a feasible algorithm can be significant because it depends on the computing platform and even the infrastructure. We observe two major issues in the current state of big data analytics. First, it is very challenging to provision a whole
IEEE Network • September/October 2015
LU_LAYOUT_Layout 1 9/23/15 12:47 PM Page 51
Software: algorithms for big data analytics Similarity Word count Page rank system from an application’s or user’s perspective to achieve different analysis goals. Second, there is currently no tool that can optimize the performance of the comExpected results prehensive big data analytics system. To tackle this Platform: a computing platform for big data analytics challenge, in this article, we propose a novel framework, Budget Spark Hadoop GraphLab BigProvision, to provide systematic cross-layer provision for big data analytics systems. Response time The main idea of the framework is to first evaluate Infrastructure: a network of machines for big data analytics and model the performance of different big data analytReliability ics approaches, given a set of sample data and various Public cloud Private cloud Cluster/HPC Accuracy analytics requirements, such as the expected results, budget, response time, and so on. Based on the evaluation and modeling results, BigProvision can generate a proviFigure 1. Functions and requirements for big data analytics. sioning configuration that can be used to automatically configure the whole system for big data analytics. To the best of the authors’ knowledge, there has been no such framework in the literature. From the perspective of cloud usage, a cloud is a public To evaluate the performance of the proposed framework, cloud if the cloud service provider offers services to the generwe develop an experimental prototype that supports three al public. For instance, Amazon’s EC2 and Microsoft’s Winanalytics platforms, Hadoop [1], Spark [2–4], and GraphLab dows Azure are successful examples of public clouds. On the [5–7]. We then use the classic PageRank as a case study and other hand, if a cloud is only used by its owner, it is a private conduct extensive experiments using real data sets as sample cloud. For example, Google maintains its own cloud for big data to demonstrate the idea. data analytics, known as Google MapReduce. Our analysis shows that first, if reliability is not a major Regardless which infrastructure is used, the key challenge is concern, GraphLab can lead to the best performance; and how to provision individual devices while taking into account second, if reliability is a major concern, Spark outperforms the aforementioned requirements. Specifically, the provisionother approaches. Moreover, by modeling the behavior of the ing task shall include several steps: experimental system, we can determine the required settings, 1. Provisioning an individual machine (or virtual machine) such as the number of machines, capacity of network I/O, and 2. Provisioning the storage system so on, of the real system that handles the complete data set. 3. Provisioning the network resources so as to connect disFinally, our study also suggests directions for optimization and tributed machines tuning. For instance, on the platform layer, an asynchronous Clearly, these steps are not trivial in practice. More imporor synchronous mechanism shall be carefully considered, and tantly, there is a lack of a comprehensive system that can evalmachine-level fault tolerance shall be added to GraphLab. uate the performance and cost effectiveness of the The prototype and experiments demonstrate that the proinfrastructure layer for big data analytics. posed framework has great potential to facilitate the provision The Platform Layer and optimization of future big data analytics systems. The rest of this article is organized as follows. First, in the folOver the past few years, Hadoop, a Java implementation of lowing section, we briefly review the existing approaches for big MapReduce [9], has become the de facto high-performance data analytics. We then elaborate on the BigProvision frameexecution platform to support large-scale data analytics appliwork. Next we introduce our prototype and use PageRank as a cations on commodity machines. Although it has been proved case study to illustrate the potential of the proposed framework. that such a computation model is successful in a scalable, reliFinally, we conclude the article in the final section. able, and fault-tolerant manner, MapReduce logically does not fit all types of algorithms (e.g., iterative algorithms that need to handle the dependency between data over iterations). Recently, in-memory and graph-based parallel paradigms Existing Approaches for Enabling Big Data are attracting more and more attention. Spark, an in-memory Analytics computing framework [2–4], is designed to overcome Hadoop’s shortages in iterative operations. It introduces a read-only data As shown in Fig. 1, to enable big data analytics, necessary funcstructure called resilient distributed data sets (RDDs), through tions can be grouped into three layers. In this section, we furwhich reused data and intermediate results can be cached in ther review existing approaches based on this layered model. memory across clustered machines during the whole iterative We then use an Internet advertisement application as an examprocess. This feature has proved to effectively improve the perple to illustrate how to provision a system for big data analytics. formance in time for those iterative jobs [4]. The Infrastructure Layer Pregel [10] and GraphLab [5] are two graph-based parallel abstractions that can naturally express computational depenAccording to our definition, the infrastructure layer consists dencies. They are both designed to adopt a vertex-centric of a set of networked computing units, storage systems, and computational model in which an update function operates on communication facilities. In practice, a clear trend for big data one vertex of the graph at the time. Unlike the Bulk Synanalytics is to use the cloud as the infrastructure because of its chronous Passing (BSP) communication model used in Pregel, scalability and economic factors. GraphLab is a sequential shared memory abstraction where In general, a cloud consists of a large pool of easily usable each vertex can read and write to data on adjacent vertices and accessible virtualized resources, including computing and edges [6]. Although it was initially designed to efficiently hardware, development platforms, and software applications implement parallel machine learning (ML) algorithms [5, 6], [8]. These resources can be dynamically reconfigured to adapt GraphLab has evolved to introduce a new approach to disto a particular service demand that may fulfill cloud users’ tributed graph placement and representation that exploits the demands and lead to optimum resource utilization from the structure of power law graphs [7]. cloud owner’s perspective.
IEEE Network • September/October 2015
51
LU_LAYOUT_Layout 1 9/23/15 12:47 PM Page 52
In short, each platform may target different applications or performance goals. The question here is, which platform is the best solution for a particular big data analytics problem? Similar to the discussion of the infrastructure layer, we also need a comprehensive system to evaluate, choose, and optimize the platform for big data analytics.
The Software Layer In order to obtain expected results, the big data analyzer has to decide which algorithms to apply in the first step of data analysis. However, there may be many algorithms that can be used for a specific data analysis problem. Moreover, even for a given algorithm, there may be different implementation methods, with different languages and on different analytics platforms. Thus, in order to obtain reliable and accurate results, currently, it is necessary for a big data analyzer to deeply understand the details of algorithms, and to learn a new language, configurations, and debug skills, which are obviously not easy tasks for the big data analyzer.
A Big Data Analytics System for Internet Advertisement Application In this subsection, we use a concrete application (i.e., Internet advertisement) to demonstrate how to provision a big data analytics system. We consider an advertisement company that uses a log file to record the impression time, clicks, and so on of a live video advertisement posted on the Internet. The size of the log file can grow by several gigabytes every day. The company wants to understand the effectiveness of the advertisement on different Internet channels so that they can make a decision on how much they should pay for those channels for the next month or year. In this example, the business goals of data analytics could be diverse. For example, the goal could be to identify the top three channels that can attract the most users’ clicks, to understand the similarity of those people who often browse the advertisement, and to determine the pricing model that can help the company to minimize the budget for this advertisement. In order to achieve these goals, the advertisement company may need to perform the following tasks for its big data analytics. First, the company should figure out the candidate algorithms that can be used to solve the above problems. Those algorithms may include simple statistical operations and complicated ones, such as k-means algorithms. However, different algorithms may lead to different results (e.g., depending on the time of iterations or converge conditions). How to find feasible algorithms to obtain the expected results under accuracy constraints is not an easily solved problem in a big data scenario. Second, it needs to choose one or more platforms that are feasible and effective for implementing those algorithms. For instance, MapReduce/Hadoop is a good choice for batch processing in statistical operations with high reliability. However, GraphLab may be better at supporting iterative operations in terms of time and memory optimization for graph-based data. In this step, it is very difficult to determine how to evaluate the performance, which includes time, memory, network resources, fault tolerance, and so on, to satisfy the goals from the company’s perspective. Finally, the company has to decide if it should use a cloud as the infrastructure for the deployment. Even before it decides to use the cloud, the application needs a model of performance that includes the prediction of computation, storage, and communication cost in order to take advantage of the pay-on-demand or pay-as-you-go benefits offered by different cloud service providers. To summarize, we note that it is very challenging to provision a running system for big data analytics. In fact, existing
52
research shows that the task of choosing the right software is rather complicated [11, 12], where the time complexity of the algorithm and the cost of migrating data become difficult to address in the big data scenario. Therefore, there is a need to develop a comprehensive provisioning framework that can simplify the efforts of current and potential big data analyzers so as to further promote more big data applications.
The BigProvision Framework In this section, we present the BigProvision framework, which can provide provisioning as a service for big data analytics. We first introduce the main idea of BigProvision and related work on provisioning as a service (PaaS) 1 in the cloud paradigm. We then elaborate on the components of BigProvision, and summarize key challenges for deploying the BigProvision framework.
The Main Idea As discussed previously, although there are many efforts on the system for big data analytics, it is very challenging to provision big data analytics in a systematic manner. In the cloud paradigm, similar cases can happen for other applications as well because many cloud users have difficulties determining the optimal provision of machines (or virtual machines) at the infrastructure level. To address this issue, the concept of PaaS has been introduced, with the goal of allowing a user to define requirements on performance constraints and monetary budget for a particular task without considering the actual resource provisioning details, which are handled by cloud service providers based on users’ demands and constraints. An example of PaaS is VMware’s vCloud Suite. For big data analytics, PaaS has recently been investigated, but most of the existing studies and products assume that the analytics platform is based on MapReduce. For instance, some recent work on MapReduce performance modeling2 has been applied to automatically find the best provisioning plan for a user job. Similar services have been shipped with products such as RightScale’s support for Hadoop on-demand provisioning based on big data analytics server templates.3 Although these attempts are important and can somewhat simplify the efforts for provisioning a big data analytics system, they are still limited and may not lead to the optimal performance of the entire system. In this article, we propose the BigProvision framework, and the main idea of the framework is to first evaluate and model the performance of different big data analytics approaches, that is, the combinations of different options in the three aforementioned layers, given a set of sample data and various analytics requirements, such as the expected results, budget, response time, and so on. Next, based on the evaluation and modeling results, BigProvision can generate a provisioning configuration that can be used to automatically configure the whole system for big data analytics.
The Components As illustrated in Fig. 2, our BigProvision framework consists of two major components: a provisioning arbitrator (PA) and a system provisioner (SP). The PA is the decision making 1
In this article, PaaS stands for provisioning as a service instead of a similar term, platform as a service. 2
https://www.cs.duke.edu/starfish/
3
http://www.rightscale.com/solutions/cloud-computing-uses/bigdata.php
IEEE Network • September/October 2015
LU_LAYOUT_Layout 1 9/23/15 12:47 PM Page 53
Expected results, budget, response time, reliability, accuracy, etc.
Simple data + objectives
Provisioning arbitrator
Provisioning
System provisioner
Big data
Deployment
Outcome
Software: PageRank Platform: GraphLab
In-depth systematic performance evaluation
Provisioning results
•Benchmark: PageRank, word count, sort, . . . •Hadoop, Spark, GraphLab
Modeling •Time, storage, communication •Cost and budget
Optimization and tuning •Program •Configuration parameters
Software
Data representation, algorithms, etc.
Platform
Analytics platform, configuration, etc.
Infrastructure
Topology of network (number of nodes, bandwidth), CPU, memory, storage, etc.
Infrastructure: Amazon EC2
Figure 2. BigProvision: components and functionality.
component of BigProvision. It provides three key functions toward automatic provisioning. In-depth systematic performance evaluation: The first step toward automatic provisioning is to evaluate different analytics approaches for the given sample data and objectives, as shown in Fig. 2. The framework shall be implemented in such a way that in-depth systematic performance evaluation can be performed automatically with the introduction of new algorithms, new platforms, or new infrastructure. Moreover, it is critical to capture key performance indicators and important resource consumption data for cross-comparison of different systems. Modeling: The relationship between the data and the required system settings of an analytics system is established through performance modeling. The performance models should capture the fundamental characteristics of the system. For instance, a model should capture the impact of the number of machines and the network that connects these machines. Once the model is established, the PA can generate tentative provision results, including various aspects of the system in different layers, for the whole system that will handle the complete data set. Optimization and tuning: While performance modeling provides directional guidance on the suitable system for a given analytics application, it is still critical to properly tune the selected system to achieve the best performance. To achieve this design goal, the PA shall provide a number of options for performance optimization and tuning of system and job parameters. For systems with well understood behavior, a set of heuristics and simple models can be applied for parameter tuning. For systems with more complex behavior, the PA can also leverage dynamic sampling and machine learning techniques to find the nearoptimal combined parameter values for a particular job-platform choice. The SP takes the output decision from the PA and realizes
IEEE Network • September/October 2015
the system provisioning in a cloud environment. For example, the SP first requests a set of virtual machines (VMs) based on the number and types of machines provided by the PA. It then deploys and tunes the platform selected by the PA on the provisioned VMs. Meanwhile, the SP also coordinates the process of data movement, for example, moving data from the persistent cloud storage (e.g., Amazon S3) to the computation platform (e.g., Hadoop). During runtime, it also closely monitors the resource utilization and performance of the job execution. The resulting monitoring data can be used for on-the-fly performance tuning as well as future model refinement.
Challenges and Key Issues To realize BigProvision, there are many challenging issues. In this subsection, we summarize major issues and discuss how to address them.
Characteristics of Big Data — Big data analytics is challenging first because of the characteristics of the data themselves. Besides the huge volume, data are also associated with heterogeneity and uncertainty. In practice, heavily skewed data could easily cause imbalanced workload among distributed analytics processes. Similarly, an iterative algorithm that finishes quickly on one set of data does not imply a fast execution on another set of data due to the uncertainty and complex nature of data. The complexity of big data is also due to the complicated relationship of data records. For many applications, data records are fundamentally networked, and the goal of big data analytics is to figure out how they are networked. As an example, the degree of influence of a person in a typical social network depends on its centrality. Therefore, to achieve good performance for big data analytics, various characteristics of the sample data shall be measured and investigated in the PA module.
53
LU_LAYOUT_Layout 1 9/23/15 12:47 PM Page 54
Programming model
Computation model
Communication
Iterative
Primary storage
Fault tolerance
MapReduce (Java)
Key/value batch process
Synchronous
No
Disk
Machine
Spark
RDD and parallel operations (Scalar)
Passing a function
Synchronous
Yes
Memory
Machine
GraphLab
Vertex-Program (C++)
GAS*
Syn./asyn.
Yes
Memory
Process (checkpoint)
Platforms Vanilla Hadoop
* GAS stands for Gather, Apply, and Scatter, which are the three phases of vertex programs. Gather is the collection of information about vertex neighborhoods and resemble a micro MapReduce job over the neighborhood of the vertex. Apply is updating the value of the vertex by the results passed on from the gather phase. Scatter signals adjacent vertices.
Table 1. Comparison of the platforms.
Algorithms for Big Data Analytics — Based on the understanding of the characteristics of data, algorithms can be “smarter.” For instance, graph abstractions are very useful to analyze complex data sets that represent networked, correlated data records. Nevertheless, how to represent these data and how to quickly identify meaningful information will be the key issue for the design and development for big data analytics. For this issue, we believe that it is very difficult for most typical big data analyzers to handle large varieties of algorithms. With the proposed framework, we envision that this task can be performed in the PA, where different algorithms can be evaluated, benchmarked, and designed. Platforms to Implement Algorithms — As discussed previously, different parallel platforms target different aspects in the design. For instance, MapReduce/Hadoop is simple and efficient for batch and parallel processing, but it is not designed to analyze networked data sets. On the other hand, GraphLab is designed specifically for graph represented data and has been shown to have one to two orders of magnitude performance gains over a Hadoop-based implementation of PageRank [6]. Nevertheless, we also find in our experiments that it is not good for WordCount. Therefore, different platforms’ characteristics, in terms of time, storage, communication, consistent semantics, data structure complexity, and so on, shall be modeled and analyzed, along with different algorithms for data at different scales, in BigProvision. Infrastructure to Support the Platform — To take advantage of the benefits of elasticity provided by utility computing based infrastructure (e.g., Amazon EC2), it is required for users to accurately estimate the utilization of the system. However, how to quantify and transfer such user requirements, such as delay sensitivity and fault tolerance, into system-level descriptions (i.e., number of VMs) combining the budget/cost efficiency into account for optimization and tuning the system, is another critical function in BigProvision.
A Prototype for BigProvision To evaluate the potential of BigProvision, we develop a prototype that implements the major components described in the previous section. In this section, we briefly explain the implementations of the prototype according to the layered model. We then use PageRank as a case study and conduct extensive experiments.
The Infrastructure Layer As a first step of our study, we establish a cluster as the computing environment. The experimental cluster is composed of 11 machines. One of them is designated as the master (Dell
54
Optiplex 790: Intel® Core™ i5-2400 CPU @ 3.10 GHz, DDR3 1333 MHz 8 GB, 500 GB disk), and the other 10 (Dell Optiplex 960: Intel Core2 Quad CPU Q9550 @ 2.83GHz, DDR2 800 MHz 8 GB, 500 GB disk) are slaves. We use Ubuntu 12.04.2 (GNU/Linux 3.5.0-28-generic x86 64) as the operating system for all the machines. All 11 machines are in the same local area network and connected by an H3C S5100 switch with a port rate of 100 Mb/s. All 11 machines have 4 cores, but master and slaves have different frequencies.
The Platform Layer In this layer, we implement three platforms: • Hadoop (v1.2.1) • Spark (v0.7.3) • GraphLab (v2.1) The reason for this selection is manyfold: • They are all high-level distributed abstractions and parallel frameworks designed for big data processing. • They all use HDFS for data input/output and management; • They are all open sources. Therefore, we can compare them in a fair manner. Besides the commonality, these platforms are different in terms of execution manners, data representations, and so on, as illustrated in Table 1.
The Software Layer On the software layer, we implemented different algorithms, such as WordCount, PageRank, and the advertisement application. Due to limited space, we only use PageRank as the case study. In the literature, PageRank is a widely used iterative algorithm for evaluation. In our implementation, dangling nodes4 are handled by redistributing PageRank mass “lost” at dangling nodes across all nodes in the graph evenly, according to [13]. We also consider two termination conditions for RangeRank to stop the iterations: • The algorithm iterates until the PageRank values changes by less than some small value a. • The algorithm stops at the time when the top-k PageRank values become stable. In practice, a and k can be specified by a big data analyzer (user of BigProvision) as stop conditions. Due to space limitation, we only show the results for the first condition, where the convergence condition is a = 0.003, in this article.
Experiment Settings Data Sets — To evaluate the performance of different analytics systems, we choose five real graph data sets as the sample data for the PageRank algorithm, as shown below: 4
Dangling nodes are the vertices in a graph that have no outlinks.
IEEE Network • September/October 2015
LU_LAYOUT_Layout 1 9/23/15 12:47 PM Page 55
Hadoop 22
14,000
Hadoop 5 12,000
Spark 22
Running time (s)
Spark 5 10,000
GraphLab 22 GraphLab 5
8000 6000 4000 2000 0
0
1
2
3
4
5 6 7 8 Number of slaves
9
10
11
12
Figure 3. Scalability comparison (Twitter), 5/22 PageRank iterations.
1. wiki-Vote: 1.0 MB, 7115 nodes, 103,689 edge 2. soc-Slashdot0902:10.8 MB, 82,168 nodes, 948,464 edges 3. web-Google: 71.9 MB, 875,713 nodes, 5,105,039 edges 4. cit-Patents: 267.5 MB, 3,774,768 nodes, 16,518,948 edges 5. Twitter: 1.3 GB, 11,316,811 nodes, 85,331,845 edges The first four data sets are obtained from [14], while the last one is obtained from [15]. We choose them because they are directed graphs representing different application fields, and have significant differences in size.
Measurement Metrics — In this article, we choose the following metrics: 1. Running time (seconds): the total amount time for the algorithm to run the iterations before the user specified conditions are reached 2. Memory usage (megabytes per second): the peak memory access rate when the algorithm is running 3. Disk I/O (megabytes): the total amount data passing through the disk interface for all the slaves in the cluster 4. Network I/O (megabytes): the total amount data passing through the network interface for all the slaves in the cluster
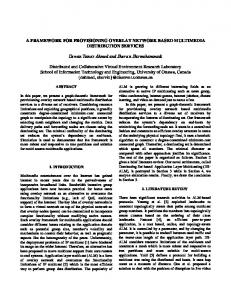
Experiment Results The Impact of the Number of Machines — To understand how the number of machines, which relates to the cost of the analyzer, affects the performance of running time, we run PageRank for five iterations and 22 iterations (when the convergence condition is a = 0.003) for the Twitter data set, with different numbers of machines in the cluster. For this experiment, Fig. 3 shows the running time vs. the number of machines. There are several interesting observations: • GraphLab always has better performance, as expected, except for the case where there is only one machine, which leads to insufficient memory, so the PageRank algorithm cannot be completed. • The number of machines has a great impact on Spark and Hadoop, but does not have a significant impact on the response time of PageRank running on GraphLab. The Impact of the Scale of the Data Set — We now investigate the impact of the scale of the data set on the performance of different analytics systems. As shown in Table 2, for each data set, we summarize the running time, memory usage, disk I/O, and network I/O for the three platforms. These results show that GraphLab outperforms the other two in terms of running time, memory usage, and disk I/O for all data sets. The results also show that GraphLab and Spark have similar performance in terms of network I/O.
IEEE Network • September/October 2015
As explained in the previous section, modeling is an important function in the BigProvision framework. In our study, we have also conducted preliminary research for this function. For instance, we can analyze the trend of network I/O vs. the size of the data set (or the number of nodes in the data set), and we find that the growth of the network I/O can be estimated by a power law with respect to either the size of the data set (with exponent about 1.02) or the number of nodes in the data set (with exponent about 0.96). These modeling results are important for estimating the required resources for the big data analytics system, which handles the complete data set instead of the sample one.
Fault Tolerance Analysis — In the previous two sets of experiments, we do not consider any fault tolerance requirement. In practice, some applications require higher reliability guarantee. To this end, GraphLab may not be sufficient because GraphLab achieves fault tolerance with fined-grained ChandyLamport’s asynchronous snapshotting algorithm for distributed systems [6] but lacks the mechanism for machine-level fault tolerance. For this reason, we only compare the performance of Hadoop and Spark for fairness. In our experiments, we run the PageRank algorithm for 10 iterations, in which one slave node crashes at the beginning of the sixth iteration. Table 3 illustrates the results for running time, in which we can find: • In the failure environment, both systems can sustain performance well. • Hadoop spends 2.3 times as much time as that of the normal condition, while Spark spends 1.3 times as much time as that of the normal condition, at the moment of recovery. • Node failure has negative impact on subsequent iterations for Hadoop, but not for Spark. This experiment can help us to understand how to further improve or fine tune the analytics system. For instance, it will be better for GraphLab to add support for machine level fault tolerance.
Conclusions In this article, we make an initial effort to address a challenging issue: how to efficiently provision a big data analytics system. To this end, we propose a novel framework, BigProvision, which can facilitate the provision of a comprehensive system that includes various aspects from the computing infrastructure to the analytics platform to the algorithms. The main idea of the framework is to first evaluate and model the performance of different big data analytics approaches, given a set of sample data and various analytics requirements, such as the expected results, budget, response time, and so on. Based on the evaluation and modeling results, BigProvision can generate provisioning configuration that can be used to automatically configure the whole system for big data analytics. To evaluate the performance of the proposed framework, we have developed an experimental prototype that supports three analytics platforms, Hadoop, Spark, and GraphLab, on a cluster with 11 machines. Our experiments show that for the classic PageRank analysis, both GraphLab and Spark can outperform Hadoop under different requirements. Moreover, by modeling the results, our prototype can determine the expected settings, such as the number of machines and network capacity, for the system that shall handle the complete data set. The prototype and experiments demonstrate that the proposed framework has great potential to facilitate the provisioning and optimization of future big data analytics systems.
55
LU_LAYOUT_Layout 1 9/23/15 12:47 PM Page 56
platform
Hadoop
Spark
GraphLab
Data set
Run
Mem.
Disk
Net.
Run
Mem.
Disk
Net.
Run
Mem.
Disk
Net.
wiki-Vote
227
1016
1343
2975
20
1299
301
110
5
522
169
35
soc-Slashdot0902
452
1167
1381
5462
26
2293
318
510
11
493
224
346
web-Google
825
1933
9875
22,490
104
2962
1768
4727
84
647
251
6167
cit-patents
621
2551
21,759
32,268
187
4574
3596
8904
193
1108
482
13,521
twitter-small
5647
7759
343,535
381,305
1284
7741
27,085
55,451
589
2251
1578
38,026
Table 2. System performance for different data sets.
Data set
Platform
1
2
3
4
5
6
7
8
9
10
web-Google
Hadoop normal
55
49
48
49
50
50
48
47
48
48
web-Google
Hadoop failure
51
50
50
47
49
151
63
67
69
67
web-Google
Spark normal
7
5
5
5
5
5
5
5
5
5
web-Google
Spark failure
8
4
5
5
5
11
5
5
5
5
Twitter
Hadoop normal
255
259
258
259
233
242
268
259
250
257
Twitter
Hadoop failure
269
261
242
257
264
280
320
362
385
391
Twitter
Spark normal
69
56
53
54
56
61
56
64
58
57
Twitter
Spark failure
63
54
54
58
59
106
58
63
57
57
Table 3. Fault tolerance comparison using web-Google and Twitter graph data sets.
Acknowledgment The authors would like to appreciate the efforts of Mr. Lei Gu for his implementation and evaluation on Hadoop and Spark, and Mr. Junpeng Xiao for his work on GraphLab.
References [1] Apache Hadoop; http://hadoop.apache.org [2] Spark; http://spark-project.org/ [3] M. Zaharia et al., “Spark: Cluster Computing with Working Sets,” HotCloud, June 2010. [4] M. Zaharia et al., “Resilient Distributed Datasets: A Fault-Tolerant Abstraction for In-Memory Cluster Computing,” NSDI, April 2012. [5] Y. Low et al., “Graphlab: A New Framework for Parallel Machine Learning,” Proc. Conf. Uncertainty in Artificial Intelligence, Catalina Island, CA, July 2010. [6] “Distributed Graphlab: A Framework for Machine Learning and Data Mining in the Cloud,” Proc. VLDB Endowment, vol. 5, no. 8, 2012, pp. 716–27. [7] J. E. Gonzalez et al., “Powergraph: Distributed Graph-Parallel Computation on Natural Graphs,” Proc. 10th USENIX Symp. Op. Sys. Design and Implementation, Oct. 2012. [8] L. M. Vaquero et al ., “A Break in the Clouds: Towards a Cloud Definition,” Proc. ACM SIGCOMM Comp. Commun. Rev., vol. 39, Jan. 2009, pp. 50–55. [9] J. Dean and S. Ghemawat, “Mapreduce: Simplified Data Processing on Large Clusters,” OSDI, 2004. [10] G. Malewicz et al., “Pregel: A System for Large-Scale Graph Processing,” SIGMOD, 2010, pp. 135–46. [11] M. Armbrust et al., “Above the Clouds: A Berkeley View of Cloud Computing,” tech. rep. no. UCB/EECS-2009-28, Feb. 2009. [12] D. Agrawal, S. Das, and A. E. Abbadi, “Big Data and Cloud Computing: Current State and Future Opportunities,” EDBT, 2011.
56
[13] M. Bianchini, M. Gori, and F. Scarselli, “Inside PageRank,” Proc. ACM Trans. Intenet Tech., vol. 5, 2005, pp. 92–128. [14] Stanford SNAP; http://snap.stanford.edu/ [15] Twitter graph dataset; http://socialcomputing.asu.edu/datasets/Twitter
Biographies HUAN LI received her M.S. and Ph.D. degrees in computer science from the University of Massachusetts, Amherst, in 2002 and 2006, respectively. She is now an associate professor in the School of Computer Science and Engineering at Beihang University, Beijing, China. Her research interests include distributed real-time systems, systematic performance evaluation for big data processing, and wireless and mobile computing. K EJIE L U (S’01, M’04, SM’07) received his B.Sc. and M.Sc. degrees in telecommunications engineering from Beijing University of Posts and Telecommunications, China, in 1994 and 1997, respectively. He received his Ph.D. degree in electrical engineering from the University of Texas at Dallas in 2003. In 2004 and 2005, he was a postdoctoral research associate in the Department of Electrical and Computer Engineering, University of Florida. In July 2005, he joined the Department of Electrical and Computer Engineering, University of Puerto Rico at Mayagüez, where he is currently an associate professor. Since January 2014, he has been an Oriental Scholar with the School of Computer Engineering, Shanghai University of Electric Power, China. His research interests include architecture and protocols design for computer and communication networks, performance analysis, network security, and wireless communications. SHICONG MENG is a research scientist at IBM T. J. Watson Research Center. He did his Ph.D. at the College of Computing, Georgia Institute of Technology, where he was affiliated with the Center for Experimental Research in Computer Systems. His research focuses on performance, scalability, and security issues in large-scale distributed systems such as cloud data centers. He has recently been working on MapReduce performance optimization, high-performance data stores, and cloud data center monitoring and management.
IEEE Network • September/October 2015