Lawrence Berkeley National Laboratory
Peer Reviewed Title: Binary Pseudo-random Grating Standard for Calibration of Surface Profilometers Author: Yashchuk, Valeriy V. Publication Date: 07-23-2008 Publication Info: Lawrence Berkeley National Laboratory Permalink: http://escholarship.org/uc/item/3fg161m4 Keywords: , standards, surface roughness, interference microscopy, profilometry Abstract: We suggest and describe the use of a binary pseudo-random (BPR) grating as a standard test surface for measurement of the modulation transfer function (MTF) of interferometric microscopes. Knowledge of the MTF of a microscope is absolutely necessary to convert the measured height distribution of a surface undergoing metrology into an accurate power spectral density (PSD) distribution. For an 'ideal' microscope with an MTF function independent of spatial frequency out to the Nyquist frequency of the detector array with zero response at higher spatial frequencies, a BPR grating would produce a flat 1D PSD spectrum, independent of spatial frequency. For a 'real' instrument, the MTF is found as the square root of the ratio of the PSD spectrum measured with the BPR grating to the 'ideal,' spatial frequency independent, PSD spectrum. We present the results from a measurement of the MTF of MicromapTM-570 interferometric microscope demonstrating a high efficiency for the calibration method.
eScholarship provides open access, scholarly publishing services to the University of California and delivers a dynamic research platform to scholars worldwide.
Binary Pseudo-random Grating Standard for Calibration of Surface Profilometers
Valeriy V. Yashchuk Lawrence Berkeley National Laboratory, Berkeley, CA 94720, USA Lawrence Berkeley National Laboratory, 1 Cyclotron Road, M/S 2R0400, Berkeley, CA 94720-8199, USA +1-510-495-2592 TEL +1-510-486-7696 FAX Email address:
[email protected]
Wayne R. McKinney Lawrence Berkeley National Laboratory, Berkeley, CA 94720, USA Lawrence Berkeley National Laboratory, 1 Cyclotron Road, M/S 2R0400, Berkeley, CA 94720-8199, USA +1-510-495-4395 TEL +1-510-486-7696 FAX Email address:
[email protected]
Peter Z. Takacs Brookhaven National Laboratory
1
Instrumentation Divison Bldg. 535B Upton, New York, 11973, USA +1-631-344-2824 TEL +1-631-344-5773 FAX Email address:
[email protected]
*Corresponding author:
[email protected]
Keywords: metrology, standards, surface roughness, interference microscopy, profilometry
2
ABSTRACT We suggest and describe the use of a binary pseudo-random (BPR) grating as a standard test surface for measurement of the modulation transfer function (MTF) of interferometric microscopes. Knowledge of the MTF of a microscope is absolutely necessary to convert the measured height distribution of a surface undergoing metrology into an accurate power spectral density (PSD) distribution. For an ‘ideal’ microscope with an MTF function independent of spatial frequency out to the Nyquist frequency of the detector array with zero response at higher spatial frequencies, a BPR grating would produce a flat 1D PSD spectrum, independent of spatial frequency. For a ‘real’ instrument, the MTF is found as the square root of the ratio of the PSD spectrum measured with the BPR grating to the ‘ideal’, spatial frequency independent, PSD spectrum. We present the results from a measurement of the MTF of MicromapTM-570 interferometric microscope demonstrating a high efficiency for the calibration method. 1. Introduction Optical surface profilometers built around interferometric microscopes have become a basic metrology tool for the characterization of high quality optical surfaces with sub-Angstrom rms roughness. Traditionally, the standard list of output parameters of an interferometric microscope measurement has included values of roughness averaged over an area and along a sample line. More recently, the roughness characterization was extended to a more rigorous statistical description of surface topography based on power spectral density (PSD) distributions of the surface height (see e.g., Refs. 1-4 and references therein). The measured PSD distributions provide a framework for connecting surface roughness with three-dimensional calculations of scattering of light by the optical surfaces.5-7
3
A straightforward transformation of the measured 2D area distribution of the residual surface heights into a 2D PSD distribution almost always provides spectra with distortion caused by the unknown spatial frequency response of the instrument. The response is characterized by the modulation transfer function (MTF), which is defined by the spatial frequency bandwidth of the instrument.8 The MTF contains contributions from the instrument’s optical system, detector, signal processing, software algorithm, and environmental factors. Generally, these contributions are difficult to account for separately. The instrumental MTF can be evaluated by comparing a measured PSD distribution of a known test surface with the corresponding ideal numerically simulated PSD.9-11 The square root of the ratio of the measured and simulated PSD distributions gives the MTF of the instrument. The binary pseudo-random grating (BPRG) described here provides an effective test surface to fulfill this calibration need. 2. Binary pseudo-random grating properties The BPRG as we determine it here is a set of rectangular grooves (with a binary height distribution) pseudo-randomly distributed over a uniform grid with an elementary pitch equal to the width of the smallest groove. The term ‘pseudo-random’ depicts that the distribution is specially generated to possess a property of randomness in the mathematically strong sense. As it is shown below, the inherent PSD spectrum of such a grating is independent of spatial frequency (white-noise-like). Therefore, any deviation of a PSD spectrum measured with a real instrument from a white-noise-like spectrum would be a measure of the instrumental MTF. The BPR grating based method proposed here is in some sense an extension of the approach based on a unit step surface.10 The inherent 1D PSD spectrum of a step artifact has an inversequadratic dependence on spatial frequency. Such behavior of the step surface PSD puts a limitation on its use at higher spatial frequencies. The advantage of the proposed BPR grating, 4
coming from the spatial frequency independence of its PSD spectrum, is that it basically provides a uniform sensitivity to measurement of the MTF function at all desired frequencies. It also provides a measure of the system MTF averaged over the entire extent of the aperture, rather than just in a very localized region around the height discontinuity of the single step artifact.12,13 Particular methods for generation of maximum-length pseudo-random sequences14-16 were developed in connection with the use of pseudo-random chopping of a beam in time-of-flight experiments.17-19 The sequences are mathematically represented with 1’s, which denote an open chopper slot, and 0’s, which denote a closed chopper slot. The chopping associated with a crosscorrelation analysis of the measured time-resolved detector signal is favored over single-shot (periodic) chopping with duty-cycle gain factor as high as N 4 (assuming two slits on a periodic chopper), where N is the length of the pseudo-random sequence. Similar to the requirement for maximum duty cycle of a pseudo-random chopper, the BPR grating has to be generated with a maximum filling factor for an improved signal-to-noise ratio of the PSD spectra of the test surface. The mathematical term for such a sequence is “maximumlength pseudo-random sequence” (MLPRS). Note that a MLPRS used for chopping is not entirely random, but repeats itself after N elements.
The analytical method we used to generate a MLPRS (modulo-two) of odd length N = 2 n − 1 , where n is an integer, is described in Ref. 15. In this article, all base ten values for the recursion coefficients (RC) which can be used for the generation of MLPRS are presented and the use of a particular RC to generate a pseudo-random sequence is explained.
5
A sequence {ai } of N elements ( i = 0, 1,Λ , N − 1 ) to be qualified as a MLPRS must obey two conditions for its correlation function. First, the autocorrelation of the sequence must sum to 2 n −1 . That means that the sequence correlation function, which is determined as N −1
A j = ∑ ai ai+ j ,
j = 0,1,Λ , N − 1 ,
(1)
i =0
sums to A0 = 2 n−1 (equal to the number of 1’s in the MLPRS) at j = 0 . Second, the sequence has to be ‘almost’ uncorrelated, which means that the cross-correlation of the sequence, A j at j ≠ 0 all are equal to each other, A j = 2 n − 2 .15 The conditions are very natural if one uses a definition of a purely random sequence (or process), or white noise, as a sequence which consists entirely of uncorrelated binary elements (impulses). 20 Note here, that in order to construct a ‘true’ δ -function-like correlation function [that is
δ ( j ≠ 0) = 0 and δ ( j = 0) = 1 ] for a particular MLPRS, one can use a specially designed ‘deconvolution’ sequence (see e.g., Ref. 18)
bk =
2ak − 1 . 2 n −1
(2)
Then the expression analogous to Eq. (1) gives the δ -function-like correlation function N −1
∆ j = ∑ ai bi + j = i =0
1 2 n−2
N −1
∑a a
i i+ j
i =0
According to Eq. (3) ∆ 0 = 1 at j = 0 and ∆ j = 0 at j ≠ 0 .
6
−1.
(3)
3. Properties of BPRG prototype
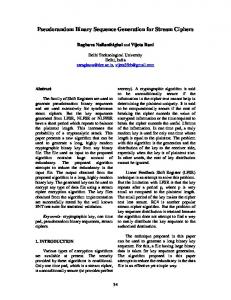
Based on the procedure described in Ref. 15, we generate a BPR sequence of N = 4095 elements obtained (see Ref. 15, Table III) with sequence generator n = 12 and the recursion coefficient M = 83 (base 10 value). Figure 1 graphically reproduces the first 100 elements of the BPR sequence. A grating according to the generated BPR sequence was fabricated using a conventional lithographical process. The grating was etched into a silicon (110) wafer using the anisotropic etching in a KOH solution. The fundamental feature width of the grating is 2.5 µm. The etch depth was measured with a calibrated atomic force microscope to be approximately 700 nm. However, the effective depth of the grating as it is seen by the MicromapTM-570 interferometric microscope is only 174 nm. The discrepancy is due to the expected uncertainty of 2π of the phase-retrieval algorithm of the instrument. The uncertainty leads to the effective depth of the grating being smaller by the wavelength of the light that is λ ≈ 520 nm. Nevertheless, this circumstance does not compromise the possibility to calibrate the instrument with a standard with depth larger than λ , if the 2π phase shift due to the retrieval is applied to the entire measured surface. Moreover, with such a grating, one can test the capability of the instrument to reliably measure surface structures with concavities deeper than the wavelength of light. Measurements made near the left (low index number) edge of the grating with the MicromapTM570 interferometric microscope using the 50× objective are shown in Fig. 2, along with the corresponding points of the ideal BPR grating pattern scaled to the 2.5 µm grid pitch. The field of view on the surface at this magnification for the profile measurement is about 125 µm, which corresponds to 50 feature elements on the grating. The starting points for the two measured
7
profiles are shifted by about 70 µm, which corresponds to 28 grating elements. The measured profiles are inverted to match the polarity of the BPR sequence. One can see that the etching process leaves some residual roughness at the bottom of a groove (at the top of the plotted features in Fig. 2), since it is not yet optimized to produce the desired height and minimum residual roughness. However, since the deviations from the ideal profile are significantly smaller than the grating groove height, there should not be a noticeable perturbation of the resulting PSD spectrum of the grating. Moreover, a reasonable assumption about the random character of the perturbations suggests a white-noise-like spectrum of the perturbation that is the desired property of the BPRG test surface. Figure 3 compares the 1D PSD spectrum of a unit-height 4095-element theoretical BPR pattern with an element grid spacing of 1 µm computed over the entire 4095 point set (dashed straight line) with the PSD computed from subsets of the full 4095 element array. The noisy spectrum resulting when only the first 480 points are used in the calculation is shown as the red curve. The speckle noise is significantly reduced by averaging the spectrum of nine 480-point subsets of the main pattern, each shifted successively by 400 pixels. This latter curve corresponds more closely to the general observed case when the grating is viewed by a real microscope system. For the simulation, we use the same discrete PSD algorithm as the one described in Refs. 2-4. The spectrum of the ideal BPRG function is indeed a white-noise-like straight line with no fluctuations and with amplitude of 0.5. The amplitude corresponds to an expectation value based on the duty cycle of approximately 0.5 of the maximum-length pseudo-random sequence used in the construction. For real experimental arrangements, when an instrument with finite detector pixel size is used, one can not expect the spacing of the grating projected onto the detector to line up exactly with 8
the boundaries of each detector pixel. We simulated such a situation corresponding to a measurement with the MicromapTM-570 microscope with a 2.5× objective. The total number of detector pixels is 480 and the size of each pixel projected onto the grating is 3.92 µm. In this case, the grating pattern is undersampled and the pixel width encompasses more than one grating element. The simulation was aligned to have the first grating element at the left edge of the profile. The result of the simulation is shown in Fig. 4 together with the BPRG profile measured with the instrument over the same profile length. The corresponding PSD spectra are shown in Fig. 5. 4. MTF correction with BPRG
The high frequency roll-off of the measured spectrum (Fig. 5b and Fig. 6a) is the result of two primary MTF effects: the lens aperture and the pixel array size. The transfer function for a diffraction-limited objective with incoherent illumination is given by21,22
MTFO ( f ) =
2
π
[− Ω
]
1 − Ω 2 + ArcCos Ω ,
where Ω = λ f 2 NA , λ is the measuring wavelength (0.52 µm), f =
(4)
f x2 + f y2 , and NA is the
numerical aperture (0.075 for a 2.5× objective). After correction for the lens MTF, the high frequency tail of the spectrum is raised (Fig. 6b) but it is still exhibits significant roll off. The instrumental MTF associated with sampling with finite pixels (see, e.g., Ref. 21) is given by 2 Sin π Dx f x Sin π Dy f y MTFP ( f x , f y ) = , π Dx f x π Dy f y
9
(5)
where f x and f y are the components of the spatial frequency, and D x and D y are the effective pixel sizes projected on to the surface plane. The result of applying this correction with an optimal effective pixel size of 5.1 µm to the lens-corrected PSD is shown in Fig. 6c. In this case, the corrected PSD flattens out to a noisy horizontal line, becoming a white-noise-like spectrum, indicating that the applied MTF corrections are sufficient to account for the observed highfrequency roll-off. Therefore, using the BPRG we are able to experimentally find the instrumental MTF and correct the measured PSD spectra for the MTF. The success of the correction is ensured by the deterministic character of the pseudo-random sequence used to fabricate the BPRG test surface and, therefore, the possibility to precisely simulate the PSD spectrum inherent for a certain part of the grating. 5. Discussion
The choice of a binary pseudo-random sequence for the test grating has two major advantages compared with random 1D surfaces built based on sequences obtained with a random number generators or white noise sources, e.g., with a grinding process.23 Both advantages relate to the requirement of ease of specification and reproducibility of the test surface when used as a certified standard. First, a binary height distribution with two normalized heights, ‘1’ and ‘0’, can be easily specified for a number of production processes, e.g., lithography. The absolute value of the height would be determined based on requirements for a particular application, such as the range of measurable heights of the instruments. Possible perturbations of the shape of the rectangular grooves of a BPR grating would just lead to a slight change of overall amplitude of the flat PSD spectrum without any noticeable perturbation of its spatial frequency dependence
10
(flat) for frequencies lower than the frequency corresponding to the characteristic size of a unit groove. Second, a pseudo-random sequence has spectral characteristics that are mathematically rigorous, reproducible and amenable to simulation, allowing one to deterministically construct a maximum-length random sequence with an ideal (‘one-bit’ wide) autocorrelation function optimal for a particular instrument. As mentioned above, a distinguishing property of the BPR grating is that its PSD spectrum is a result of the distribution of the grooves, rather than the groove shape. This determines a low sensitivity of the BPRG PSD spectrum to the shape perturbation of a groove, which would be seen only at frequencies significantly higher than the Nyquist frequency of the instrument. In any case, if the perturbation is random, it does not change the inherent random (white-noise-like) character of the BPRG PSD spectrum. Moreover, the overall magnitude of the BPRG PSD spectrum is determined by the depth of the grooves. Therefore, for a reasonably designed BPRG standard, the contribution of the roughness of the grating surface can be easily made to be insignificant. The deterministic character of the BPR grating allows precise simulation of the theoretical (ideal) PSD spectrum of the standard and comparison of it with an experimentally measured spectrum. But for some applications, the theoretical spectrum can be approximated with an ideal (without variation) white-noise-like spectrum. In this case, the amplitude of fluctuations of the measured PSD spectrum can be significantly decreased by averaging the PSD spectra measured at random shifts of the BPR grating with respect to the field of view of the instrument (compare with Fig. 3). A further reduction in the variance can be obtained if one applies an averaging procedure used in Refs. 3 and 4. In this case the measured height profiles are divided into a number of shorter length profiles and the PSD spectra of each subset are averaged. 11
Even though in this work we only discuss in detail the design and properties of a 1D BPR grating, the suggested approach can be easily extended to the two-dimensional (2D) case, if a test surface with a binary pseudo-random 2D pattern24,25 were designed. Such a test surface would have the same advantages (a mathematically deterministic character and ease of specification and reproduction), in comparison to a 2D gray random target constructed with a generator of random numbers.26 An additional advantage of the 2D pseudo-random PSD standard would be the possibility for a direct 2D calibration of the instrumental MTF. We would also like to point out that the suggested calibration method using a BPR grating and/or the extended method based on a 2D pseudo-random test surface meets the two main requirements for use as a certified standard: ease of specification and reproducibility of the test surface. A patent application covering the described technology has been filed. Acknowledgements
The authors are grateful to John Warren, Don Elliott, Abdel Isakovic, and Rolf Beuttenmuller at Brookhaven National Lab for fabrication of the BPRG test surface and Farhad Salmassi for measurements with an atomic force microscope. The Advanced Light Source is supported by the Director, Office of Science, Office of Basic Energy Sciences, Material Science Division, of the U.S. Department of Energy under Contract No. DE-AC02-05CH11231 at Lawrence Berkeley National Laboratory. This manuscript has been authored in part by Brookhaven Science Associates, LLC under Contract No. DE-AC02-98CH10886 with the U.S. Department of Energy. The United States Government retains, and the publisher, by accepting the article for publication, acknowledges, a world-wide license to publish or reproduce the published form of this manuscript, or allow others to do so, for the purposes of the United States Government. Disclaimer
12
Certain commercial equipment, instruments, or materials are identified in this document. Such identification does not imply recommendation or endorsement by the US Department of Energy, LBL, LBNL, ALS, or BNL, nor does it imply that the products identified are necessarily the best available for the purpose.
13
REFERENCES
1. R. N. Bracewell, “The Fourier Transform and Its Applications,” McGraw-Hill Publishing Company, New York (1986). 2. V. V. Yashchuk, A. D. Franck, S. C. Irick, M. R. Howells, A. A. MacDowell, W. R. McKinney, “Two dimensional power spectral density measurements of x-ray optics with the Micromap interferometric microscope,” Proceedings of SPIE 5858, pp. 58580A-112 (2005). 3. V. V. Yashchuk, S. C. Irick, E. M. Gullikson, M. R. Howells, A. A. MacDowell, W. R. McKinney, F. Salmassi, T. Warwick, “Cross-check of different techniques for two dimensional power spectral density measurements of x-ray optics,” Proceedings of SPIE 5921, pp. 59210G-1-12 (2005).
4. V. V. Yashchuk, E. M. Gullikson, M. R. Howells, S. C. Irick, A. A. MacDowell, W. R. McKinney, F. Salmassi, T. Warwick, J. P. Metz, T. W. Tonnessen, “Surface roughness of stainless-steel mirrors for focusing soft x rays,” Applied Optics 45(20), 4833-42 (2006). 5. L. Assoufid, O. Hignette, M. Howells, S. Irick, H. Lammert, P. Takacs, “Future metrology needs for synchrotron radiation grazing-incidence optics,” Nucl. Instrum. and Meth. in Phys. Research A 467-468, 267-70 (2001). 6. E. L. Church, H. A. Jenkinson, and J. M. Zavada, “Relationship between surface scattering and micro-topographic features,” Opt. Eng. 18(2), 125-36 (1979). 7. D. Attwood, “Soft X-rays and Extreme Ultraviolet Radiation,” Cambridge University Press, New York (1999). 8. G. D. Boreman, “Modulation Transfer Function in Optical and Electro-optical Systems,” SPIE Press, Bellingham (2001).
14
9. K. Creath, “Calibration of Numerical aperture effects in interferometric microscope objectives,” Applied Optics 28(15), 3333-8 (1989). 10. P. Z. Takacs, M. X. Li, K. Furenlid, E. L. Church, “Step-height standard for surface-profiler calibration,” Proceedings of SPIE 1995, 235-44 (1993). 11. C. R. Wolfe, J. D. Downie, and J. K. Lawson, “Measuring the spatial frequency transfer function of phase-measuring interferometers for laser optics,” Proceedings of SPIE 2870, 553-7 (1996). 12. H. G. Rhee, T. V. Vorburger, J. W. Lee, and J. Fu, "Discrepancies between roughness measurements obtained with phase shifting interferometer and white-light interferometry," Applied Optics 44(28) 5919-27(2005). 13. A. Harasaki and J. C. Wyant, "Fringe modulation skewing effect in white-light vertical scanning interferometry," Applied Optics 39, 2101-6 (2000). 14. T. Etzon, “Construction for perfect maps and pseudo-random arrays,” IEEE Trans. on Information Theory 34(5), 1308-16 (1988). 15. D. D. Koleske, and S. J. Sibener, “Generation of pseudo-random sequence for use in crosscorrelation modulation,” Rev. Sci. Instrum. 63(8), 3852-5 (1992). 16. H. D. Luke and A. Busboom, “Binary arrays with perfect odd-periodic autocorrelation,” Applied Optics 36(26), 6612-9 (1999). 17. V. L. Hirschy, and J. P. Aldridge, “A Cross Correlation Chopper for Molecular Beam Modulation,” Rev. Sci. Instrum. 42(3), 381-3 (1971). 18. G. Comsa, R. David, and B. J. Schumacher, “Magnetically suspended cross-correlation chopper in molecular beam-surface experiments,” Rev. Sci. Instrum. 52(6), 789-91 (1981).
15
19. V. V. Yashchuk, B. N. Ashkinadzi, M. N. Groshev, V. F. Ezhov, T. A. Isaev, V. A. Knyazkov, G. B. Krygin, V. L. Ryabov, “Cross-Correlation Time-of-Flight Spectrometer of Gas-Dynamic Molecular Beams,” Instruments and Experimental Techniques 40(4), 501 (1997).
20. G. M. Jenkins and D. G. Watts, “Spectral Analysis and its Applications,” fifth printing, Emerson-Adams Press, Boca Raton (2000). 21. J. W. Goodman, “Introduction to Fourier Optics,” third edition, Roberts & Company Publishers, Englewood (2005). 22. E. L. Church, P. Z. Takacs, “Effects of optical transfer function in surface-profile measurements,” Proceedings of SPIE 1164, 46-59 (1989). 23. J. F. Song and T. Vorbuerger, "Standard reference specimens in quality control of engineering surfaces," J. Res. of the Natl. Inst. Stand. Technol. 96, 271 (1991). 24. E. E. Fenimore, T. M. Cannon, “Coded aperture imaging with uniformly redundant arrays,” Applied Optics 17(3), 337-47 (1978). 25. E. Caroli, J. B. Stephen, G. Di Cocco, L. Natalucci, A. Spizzichino, “Coded aperture imaging in x- and gamma-ray astronomy,” Space Science Reviews 45, 349-403 (1987). 26. E. Levy, D. Peles, M. Opher-Lipson, and S. G. Lipson, “Modulation transfer function of a lens measured with a random target method,” Applied Optics 38(4), 679-83 (1999).
Biographies
Valeriy V. Yashchuk received his MS degree in experimental physics from St. Petersburg State
University (Russia) in 1979, and his PhD degree from St. Petersburg Nuclear Physics Institute
16
(Russia) in 1994. He is currently leading the Optical Metrology Laboratory at the Advanced Light Source, Lawrence Berkeley National Laboratory. He has authored more than 50 scientific articles in the fields of atomic and molecular physics, nonlinear optics, electro- and magnetooptics, laser spectroscopy, experimental scientific methods and instrumentation, and optical metrology. In 1986 for the development of a method of reduction of phase space of an atomic beam he was awarded the Leningrad Komsomol Prize in physics. In 2007, he received R&D Magazine’s R&D 100 Award for development of Laser-Detected MRI. His current research interest is in X-ray optics, optical instrumentation and metrology for X-ray optics.
Wayne R. McKinney received his BA, MA, and PhD in Physics from The Johns Hopkins
University, finishing in 1974 with a thesis in ultraviolet astronomy. He then completed a postdoctoral appointment in molecular biology supported by a National Cancer Institute Fellowship at the Biology Department of Brookhaven National Laboratory in 1977.
Remaining at
Brookhaven from 1977 to 1979 in the Instrumentation Division he designed optical systems for the National Synchrotron Light Source. From 1979 to 1987 he joined the research staff of the Richardson Grating Lab in Rochester New York, becoming Manager of Diffraction Grating R&D in 1981. From 1987 to 1989 he was a staff scientist in the Center for X-Ray Optics at Lawrence Berkeley National Laboratory working on water cooled optical components and monochromator designs for the Advanced Light Source. This work won local and national Tech Transfer Awards, and led to Fellow status in the OSA. He now works directly for the Advanced Light Source where he designed and built the first infrared beamlines. Currently his responsibilities are in optical metrology, particularly the specification of X-ray optics by calculation of scattering.
17
Peter Z. Takacs directs the activities of the Optical Metrology Laboratory in the Instrumentation
Division of Brookhaven National Laboratory. He is actively involved in the development of instrumentation, methods, and standards used for testing the figure and finish of aspheric optics, such as those used for reflecting x-rays at grazing incidence. He received a BA from Rutgers University in 1969 and a PhD in physics from Johns Hopkins University in 1974. He received an R&D 100 Award and a Photonics Spectra Circle of Excellence Award in 1993 for development of the Long Trace Profiler.
Figure captions:
Figure 1: First 100 elements of the BPR sequence (see text for details).
Figure 2: Measured profiles made near the left edge of a prototype BPR grating with a MicromapTM-570 interferometric microscope with a 50× objective. Also shown are the corresponding points in the computed BPR function. The measured profiles are inverted to match the polarity of the computed function.
Figure 3: 1D PSD spectrum of the ideal unit-height BPR grating function with 4095 total number of pixels placed on a 1µm pitch grid: black (dashed) straight line includes all 4095 points in the calculation; red (solid) irregular line is from a subset of the first 480 points; black (solid) line is average of nine 480-point spectra, each shifted by 400 pixels.
18
Figure 4: Profile of the first 200 µm of the 5095 element BPR grating with 2.5 µm pitch: ideal computed function re-sampled to the 3.92 µm grid (red solid curve), and profile measured with the MicromapTM-570 microscope with 2.5× objective, (blue dashed curve).
Figure 5: 1D PSD spectrum of the 4095 element, 2.5-µm pitch, BPR grating: a) (red, upper) for the model simulation re-sampled onto a 3.92 µm grid, and b) (blue, lower) for the profile measured with the MicromapTM-570 microscope with 2.5× objective. The simulation and measurement fields of view correspond to the 480 pixel row length in the Micromap. Vertical offset of the lower spectrum is made for clarity.
Figure 6: 1D PSD spectrum of the prototype BPRG with 4095 total number of elements with 2.5-µm pitch measured with the MicromapTM-570 microscope with 2.5× objective: a) (lower, red) average uncorrected raw PSD curve; b) (middle, blue) corrected to account for MTF due to the objective lens aperture, and c) additionally corrected for the MTF of the finite pixel width.
19
20
21