E3S Web of Conferences 68, 04020 (2018) 1st SRICOENV 2018
https://doi.org/10.1051/e3sconf /20186804020
Biosorption Processof Synthetic Textile Wastewater using Bjerkandera Agustavia Response Surface Methodology (RSM) Ariani Dwi Astuti1,2,*and Khalida Muda1 1
Department of Water and Environmental Engineering, School of Civil Engineering, Faculty of Engineering, Universiti Teknologi Malaysia, Johor, Malaysia 2 Department of Environmental Engineering, Faculty of Landscape Architecture and Environmental Technology, Universitas Trisakti, Jakarta, Indonesia
Abstract. Textile industry generates large quantities of wastewater. Discharging effluent of textile industry without treatment is led to the degradation of the quality of receiving water bodies.A high color, high BOD/COD and salt (Total Dissolved Solids, TDS) load are founded in the textile wastewater. Several alternative of methods,including physicochemical methods such as filtration, carbon activated, coagulation and chemical flocculation have been used to treat textile industry wastewater. Although these methods are effective, but they are expensive and result concentrated sludge that creates a secondary disposal problem. The passive uptake of organic and inorganic species including metals and dyes from aqueous solutions by the use of non-growing/living microbial mass or their derivatives is namely biosorption.The effects of pH, weight of biosorbent, contact time and size of biosorbent in biosorption process using Bjerkandera adusta in synthetic textile wastewater were investigated and optimized using response surface methodology (RSM). The optimum removal conditions were determined at pH 4, contact time 90 minutes, weight of biosorbent 3000 mg/L, and size of biosorbent 0.4 mm. Color removal of 53.55% was demonstrated, the experimental data and model 2 predictions agreed well. In the optimization, R2 and 𝑅𝑎𝑑𝑗 correlation coefficients for the quadratic model was estimated quite satisfactorily as 0.988 and 0.977, respectively.
1 Introduction Textile dyeing processes use water in large quantities, therefore becomeone of the leading generators of liquid pollutants[1]. Textile industries involving dyeing and finishing processes are applied to fabrics that generates around 17% to 20% of industrial waste water estimated by the World Bank[2]. The treatment of waste water generated from textile industries raises a most important challenge in the protection of environment, especially in *
Corresponding author:
[email protected]
© The Authors, published by EDP Sciences. This is an open access article distributed under the terms of the Creative Commons Attribution License 4.0 (http://creativecommons.org/licenses/by/4.0/).
E3S Web of Conferences 68, 04020 (2018) 1st SRICOENV 2018
https://doi.org/10.1051/e3sconf /20186804020
term of cost or quality of the final textile effluent[3]. Textile dyeing industries use sufficient amount of various dyes or auxiliary chemicals during the dyeing process and finally emits strong coloured waste water with a huge number of dye particulates /molecules[4].Textile effluents/waste waters are one of the most difficult to treat because of the presence of suspended solids, dyes, salts, additives, detergents,and surfactants in a massive amount[5].Currently, the larger class of produced synthetic dyes world wide (about 70%) are represented by azo dyes and its large amount generation might be related with its usage by diverse industrial sectors for example textile clothing,paper, cosmetics and food [6]. Various methods are being practiced for the treatment of textile effluents including physico-chemical methods like carbon activated, sedimentation, filtration, activated sludge, chemical flocculation and coagulation. Most of these methods are very effective however, some are costly and result in concentrated sludge by creating secondary disposal complication. The passive intake of organic or inorganic species liked yes and metals from aqueous environment by the application of non-living/non-growing microbial biomass including derivatives are known as biosorption. Fungi, mainly white rot fungi, are being approved for their capacity to degrade a wide range of recal citrant pollutants, such as synthetic dyes[7]. The best degradation rates were reported for Bjerkandera adusta, whose strain was able to entirely decolourisea large number of dyes and detoxified three synthetic waste waters [5]. Bjerkandera adusta, Phanerochaete chrysosporium and Pleurotus ostreatus exhibited the best decolorization properties, among thirty different basidiomycetes screened[8]. From the eighteen evaluated fungal stains, Phanerochaete Chrysosporium, Trametes versicolor and Bjerkandera adusta proved the ability to decolorize all the tested dyes [9].Bjerkanderaadusta with its ligninolytic enzyme production point that this strain could be promising for biotechnological development, 98% decolorization was accomplished[10]. Some pre-treatment techniques can improve the biomass adsorption capacity. Otherpre-treatment methods include autoclaving, which could break the structure of the fungus and expose the possibledye binding sites[11]. The main aim of this study is to investigate the effects of pH, weight of biosorbent, contact time and size of biosorbent in biosorption process using Bjerkandera adusta in synthetic textile waste water. Among the advanced relevant variable methods employed in analytical improvement, response surface methodology (RSM) was followed here. RSM wasapplied to design the experiments, develop models and determine the optimum conditions.
2 Materials and Methods 2.1 Synthetic Textile Effluent Synthetic waste water sample with the following content was maintained: K2HPO4 0.58 g/L ,NH4Cl 0.16 g/L, KH2PO4 0.23 g/L,MgSO4⋅7H2O 0.09 g/L,CaCl2⋅2H2 0 0.07 g/L, trace solution 1 ml/L and EDTA 0.02 g/L. The source of carbon considered in this experiment were sodium acetate (0.5 g/L), glucose (0.5 g/L) and ethanol (0.125 g/L). The composition of the trace element was FeCl3⋅4H2O (1.5 g/L), H3BO3 (0.15 g/L), MnCl2⋅4H2O (0.12 g/L), ZnCl2 (0.12 g/L), CoCl2⋅6H2O (0.15 g/L), CuCl2⋅2H2O (0.03 g/L), NaMoO4⋅2H2O (0.06 g/L), and KI 0.03 g/L[12]. Mixed azo dyes consisted of reactive black 5, reactive blue 4 and disperse orange 2 with a total concentration of 60 mg/L was used for this study.
2
E3S Web of Conferences 68, 04020 (2018) 1st SRICOENV 2018
https://doi.org/10.1051/e3sconf /20186804020
2.2 Biosorbents Preparation The fungi Bjerkandera adusta was grown in malt extract agar (prepared in laboratoryby following the descriptions of DMZS media number 90) at a pH equal to 5.6, 25°C in stationary condition. When sporulation occurred at the end of seven days [13], and then in order to kill the fungal biomass, the fungal biomass was autoclaved for 45 min at 121 °C, 103.42 kPa [14]. Then this autoclaved nonviable biomass was thoroughly washed with double distilled water and kept in the oven at 70 ± 1 °C for 36 hours. The dry fungal biomass was after wards crushed to powder form and sieved to get a granular size of 0.20.6mm. 2.3 Batch Experiments Batch experiments were operated by shaking 50 ml of synthetic textile waste water with biosorbent in a flask at 25 ± 2 °C temperature in the presence of 160 rpm shaking speed[15]. The flasks were then withdrawn and centrifuged to getliquid-solid separation, after shaking the flask for predetermined time intervals, and then ready to be analyzed. Beside color removal, the morphologicalstructure was analyzedby using scanning electron microscopy (SEM) (TM3000 Hitachi High Technologies America, USA) and chemical characterization was analyzedby fourier transform infrared (FTIR) spectroscopy (Nicolet iS10 FT-IR Spectrometer, USA). 2.4 Experimental Design A four-factor having five-level CCD that required almost 30 experiments were used in this experiment.The variations and variables were as follows; A: pH (4-8), B: weight of biosorbents, C: contact time (30-150 minutes), D: size of biosorbents (0.2-0.6 ± 0.05mm). For statistical reasons the experiments were randomized and each of the test was run in duplicates. A software package, named Design Expert Version 11 (Stat-Ease, Statistic Made Easy, MN, United States) was used.
3 Results and Discussions Response surface methodology could be an assortment of mathematical and applied mathematics techniques supported the work of a polynomial equation of the experimental information, that should define the behaviour of a knowledge set with the target of creating applied mathematics previsions[16]. RSM is a no table section of experimental design as well as an important means in optimizing its performance, developing new processes, formulation of new products or improving the design. The biggest application in industrial research, particularly in situations where a huge number of variables affect system features [17]. In this study, the predicted data values were attained bya model-fitting method that used Design Expert software. After fitting these data to differents model for example cubic, two factorial, linearand quadratic and their successive ANOVA exhibited that the whole reaction is most suitably explained with a mathematical quadratic polynomial model. This quadratic modelstated in coded variables and is described by the mathematical equation (1) as follows: Color Removal (%)= + 17.84-11.09A+4.88B+0.775C-1.87D+3.88A2+0.25B2 +0.1013C2+0.6338D2-2.54AB-0.325AC+2.03AD-0.2075BC -0.6888BD+0.1863CD
3
(1)
E3S Web of Conferences 68, 04020 (2018) 1st SRICOENV 2018
https://doi.org/10.1051/e3sconf /20186804020
where A is pH, B weight of biosorbents, C is contact time, and D the size of biosorbents. In ANOVA, a ratio between regression mean and error mean sum of squares i. e the distinction between the predicted values and experiment derived values provide F-value, while P-value denotes the probability value of corresponding F-value. The software produces model coefficients, P-values and F-values (Prob.> F) for the model fitted, which point to aninsignificant probability and support each of the experimental variable’s significance. If the P value is less than 0.05 (i. e very small), itdenotes that each term of this model has a significant outcome on the response. Table 1. Analysis of variance (ANOVA) and model coefficients found from Dye Biosorption Process using Bjerkandera Adusta Source
Sum of square
Degree of freedom
Mean square
F-value
P-value
Model
4223.68
14
301.69
91.5
< 0.0001
A-pH
2953.93
1
2953.93
895.88
< 0.0001
570.57
1
570.57
173.04
< 0.0001
14.41
1
14.41
4.37
0.054
84.15
1
84.15
25.52
0.0001
103.43
1
103.43
31.37
< 0.0001
AC
1.69
1
1.69
0.5125
0.485
AD
66.02
1
66.02
20.02
0.0004
BC
0.6889
1
0.6889
0.2089
0.6542
BD
7.59
1
7.59
2.3
0.15
CD
0.555
1
0.555
0.1683
0.6874
A²
412.39
1
412.39
125.07
< 0.0001
B²
1.71
1
1.71
0.5199
0.482
C²
0.2812
1
0.2812
0.0853
0.7743
D²
11.02
1
11.02
3.34
0.0875
Residual
49.46
15
3.3
Lack of Fit
48.35
10
4.83
21.76
0.0017
Pure Error
1.11
5
0.2221
Cor Total
4273.14
29
B-Weight Biosorbent C-Contact Time D-Size of Biosorbent AB
A Model F-value equal to 91.50 recommends that this model is significant having only 0.01% (very small) chance that an F-value of this amount could developas a result of noise. P-values lower than 0.0500 (approx.) specify the model terms are not in significant. In such case, A, B, D, AB, AD, A² were significant terms of the model. A bigger value than 0.1000 shows the model terms are in significant. If there found several in significant model terms (excluding those terms required to support hierarchy), there might be a need for model reduction to improve the model.A F-value equal to 21.76 suggests the Lack of Fit was
4
E3S Web of Conferences 68, 04020 (2018) 1st SRICOENV 2018
https://doi.org/10.1051/e3sconf /20186804020
significant. Moreover, there is 0.17% chance only that a Lack of Fit F-value of this amount might occur owing to surrounding noise. The lack of fit (LOF) F-test portray the data variation inside the fitted model. Here, if the model data does not match the given data correctly, its hall be significant. On the other hand, the small values of P due to LOF 4 is desirable. A value of the ratio equal to 37.058 specifies a satisfactory signal. Hence, this model may be applied to navigate the experimental design(Fig 1).
Fig. 1. A Graph of The Predicted Vs Experimental Values fo rColor Removal in Biosorption Process Using Bjerkandera Adusta
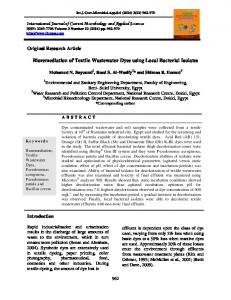
SEM analysis was carried out to explain the morphological characteristics including surface features of the used adsorbent sample. This also projects the surface porosity and structure/texture of the treated adsorbent [18]. Capacity of adsorption depends on particle size, pore size distribution, and surface area or micro / meso porosity [18]. SEM analysis was done for biosorbent B.adusta before and after biosorption process of synthetic textile effluent/waste water at various magnification (8000X and 2000X). Control and treated biosorbent were verified to observe transformations in the biosorbent after certain contact with the pollutant dye (Figure 2). Figure2 (a and b) illustrates the morphology of biosorbentB. adusta showing the pores. Size of pores biosorbentB. adustawas ranged 2.748.30µm and after biosorption process become 1.31-2.14 µm. It is clear that the dye deposits between biosorbent B.adusta show it self as crystalline form. Therefore, SEM micrograph confirmed the maximum affinity to the studied dye. These resultsupport previous researchby other investigators, Mahmoedet al. , 2017 that use baker’s yeast[19].
5
E3S Web of Conferences 68, 04020 (2018) 1st SRICOENV 2018
https://doi.org/10.1051/e3sconf /20186804020
(a)
(b) Fig. 2. Before (a) and after (b) biosorption process magnification powers (2000X and 8000X)
Fig. 3. FTIR spectrum of biosorbent B. adusta
Functional groups in biosorbents B. adusta were analyzed using FTIR spectroscopy in order to discover the functional groups which may bond with dyes in synthetic textile wastewater. The IR spectrum of the sample adsorbent was recorded in a range of 4000 400 cm-1.The O-H stretching adsorption band in the crystal structure of biosorbent is observed at 3270 to 3000 cm-1 which indicates the presence of an OH group.From Figure. 3 It could be discovered that the most prominant bands detectedat 3270, 2920, 1640, 1580,
6
E3S Web of Conferences 68, 04020 (2018) 1st SRICOENV 2018
https://doi.org/10.1051/e3sconf /20186804020
1160, and 1030 cm-1.However, a weak absorption peak at 2920 cm-1normallyindicates to aliphatic groups (symmetrical and asymmetrical stretch/vibration of CH3). A cluster of water molecules that was assigned to free hydroxyl on biosorbents B. adusta represented by the peak at 1640cm-1. The peak at 1160 cm-1 may indicate to stretching band of C-O of alcohol or hydroxyl or ether groups. Therefore, above results show that the presence of functional groups onto the biosorbent B. adustasurface affected the biosorption mechanism. There are similarities between the results in this study and those described by Mahmoud, 2016 [19] and K. Jain, 2007 [20].
4 Conclusion From the study found that variables such as pH, weight of biosorbent and size of biosorbent were the major factors that affected the color removal in biosorption process using Bjerkandera Adusta. Under the optimized conditions, experimental values are as predicted, indicating the model suitablity and the success of RSM in optimizing the condition of the biosorption process using Bjerkandera Adusta. R2 and R2 adj correlation coefficients for the quadratic model was evaluated having quite satisfactory valua as 0.9776 and 0.9345, respectively.SEM micrographs observation and FTIR observation permitted us to conclude that the process that occurs during colour removal followed biosorption mechanism.
Acknowledgments The authors wish to thank Universiti Teknologi Malaysia for the financial supports of this research (Grant No. 18H96).
References 1.
H. Hayat, Q. Mahmood, A. Pervez, Z. A. Bhatti, and S. A. Baig. J. Sep. Purif. Technol 154 (2015) 2. C. R. Holkar, A. J. Jadhav, D. V. Pinjari, N. M. Mahamuni, and A. B. Pandit. J. Environ. Manage 182 (2016) 3. A. M. T. Mata, H. M. Pinheiro, and N. D. Lourenço, J. Biochem. Eng 104 (2015) 4. Y. M. Kolekar, H. N. Nemade, V. L. Markad, S. S. Adav, M. S. Patole, and K. M. Kodam. J. Bioresour. Technol 104 (2012) 5. A. Anastasi, F. Spina, V. Prigione, V. Tigini, P. Giansanti, and G. C. Varese. J. Bioresour. Technol 101, 9 (2010) 6. B. E. L. Baêta, D. R. S. Lima, S. Q. Silva, and S. F. Aquino J 259 (2015) 7. A. Anastasi, F. Spina, A. Romagnolo, V. Tigini, V. Prigione, and G. C. Varese, J. Bioresour. Technol 123 (2012) 8. I. Eichlerova, L. Homolka, and F. Nerud. J. CCBAS 232 75 (2007) 9. A. Heinfling, M. Bergbauer, and U. Szewzyk. J. Appl. Microbiol. Biotechnol 48, 2 (1997) 10. N. Gomi et al. J. Biodegradation 22, 6 (2011) 11. A. Srinivasan and T. Viraraghavan, J. Environ. Manage 91, 10 (2010) 12. K. Muda et al. J. Water Res 44, 15 (2010)
7
E3S Web of Conferences 68, 04020 (2018) 1st SRICOENV 2018
https://doi.org/10.1051/e3sconf /20186804020
13. I. Tatl and O. Tunc, 142 (2008) 14. K. Kumari and T. E. Abraham, J. Biosorption of anionic textile dyes by nonviable biomass of fungi and yeast 98 (2007) 15. S. W. Won, H. Kim, S. Choi, B. Chung, K. Kim, and Y. Yun, J. Performance , kinetics and equilibrium in biosorption of anionic dye Reactive Black 5 by the waste biomass of Corynebacterium glutamicum as a low-cost biosorbent 121 (2006) 16. M. A. Bezerra, R. E. Santelli, E. P. Oliveira, L. S. Villar, and L. A. Escaleira. J. Talanta 76, 5 (2008) 17. B. K. Körbahti and M. A. Rauf. J. Chem. Eng 136, 1 (2008) 18. P. A. Listyanto, D. Vitasary, R. Indra, and D. Islamica. J. Coal Bottom Ash and Activated Carbon for Removal of Vertigo Blue Dye in Batik Textile Waste Water : Adsorbent Characteristic , Isotherms , and Kinetics Studies 14, 5 (2016) 19. M. S. Mahmoud. J. HBRC 12, 1 (2016) 20. K. Jain, V. Shah, D. Chapla, and D. Madamwar. J. Hazard. Mater 213–214 (2012)
8