Boosting the Ranking Function Learning Process using Clustering Giorgos Giannopoulos
Theodore Dalamagas
Magdalini Eirinaki
School of EC Engineering NTU Athens Greece
IMIS Institute “Athena” Research Center Greece
Computer Engineering Dept San Jose State University USA
[email protected]
[email protected] Timos Sellis
[email protected]
IMIS Institute “Athena” Research Center Greece
[email protected]
ABSTRACT
Keywords
As the Web continuously grows, the results returned by search engines are too many to review. Lately, the problem of personalizing the ranked result list based on user feedback has gained a lot of attention. Such approaches usually require a big amount of user feedback on the results, which is used as training data. In this work, we present a method that overcomes this issue by exploiting all search results, both rated and unrated, in order to train a ranking function. Given a small initial set of user feedback for some search results, we first perform clustering on all results returned by the search. Based on the clusters created, we extend the initial set of rated results, including new, unrated results. Then, we use a popular training method (Ranking SVM) to train a ranking function using the expanded set of results. The experiments show that our method approximates sufficiently the results of an ”ideal” system where all results of each query should be rated in order to be used as training data, something that is not feasible in a real-world scenario.
Search engine, ranking, training, clickthrough data, relevance judgement, clustering
Categories and Subject Descriptors H.3.3 [Information Search and Retrieval]: Information Search and Retrieval—Relevance feedback, Search process, Clustering.
General Terms Algorithms, Experimentation, Measurement
Permission to make digital or hard copies of all or part of this work for personal or classroom use is granted without fee provided that copies are not made or distributed for profit or commercial advantage and that copies bear this notice and the full citation on the first page. To copy otherwise, to republish, to post on servers or to redistribute to lists, requires prior specific permission and/or a fee. WIDM’08, October 30, 2008, Napa Valley, California, USA. Copyright 2008 ACM 978-1-60558-260-3/08/10 ...$5.00.
1.
INTRODUCTION
As the information available on the Web is constantly increasing, a significant amount of work has focused on finding ways to improve the accuracy of web search results by personalizing the ranked result list on user feedback. There exist two ways to acquire such feedback. Explicit feedback requires that users provide explicit judgments for the results. For example, users are asked to mark the results which they consider relevant to the posed query. On the other hand, implicit feedback requires that the users are not asked to provide anything explicitly. Instead, the feedback is inferred from the users’ clicktrough data obtained from Web logs. Examples include the results that were clicked, the time spent on a result page during a search session, etc. Information from both types of feedback is used to train ranking functions in order to generate personalized ranking lists. The terms relevance relations and relevance judgements are both used in the related literature to denote a relation, a label or a score that represents the degree of relevance between a result and the respective query. From this point on, we will use both terms intechangeably. Studies have shown that users do not like spending time to evaluate search results and provide explicit relevance judgements. Thus, ranking personalization based on implicit feedback is a quite popular approach. For example, [7] presents a method for learning ranking functions based on user implicit feedback. The method exploits relevance relations of the form ”result a is more relevant than result b” extracted automatically from Web logs to produce relevance judgments to train an SVM ranking function and adapt ranking to user needs. The problem. In all approaches of learning ranking functions from implicit feedback, relevance relations are extracted after considering only a small portion of the search
results (usually the top-10 results). This is due to the fact that users usually inspect only the first few results returned by a search engine, and click even fewer. So, the implicit feedback that is extracted from a user for a given query involves just a few relevance relations, and consequently only a few relevance judgements. In order to train a ranking function properly, a respectable amount of training data, namely relevance judgements, needs to be gathered. Since only a few judgements are extracted from each query, it is evident that a long training period and lot of users participating are needed for a successful training. Moreover, the more users participate (through their feedback) in the training, the less homogeneous the ranking function will be, since not all users have exactly the same search needs. Our approach. In this work, we address the aforementioned problems. We present a method that expands the initial set of relevance judgements obtained from implicit user feedback. This expanded set of relevance judgements is in turn used as input in the learning process. Thus, only a small proportion of user relevance judgements is needed for the training process, saving a significant amount of time. Moreover, this method can be successfully applied for small, yet thematically focused groups of users, in order to generate more accurate personalized rankings of the search results. Our method is summarized as follows: For each query, we use the top-10 search results to extract an initial set of relevance relations and produce the set of the relevance judgements R. This is the same process followed by most of the related approaches focusing on ranking methods based on implicit user feedback. All the search results are in turn clustered. The clusters are post-processed and those that are not informative are discarded. The remaining clusters are used to infer relevance judgements R0 for the non-judged (not viewed or clicked) search results in the clusters. Finally, the expanded set of relevance judgements R ∪ R0 is used to train an SVM ranking function and generate rankings that reflect the user needs. In this work we proposed a method to expand the set of relevance judgements estimated from implicit user feedback by adding new relevance judgements to have training data of larger quantity. Thus, by generating more training data per query per user, we allow a ranking function to be trained in a shorter period of time and for small groups of users (thus increasing the homogeneity of the training data and the results). Moreover, our method is general enough to be applied in every approch of ranking based on implicit user feedback. Through the experiments we conduct, we demonstrate that our method approximates sufficiently an “ideal” system, where the training input consists of relevance judgements for all results of each search query. Since the collection of such amount of data is infeasible, our method can be used as an approximation of the “ideal” one. Outline. In Section 2 we present the related work on the problem of additional relevance judgements exploration. In Section 3 we discuss the preliminaries related to ranking function learning. In Section 4, we present our method for expanding the set of relevance judgements by exploiting document clustering. Section 5 presents the experimental evalution, and, finally, Section 6 conludes and discusses further work.
2.
RELATED WORK
Previous approaches regarding the problem of increasing the quantity (and quality) of training data are based on rank promotion of results having low rank. In [12] the initial ranking presented to users is altered using the top-2 results. Specifically, the documents presented in positions 1 and 2 are selected using several strategies (randomly selected documents, pair of documents that have the largest pairwise loss contribution, e.t.c). Those top-2 results are placed on top of the initially ranked list. In [10] the aim is to promote new web pages that are disfavored from ranking algorithms that take into account the popularity of a page (defined in terms of how many times it was clicked). So, some documents with lower ranks are randomly selected and promoted to a higher place. This process enables such documents to be judged (clicked or not) by the users. Similarly to our approach, both methods aim at exploring additional user feedback to be used as training input in order to train a ranking function. Then, after the training phase is completed, this ranking function is used to re-rank the results presented to the user. Those methods, however, alter the initial ranking during the training process as well, by adding new documents on the top of the ranking list or promoting documents having low ranks. This altered list is used as input in the learning process. On the contrary, our method produces new relevance judgements for the unseen results but does not interfere with the initial ranking. Finally, clustering is exploited in SVM Ranking methods, but to achieve different goals. In [8], clustering of results is utilized in order to refine a very large training data set, by rejecting those data that are not necessary for the SVM training phase. For example, in [5], clustering is performed on the ranking functions learned from training data taken from different users.
3.
RANKING FUNCTION TRAINING
In what follows, we present some background information on ranking function training. During this process, an initial set of queries and results, inferred from the Web logs is used in order to generate the training set that will be used as input in the ranking function. More specifically, we outline the steps that comprise this process, including: a) extraction of relevance relations, b) feature extraction, and c) training of ranking function. Relevance Relation Extraction. Based on the results of a query, relevance relations can be extracted from either absolute or relative preferences. An absolute preference suggests that a search result is either relevant or irrelevant to a query. A relative preference suggests that a search result is more relevant to a query than another result. The extraction of those relations is mainly based on the results the user viewed or clicked. There are many approaches for extracting relevance relations. For instance, in [7, 11], where an approach that uses relative preferences is adopted, relevance relations are extracted by taking into consideration the relative position of a pair of results in the initial ranking. For example, a clicked result c is considered more relevant than all non-clicked results which are placed higher than c in the ranking list. An example of absolute preference is presented in [14]. In this work, if a result is clicked, then it is considered relavant to the query. Usually, every query-result pair is assigned a score or a label, named its relevance judgement, that denotes the degree of relevance between the result and the query. The set
Relevance relations set Result List
e ur n at tio Fe trac Ex
r1: r2: r3: . . rm . . rk
Relevance relations Extraction
r1: r2: r3:
rl:
rel. judg.1 rel. judg.2 rel. judg.3 . . . rel. judg.l
Training input
Feature vectors
Ranking function training (RSVM, RankBoost, RankNET, etc)
Feature weights for re-ranking
r1: < f11,f12,...f1n> r2: r3: . . . rm:
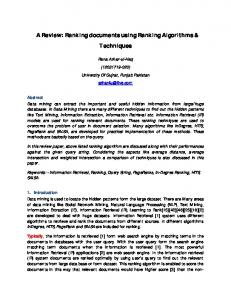
Figure 1: Ranking function training. of query-result pairs, together with the corresponding relevance judgements, comprise the first component that is input to the training process. The second component involves feature extraction from the query-result pairs. Feature extraction. Every query-result pair is represented by a feature vector which quantifies the matching quality between the query and the result. There exists a great variety of features that can be used in this process. Content-based features, which can be extracted from the title, the body, the anchor and the url of a result, can be used to estimate content similarity between the query and the result [9]. Some other features are based on hyperlink information (i.e., pagerank values) [2], or on specific information of the results such as the domain of the url or the rank of the result in several search engines [7]. Also, such features may incorporate statistical information over user behaviour, e.g., deviation from average time spent for viewing pages [1]. Ranking function training. Ranking function training aims at assigning a proper weight for each feature used in feature vectors. Those weights indicate which features are more important for ranking the search results in the context of the particular training process. Several training methods have been proposed, such as Ranking SVM [7], RankNET [3], RankBoost [6] as well as tuning methods for the aforementioned techniques [4]. Figure 1 shows the overall training process. Once the ranking function is trained, the results for each new query are re-ranked according to scores produced by the ranking function. Those scores are calculated utilizing the weights found in the previous step and the feature vector of each new search result. We should note that, regardless of the approach adopted, there has to be a specific representation of the relevance relations, so that they can be used as input to a ranking function training system. In this paper, we adopt the representation format of SVMlight1 , which is a popular tool that implements Ranking SVM [7]. In our case, three labels are used for relevance judgement: 0, 1, 2 denoting irrelevant, partially relevant and strongly rel1
http://svmlight.joachims.org/
evant results respectively. For each query-result pair viewed or clicked by the user, these relevance judgements can be extracted implicitly as described previously in this section.
4.
RELEVANCE RELATIONS EXPANSION
As described previously, the training of the ranking function requires a significant amount of training data as input. This means that we need to have a large amount of relevance judgements for query-result pairs. Collecting such relevance judgements from the users’ clickthrough data is a time consuming process. In this section, we present our approach, that generates the training set of relevance relations, expanding the (usually) small seed of user judgements coming from user implicit feedback. That is, our method extends the Relevance Relation Extraction phase described in Section 3, increasing the training data produced from implicit user feedback. Without loss of generality, we regard as implicit feedback for our system only the top-10 results, ranked using the greatest BM25 feature value [13] for each query. This decision draws from the behavior of most real-world users, who view only a few results and click even fewer, usually those on the first results’ page, that is the 10 first results. A challenging issue is to be able to exploit the rest of the search results (i.e., results that have not been viewed due to their low position in the initial ranking list), by trying to estimate relevance judgements for them. That is, we are looking for new relevance relations that involve those results. Our approach is a two-step process. We assume that only the relevance judgements of the top-10 results are available for each query. We first group all the search results into clusters of documents having similar content. Using this information, we subsequently expand this initial set of relevance judgements generating judgements for the rest (unseen) results of each query. We describe this process in what follows.
4.1
Clustering of Search Results
Given a feature space F of n terms, F = {t1 , t2 , . . . , tn }, where n is the total number of distinct terms in all doc-
uments returned as answer for a query, we represent each document by a feature vector vi = {wtdi1 , wtdi2 , . . . , wtdin }, where wtdik = tfik ∗ log(N/dfk ), tfik : frequency of occurrence of term tk in document i, N is the number of documents, and dfk is the number of documents that contain the term tk . We should note that, in our approach, we take into consideration the title and the abstract of each result in order to extract those features. After extracting the features, we cluster the results having similar content. We use a partitional clustering method that utilizes repeated bisections [16, 17]. This method has been shown to have excellent performance when dealing with document collections [16]. In the following, we give an overview of the clustering method. All documents (i.e., search results) are initially partitioned into two clusters (i.e., bisected). Then, one of these clusters is selected and is further bisected. This process is repeated until we get the desired number of clusters. In each step, the selection of the cluster to be bisected and the bisection itself, is done in such a way that the bisection optimizes the value of a clustering criterion function. The criterion function used to form the clusters aims at maximizing the following quantity: k s X X i=1
sim(v, u)
v,u∈Si
where k is the number of clusters, Si is the set of documents of cluster i, and sim(v, u) is the similarity value between documents v and u in Si . We employ the cosine similarity as the metric that compares two documents. We apply the cosine similarity function on the documents’ feature vectors as shown in the following Equation: Pn (wtdvi × wtdui ) pPn sim(v, u) = pPn i=1 2 2 i=1 wtdvi × i=1 wtdui Following this process for each search query, we obtain the clusters of its search results. Next, we show how we exploit these clusters to expand the relevance relations.
4.2
Relation expansion
The document clusters are used in order to expand the relevance relations’ set and estimate relevance judgements for documents that have not been judged yet. In this way, we will be able to exploit results that might not be included in the top-10 search results and find new relevance relations that involve those results. An example of this process is shown in Figure 2. Assume that search results r1 , r5 , r17 , r23 , r33 are all grouped in the same cluster. Each cluster contains results with or without relevance judgements. For example, given that the user has viewed or clicked only the top-10 results of the ranking list, relevance judgments may be extracted for r5 , r1 but not for r17 , r23 , r33 . Note that in our case (Section 3), three labels are used for relevance judgement: 0 for irrelevance, 1 for partial relevance and 2 for strong relevance. Since we use the clusters to estimate the relevance judgements of non-judged results, we need to refine the set of clusters. We achieve that by dropping clusters with low coherence in terms of the distribution of the relevance judgements for their members. More specifically, we drop clusters
that contain results having judgement value difference more than one. For example, if a cluster contains results labelled as 0 and results labelled as 2, it will be dropped. After the refining step, we label each remaining cluster by the label assigned to the majority of the results in the same cluster. Formally: 1. Let cluster c = {r1 , r2 , . . . rn } of the search results 2. Let njc0 , njc1 , njc2 be the number of search results in c labelled with 0 (i.e., irrelevant), 1 (i.e., partially relevant), and 2 (i.e., strongly relevant) respectively, having njc0 + njc1 + njc2 ≤ n. 3. If njc0 = 0, then label c by argmax(njc1 , njc2 ). 4. Else, if njc2 = 0, then label c by argmax(njc0 , njc1 ). 5. Else, drop c. Then, for each cluster labelled by relevance judgement j, we assign to all non-labelled results of the cluster the judgement j. Returning to our example in Figure 2 we assume that the user has viewed or clicked only the top-10 results. Based on the aforementioned algorithm, cluster A is dropped since 0 2 1 njA = 1 and njA = 1. Cluster B is labelled as 1 since njB = 2 2 and njB = 1. All the non-judged results r22 , r24 and r27 of this cluster are subsequently assigned the relevance jugdement 1.
5.
EVALUATION
Our work aims at proposing a method that expands an initial (small) set of relevance judgements in order to produce more training data from the same implicit feedback available. In Subsection 5.1 we briefly present LETOR [9], a benchmark dataset for research on learning methods for ranking search results, and we describe how we used it in our experiments. Then, to evaluate our method, we first show that the expansion gives relevance judgements of good quality (Subsection 5.2). Finally, we examine if the produced relevance judgements train a ranking function properly. That is, we train an (SVM) ranking function with the expanded set of relevance judgements for each query and we compare its ranking precision with the precision produced by a ranking function trained with all initial explicit judgements available for each query (Subsection 5.3). In order to evaluate our method, we need to simulate a typical user feedback collection as the one that follows: • Users pose queries. Results are retrieved and ranked by the BM25 feature [13]. • Only the top-10 results are presented to users to view/ click. For these results, we extract implicit relevance judgements using the methods presented in Section 3. Given the premises described above, we can simulate a typical user behaviour and test our method. The learning and ranking algorithm which we use is Ranking SVM [7], which is also used in LETOR [9].
Result List and relevance judgements r1: r2: r3: r4: r5: r6: r7: r8: r9: r10:
0 2 1 0 2 2 0 1 0 1
Results not clicked/ viewed (no relevance rudgements)
Cluster A
Expanded set of relevance judgements r1:0 r17 r5:2
r23
New relevance judgements
r33
Clustering
Cluster B Label: 1
r11 r12
r3:1 r18:2 r8:1
r22
r24
r27
r1: 0 r2: 2 r3: 1 r4: 0 r5: 2 r6: 2 r7: 0 r8: 1 r9: 0 r10: 1 ----------------r22: 1 r24: 1 r27: 1
. . . rn
Figure 2: An example of relevance relation expansion using clustering.
5.1
The LETOR collection
For our experimental evaluation, we used LETOR [9], a benchmark dataset for research on learning methods for ranking search results. LETOR’s data includes the OHSUMED collection of TREC 2000 and the “.gov” collection of TREC 2003. The extracted features include term frequency, BM25 values [13], LMIR [15] etc. Relevance judgements of the results for given queries are also provided. Our experiments were based on the OHSUMED collection which is a subset of MEDLINE (a database on medical publications) that contains 348, 566 records from 270 medical journals from 1987 to 1991. Each record has the following format: .I .U .M .T .P .W .A .S . There are 106 queries with their results. For every queryresult pair, there is an explicit relevance judgement: 0 (irrelevant), 1 (partially relevant) and 2 (strongly relevant). Totally, there are 16, 140 relevance judgements for all 106 queries Data is partitioned in five subsets, denoted as S1, S2, S3, S4 and S5. Then, combining each time different subsets to make (a) the training, (b) the validation and (c) the test set, the authors create 5 different arrangements for five-fold cross validation, as presented in Table 1. In every fold, the validation set was used to tune the parameters of the ranking model. The authors subsequently compare two ranking functions, namely Ranking SVM [7] and RankBoost [6]. However, we do not aim at comparing different ranking models, but at examining how our method improves the efficiency of the same model, by expanding the initially available training set. So, we only used the Ranking SVM model, without focusing on the tuning process. Thus, we merged each validation set into the corresponding training set to perform a five-fold cross validation, as shown in Table 2.
5.2
Clustering precision
The aim of the first experiment is to examine the preci-
Folds Fold1 Fold2 Fold3 Fold4 Fold5
Training set {S1, S2, S3} {S2, S3, S4} {S3, S4, S5} {S4, S5, S1} {S5, S1, S2}
Validation set S4 S5 S1 S2 S3
Test set S5 S1 S2 S3 S4
Table 1: LETOR data partition Folds Fold1 Fold2 Fold3 Fold4 Fold5
Training set {S1, S2, S3, S4} {S2, S3, S4, S5} {S3, S4, S5, S1} {S4, S5, S1, S2} {S5, S1, S2, S3}
Test set S5 S1 S2 S3 S4
Table 2: Our data partition
sion of the relevance relation expansion we conduct through clustering. Tables 3 and 4 present the results for different number of clusters created. In Table 3, Column numOfClusters shows the number of clusters used in our clustering solution. Column Correct shows the number of the predicted relevance judgements that where correct. Column Part. Correct shows the number of the judgements that were almost correct. This refers to cases where the label was predicted as 0 instead of 1, 1 instead of 0, 2 instead of 1 and 1 instead of 2. Column Wrong shows the number of the predicted judgements that where wrong (i.e., 2 instead of 0 and 0 instead of 2). Column Unpredicted shows the number of the elements for which we did not predict judgements (belonging to clusters that were dropped or clusters that did not contain initially judged results at all). Finally, column Total shows the total number of unjudged query-result pairs for which we expected to get relevance judgements. Note that, as the number of clusters increases, the number of predictions falls. This behaviour is expected, since, when
numOfClusters 5 10 15 20 25 30
Correct 5322 4628 3968 3533 3120 2818
Part. Correct 2076 1690 1397 1147 975 858
Wrong 1294 1166 1001 845 676 568
Unpredicted 7448 8656 9774 10615 11369 11896
Total 15080 15080 15080 15080 15080 15080
Table 3: Quality of expansion results (I) Correct 55.8% 55.5% 54.8% 55.4% 55.5% 55.2%
Part. Correct 27.2% 26.3% 26.3% 25.7% 26.3% 27%
Wrong 17% 18.2% 18.9% 18.9% 18.2% 17.8%
Table 4: Percentages on total of expanded results
we have only a few clusters, each of them contains many documents. So, if a cluster contains a judged result, a lot of results from this cluster are expected to get the same judgement. On the other hand, if we have many clusters, each cluster is expected to contain only a few documents. In this case, there are many clusters that do not contain judged results at all, and, as a result, they don’t contribute to the expansion. In Table 4 we can se the percentage of Correct, Partially Correct and Wrong judgement predictions on the total number of predictions. Although the results are almost similar for all clustering solutions, the 5-clusters solution is slighlty better than the rest. Furthermore, if we take into account that this solution produces more judgements than the rest, we conclude that this is the preferable one. As we can see, the results of the expansion, as far as the prediction of relevance judgements is concerned, are quite satisfactory. For the best clustering solution, Correct prediction reaches the value of 55.8%, whereas (Correct + Partially Correct) prediction reaches the value of 83%. A visualization of the quality of the expansion for each clustering solution is presented in Figure 3 where the graphs correspond to the ratios of (partially correct)/correct, wrong/ correct and ((partially correct) + wrong)/correct judgement predictions.
% ratio
numOfClusters 5 10 15 20 25 30
semi/correct wrong/correct (semi+wrong)/correct
1 0,95 0,9 0,85 0,8 0,75 0,7 0,65 0,6 0,55 0,5 0,45 0,4 0,35 0,3 0,25 0,2 0,15 0,1 0,05 0 5
10
15
SVM training/ranking precision
In this subsection we evaluate our method in terms of the quality of the ranking function trained. We use SVMlight , and run our experiments on the training and test sets shown in Table 2. We use the following evaluation metrics: Precision at position n (P@n), Mean average precision (MAP) and Normalized discount cumulative gain (NDCG). Formally, P@n is defined as follows: #relevant results in top n results n where we count as relevant results only the ones with judgement 2 (i.e., relevant). P @n =
25
30
Figure 3: Quality of expansion results MAP’s definition is: M AP =
Pn
i=1 P @n ∗ rel(n) #total relevant results f or the query
where N is the total number of retrieved results and rel(n) is defined as follows: ( rel(n) =
1 0
if the nth result is relevant otherwise
NDCG is defined as follows:
N DCG(n) = Zn
n X j=1
5.3
20
# of clusters
(
2r(j) − 1
j=1
2r(j) −1 log j
j>1
where r(j) is the position of the j th result in the ranking list and Zn is a normalization constant that ensures that for the perfect ranking, N DCG = 1. The results of the experiments are presented in Figures 4 and 5 and in Table 5. Figure 4 shows the precision at various rank positions (1 − 20). The graph corresponding to the total of relevance judgement gives the precision on the test set achieved with training based on the total number of relevance judgements available in the training set. This means that these values of P@n correspond to the “ideal” training of the ranking function, where relevance judgements for all search results should be available. The remaining graphs present the precision achieved by expanding an initial set of relevance judgements (the 10 with the higher BM25
total of relevance judgements expansion with 5 cluster solution expansion with 10 cluster solution expansion with 15 cluster solution expansion with 20 cluster solution expansion with 25 cluster solution expansion with 30 cluster solution
0,700
0,600
0,500
P@n
0,400
0,300
0,200
0,100
0,000 1
2
3
4
5
6
7
8
9 10 11 12 13 14 15 16 17 18 19 20 position
Figure 4: Comparison of P@n for the ideal system and our approach. value for each query) based on our method, for the clustering solutions presented previously. Even though we expected that the precision values of total of relevance judgement graph would be higher from our approach, we wanted to test to what extent the precision values of our approach approximate the ideal ones. This is demonstrated in Figure 4. The graph shows that the best performing clustering solution, is the one with the fewest clusters (5), as expected from the experiment of Section 5.2. We can also observe that this solution approximates sufficiently the ideal system, especially while the number of position grows. The advantage of our method is that such an approximation has been achieved utilizing only 10 relevance judgements per query, while the ideal system in our case utilizes on average 160 relevance judgements per query. That is, using only a small proportion of relevance judgements on results of each query, we achieve precision that is close to the precision that we would achieve if we had available (as training input) relevance judgements for all results of each query. More informative about the efficiency of our method are the MAP values presented in Table 5. Again, as expected, the 5 clustering solution outperformes the rest, while it achieves a MAP value equal to 91% of the ideal system MAP value. MAP
trj 0.399
5 cl 0.364
10 cl 0.325
15 cl 0.286
20 cl 0.320
25 cl 0.312
Table 5: MAP comparison Finally, we compare the NDCG values of our method. The behaviour of our approach is similar to the one described for the P @n graph. The best solution is the 5-cluster solution, which approximates sufficiently the ideal sytem (column trj ).
6.
CONCLUSION
In this paper, we presented a methodology for increasing the training input of ranking function learning sytems, without requiring more explicit or implicit feedback from
the users, other than what they provide during their search. Our approach uses clustering to group search results of similar content. Those clusters are used in order to expand the initial set of relevance relations to as many search results as possible. Using this expansion of relevance relations, we increase the training input of a learning system. In this way, the necessary training data is gathered in a shorter period of time, allowing the system to train a ranking function sooner. Moreover, by increasing the training input produced by single users, we allow the system to be trained for a group of less users, increasing the homogeneity of the ranking function produced. The experiments show that, for specific clustering solutions, our appoach approximates efficiently the behaviour of a system “ideally” trained, that is, trained with relevance relations available for all results of each query used in the training phase. This is a first-cut approach to this problem. Evidently, there is room for improvements and expansions on the proposed method. First of all, we plan to use a more sophisticated expansion algorithm. For instance, the decision on whether a cluster is valid (for relevance relation extraction) or not, can be based on the comparison of the percentages of initially judged results with certain thresholds. Moreover, based on the composition of each cluster, expressed in terms of the different results’ labels it contains, we plan to define a metric which better describes the quality of the cluster. This metric can be used to estimate the quality of the expanded relations. We finally plan to perform a continuous and recursive training and correction of the clustering and expansion procedures using the system’s history in order to acquire training data of better quality.
7.
REFERENCES
[1] E. Agichtein, E. Brill, and S. Dumais. Improving web search ranking by incorporating user behavior information. In Proceedings of the 29th annual international ACM SIGIR conference on Research and development in information retrieval, pages 19–26, 2006.
0,800
total of relevance judgements expansion with 5 clusters solution expansion with 10 clusters solution expansion with 15 clusters solution expansion with 20 clusters solution expansion with 25 clusters solution expansion with 30 clusters solution
0,700 0,600
P@n
0,500 0,400 0,300 0,200 0,100 0,000 1
2
3
4
5
6
7
8
9 10 11 12 13 14 15 16 17 18 19 20 position
Figure 5: Comparison of NDCG for the ideal system and our approach. [2] S. Brin and L. Page. The anatomy of a large-scale hypertextual web search engine. Computer Networks and ISDN Systems, 30:107–117, 1998. [3] C. Burges, T. Shaked, E. Renshaw, A. Lazier, M. Deeds, N. Hamilton, and G. Hullender. Learning to rank using gradient descent. In Proceedings of the 22nd international conference on Machine learning, pages 89–96, 2005. [4] Y. Cao, J. Xu, T.-Y. Liu, H. Li, Y. Huang, and H.-W. Hon. Adapting ranking svm to document retrieval. In Proceedings of the 29th annual international ACM SIGIR conference on Research and development in information retrieval, pages 186–193, 2006. [5] J. Diez, J. J. del Coz, O. Luaces, and A. Bahamonde. Clustering people according to their preference criteria. Expert Systems with Applications: An International Journal, 34:1274–1284, 2008. [6] Y. Freund, R. Iyer, R. E. Schapire, and Y. Singer. An efficient boosting algorithm for combining preferences. The Journal of Machine Learning Research, 4:933–969, 2003. [7] T. Joachims. Optimizing search engines using clickthrough data. In Proceedings of the eighth ACM SIGKDD international conference on Knowledge discovery and data mining, pages 133–142, 2002. [8] X. Li, N. Wang, and S.-Y. Li. A fast training algorithm for svm via clustering technique and gabriel graph. In Proceedings of the International Conference on Intelligent Computing, 2007. [9] T.-Y. Liu, J. Xu, T. Qin, W. Xiong, and H. Li. Letor: Benchmark dataset for research on learning to rank for information retrieval. In SIGIR 2007 Workshop on Learning to Rank for Information Retrieval, 2007. [10] S. Pandey, S. Roy, C. O. J. Cho, and S. Chakrabarti. Shuffling a stacked deck: the case for partially randomized ranking of search engine results. In Proceedings of the 31st international conference on Very large data bases, pages 781–792, 2005.
[11] F. Radlinski and T. Joachims. Query chains: Learning to rank from implicit feedback. In Proceedings of the eleventh ACM SIGKDD international conference on Knowledge discovery in data mining, pages 239–248, 2005. [12] F. Radlinski and T. Joachims. Active exploration for learning rankings from clickthrough data. In Proceedings of the 13th ACM SIGKDD international conference on Knowledge discovery and data mining, pages 570–579, 2007. [13] S. E. Robertson. Overview of the okapi projects. Journal of Documentation, 53(1):3–7, 1997. [14] G.-R. Xue, H.-J. Zeng, Z. Chen, Y. Yu, W.-Y. Ma, W. Xi, and W. Fan. Optimizing web search using web click-through data. In Proceedings of the thirteenth ACM international conference on Information and knowledge management, pages 118–126, 2004. [15] C. Zhai and J. Lafferty. A study of smoothing methods for language models applied to ad hoc information retrieval. In Proceedings of the 24th annual international ACM SIGIR conference on Research and development in information retrieval, pages 334–342, 2001. [16] Y. Zhao and G. Karypis. Empirical and theoretical comparisons of selected criterion functions for document clustering. Machine Learning, 55(3):311–331, 2004. [17] Y. Zhao, G. Karypis, and U. Fayyad. Hierarchical clustering algorithms for document datasets. Data Mining and Knowledge Discovery, 10(2):141–168, 2005.