Brain Registration and Subtraction - Improved Localization for SPECT Analysis (B.R.A.S.I.L.): A computer-aided diagnosis in epilepsy tool kit. ∗
Lucas F. de Oliveira
Paulo M. de Azevedo-Marques
Informatic Department Federal University of Pelotas Pelotas, RS, Brazil
Center for Imaging Science and Medical Physics University of Sao ˜ Paulo Ribeirao ˜ Preto, SP, Brazil
[email protected]
[email protected] Lauro Wichert-Ana
Americo ´ Ceiki Sakamoto
Epilepsy Surgery Center, Department of Neurology, Psychiatry and Clinical Psychology University of Sao ˜ Paulo Ribeirao ˜ Preto, SP, Brazil
Epilepsy Surgery Center, Department of Neurology, Psychiatry and Clinical Psychology University of Sao ˜ Paulo Ribeirao ˜ Preto, SP, Brazil
[email protected]
[email protected]
ABSTRACT Surgery is an important option in the treatment of patients with medically intractable epilepsy. Traditional techniques for the localization of the epileptogenic zone (EZ), e.g. surface electroencephalography (EEG) and magnetic resonance (MR) imaging, allow accurate localization in a significant number of epileptic patients. Besides, in many situations, the single photon emission computed tomography (SPECT) images have played a very important role in EZ localization. However, the identification of the EZ based on the visual interpretation side-by-side of the ictal and periictal images is in general a difficult task. To improve SPECT analysis, computational techniques have been developed focusing on the registration and fusion of ictal and periictal SPECT images. The combination of image registration and subtraction of SPECT images can improve the selective detection of brain regions with functional activation during epileptic seizures. The proposed methodology shown high sensitivity to detect hyperperfusion higher than 10%, in this article we apresents the techniques implemented, the methodology ∗The author for corespondence: Campus Universit´ ario, s/n, Caixa Postal: 354, Departamento de Inform´ atica - IFM, CEP: 96010-900, Pelotas, RS, Brasil.
Permission to make digital or hard copies of all or part of this work for personal or classroom use is granted without fee provided that copies are not made or distributed for profit or commercial advantage and that copies bear this notice and the full citation on the first page. To copy otherwise, to republish, to post on servers or to redistribute to lists, requires prior specific permission and/or a fee. SAC’08 March 16-20, 2008, Fortaleza, Cear´a, Brazil Copyright 2008 ACM 978-1-59593-753-7/08/0003 ...$5.00.
used to test and some initial results obtained with our own developed software B.R.A.S.I.L. (”Brain Registration And Subtraction: Improved Localization for SPECT Analysis”).
Categories and Subject Descriptors J.3 [Life and Medical Sciences]: Life and Medical Sciecens—health, medical information systems.
General Terms Measurement, Human Factors
Keywords Image Registration, Epilepsy, SPECT Image, Computer Aided Diagnosis (CAD).
1. INTRODUCTION It is estimated that approximately 50 million people in the world have epilepsy and that only 25 to 45% of them are seizure free after 12 months with Antiepileptic drugs (AED) treatment. Epilepsy surgery is recommended for patients who do not benefit from AEDs treatment and, in that sense, intractability is an essential requirement to indicate the procedure [15]. The presurgical workup commonly includes Magnetic Resonance Imaging (MRI), longterm Video-Electroencephalographic monitoring (VEEG), neuropsychological evaluation and functional neuroimaging with Single Photon Emission Tomography (SPECT). Periictal SPECT is widely available and highly sensitive to determine EZ location [15]. In those patients presenting extratemporal epilepsy, non-localizing and non-lateralizing ictal and periictal EEG, normal MRI findings or multiple cerebral lesions, the ictal SPECT assumes an exploratory rather
1390
than purely complementary role [1, 15]. Nonetheless, it may be difficult to detect the EZ through a simple visual side by side interpretation of SPECT images[11]. In this setting, the image registration of various exams types has proved to be an essential tool in the processing of three-dimensional (3D) medical images. The medical diagnoses may benefit from the complementary information obtained from the fusion of two or more nuclear medicine or radiology images, of equal or different modalities [9, 13]. Image registration is much used to improve the sensitivity and specificity of complementary procedures, with the aim of detecting, locating, monitoring, and measuring pathological and physical disorders. Often, registration contributes by bringing new or extra information, leading to the developement of a great number of registration algorithms where the corresponding pixel coordinates on different images are transformed in order to align and match its position and spatial coordinates. The ictal and periictal SPECT images aligned and subtracted is the most used technique to determine EZ location [10]. This article describe the own solution to the EZ localization problem and shown the preliminars tests done. This paper is organized as follows. Section 2 explain the our B.R.A.S.I.L. technique in details, the section 3 show the Evaluation and Results and the section 4 discussion and conclusions.
2.
B.R.A.S.I.L. METHODOLOGY
The proposed methodoly is formed for four esteps. The first step is the images registration, the second is the SPECT images normalization, the third stiep is the ictal and periictal subtraction and most significant voxels selection is the four step. These steps together form the pipeline execution of B.R.A.S.I.L. technique. Each one of steps are explains in details in this section.
2.1 Registration Techniques There are many robusts and accurates image registration techniques, some based on the similarity of voxels, with use only the intensity of the images without any need for segmentation or markers of the corresponding structures. These similarity of voxels methods use all or a large part of data from each image and then attempt to eliminate the errors caused by noise or random fluctuations in image intensity through a mean or smoothing [6]. The Cross Correlation (C) technique supposes a linear relationship between the intensity values in the images. Hence, the relationship is calculated directly and linearly between the images. Mutual Information derives from the information theory of statistical dependence between two random variables, i.e., it is a measure of the amount of information that one variable reveals about another one [4, 9, 14, 16]. It is obtained by the difference between the sum of the entropy of overlapped individual images and the joint entropy of the combined images. Mutual Information measures how well an image “explains” the other, with no suppositions about the functional form or relation between the intensity of the two images. This method is often used, particularly for intermodality registration, bearing in mind that the measure is maximized when there is an optimal alignment [6, 7]. The registration method used in B.R.A.S.I.L. is based on voxel similarity and use the Mutual Information [3, 12] as similarity measure for SPECT and MRI images and Cross Correlation for the alignment of ictal and periictal SPECT images. The registration algorithm is implemented in C++ based on the
Collignon methodology to Mutual Information [3].
2.2 SPECT Image Segmentation and Normalization In our methodology is applied an image segmentation to better distinct the activity of cerebral from extracerebral structures. This was performed by using the ICBM451 brain model [2]. The ”International Consortium Brain Mapping” (ICBM) adopted this model as an international standard. It consists of the mean of 452 MRI adult brain sets and is available with rigid and non-rigid changes, based on 5th order polynomial functions, which allows a more accurate alignment and shows the anatomy in greater detail 1 . So, the normalization of segmented SPECT images is performed to make the voxel-to-voxel comparison possible. The method used is based on the ”Subtraction Ictal SPECT co-registered to MRI” (SISCOM) [11, 10] and follows the formula: In = Io ∗ 100/(voxels intensity average)
(1)
where In is the intensity of the normalized voxel, Io is the original voxel intensity and voxels intensity average is the average value of all image. In this step the images becomes in the same range of voxels intensity and the threshold (20% or more of greater value) is applied to eliminate the background noise.
2.3 Subtraction It is the most common and efficient method to improve image analysis sensitivity, since the resulting image is simply a map of the coefficients of positive or negative differences, which expresses in semi-quantitative numbers how much one image is different from the other for all voxels. The calculation is performed by subtracting the voxel value of ictal image from the voxel value of periictal image, both normalized. The resulting image is a map of point-by-point differences between the SPECT images. Then, positive values are separated from the negative ones, forming two images, with the aim of obtaining only the calculation of the hyperor hypoperfusion, increase and decrease of blood perfusion of the SPECT images, respectively. Hyper and hypoperfusion images are used in the stage of classification of the significant difference between the images.
2.4 Selecting The Most Significant Voxels In this step the hyper- and hipoperfusion images, generated in the Subtraction step, are used to calcutating means and standard deviation of the sample. Before done the calculations is applied a Gaussian Smooth filter to reduce the noise and approximate the images to a Gaussian distribution [5]. To perform the statistics calculations the voxels with values zero equal are ignored and the others voxels values are considered. The mean and standard deviation are calculated two times, one to Hyperperfusion and another to Hypoperfusion images. After this calculation, values that are 2 standard deviations (SD) under the average are zeroed on the subtraction hyper perfusion image, in this paper only hyperperfusion image is considered. With this statistical analysis, only the highly significant values (95%) remain in the image and, thus, represent the important differences between the two images. This procedure also minimizes the influence of random noise on the ictal image [11]. This 1
1391
http://www.loni.ucla.edu/ICBM/
methodology reduce the number of voxels values presents on image, but the presents values are highly significants and shown the probabilly EZ areas.
3.
EVALUATION AND RESULTS
This section describe the evaluation methodology and shown the preliminars results.
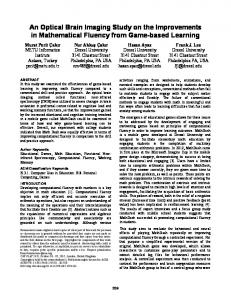
3.1 Digital Phantom Creation To tests our methodology we developed a digital SPECT phantom using a brain SPECT scan of a volunteer. SPECT acquisition started 30 minutes after the injection of 35m Ci (1295 MBq) of 99mTc-ECD, using a double head SOPHY DST gamma camera (Sophy Medical Vision, Twinsburg, USA) equipped with low-energy and high-resolution collimators, acquiring 128 projections in 360o on a 128x128 matrix, 30 seconds or 75.000 counts per projection and a total acquisition time of 30 minutes. Scans were reconstructed by “backprojection” in a SOPHY NXT workstation in transaxial slices parallel to a line drawn from the basis of the frontal lobe to the occipital lobe, and parallel to the long axis of the temporal lobe, from which coronal sections were produced. Slices were post-filtered with a Butterworth filter (order 9, cut-off frequency of 0.16 cy/mm), and attenuation correction was performed using the 1st order Chang algorithm (coefficient 0.12/cm) considering a pixel size of 3.55mm. The volunteer SPECT images was aligned to the ICBM452 model served as the basis for the construction of a digital phantom. In addition to the rigid registration (translation, rotation and scale), a non-rigid registration based on B-splines was needed for a better adjustment to the model. The Figure 1 a) show the initial SPECT image position, in b) the Mutual Information image registration (repair in narrows showing the misregistration areas) and in c) the correct registration using B-Splines technique. After the registration step, SPECT image was segmented. A simple binary multiplication technique was used for the segmentation. The ICBM model was binarized, the voxels values minors than 2 in ICBM model was zeroed and the others values were become to 1. The binary image was multiplyed to SPECT image to eliminate background noise, remove extracerebral structures and Star artifact. The result was a segmentation of the brain SPECT and only the brain structure remained in the image, being used to create the model that was applied to test B.R.A.S.I.L. performance.
3.1.1 The Changes to Simulate Hiperperfusion The methodology for images changes followed three stages: (A) In the first stage, four spheres were created and inserted in the images, simulating lesions of different sizes: radius of 2.5mm (Sphere 1), 5.5 mm (Sphere 2), 7.5 mm (Sphere 3), and 10.5 mm (Sphere 4) (See Figure 2 a)). A total of 7284 voxels underwent changes in the four spheres. Four spheres positions combinations were further created with 5, 10, 15, 20 and 25% of brightness change and applied to spheres, while the rest of the image remained unchanged. By this way, twenty final images were generated to test the developed methodology. The radius, positions and number of voxels of the spheres are described in Table 1. In all images spheres were completely inside the brain phantom. Figure 2 a) show the created 1st stage image with the four numbered spheres and brightness change -20%. (B) In the second stage we applied changes on brightness and contrast on
Figure 1: The image registration results. In a) the images not aligned, in b) only rigid aligment done and in c) the non-rigid aligment with B-Splines
the whole 1st stage image in order to test the normalization methods and two changes were done. Initially, change in brightness was applied for voxels with a reduction of -20 (minus twenty) units. Further, all voxels were multiplied by a fixed value of brightness (1.15). This value was obtained through tests aiming to avoid image saturation. The resulting second stage image presented change in brightness not only upon cerebral parenchyma but also over created spheres. (C) In the third stage, the second stage image underwent the insertion of a uniform noise. A noise image was created with noiseranging between 0.6 and 1.45 values. The noise image was thresholded to limited the noise to 5% to avoid degrade the image. After applying this threshold, this noisy image was multiplied by the image created in second stage resulting in the third stage image, considerably modified in brightness, contrast and noise (Fig. 2 b)). This stage didn’t was made to simulate the real image, but to test the methodology robustness.
3.2 Results The B.R.A.S.I.L. evaluation was performed calculating the sensitivity measure. Two kinds of images were used in the performance evaluation step: the original segmented image and the images changed describes in the previous section. The original image, without any changes or spheres but aligned and segmented, was considered the Ictal image and was applied the B.R.A.S.I.L. methodology between original and the twenty images created to validate the technique. The sensitivity was considered through the following formula:
1392
Table 2: Percent of Sensitivity Hiperperfusion Mean TPs Mean FPs Sensitivity 5% 6443.25 840.75 88.46% 10% 6724.00 560.00 92.31% 15% 6776.25 507.75 93.03% 20% 6786.75 497.45 93.17% 25% 6777.00 507.00 93.04%
Table 1: Spheres characteristics Sphere Name
Radius (mm)
Sphere 1
2.5
Sphere 2
5.5
Sphere 3
7.5
Sphere 4
10.5
Positions (57, 25, 64) (91, 154, 64) (57, 154, 64) (81 ,29, 64) (81, 29, 64) (57, 34,74) (91, 154, 64) (57, 154, 64) (57, 44, 64) (81, 34, 74) (57, 154, 64) (91, 154, 64) (81, 49, 64) (91, 154, 64) (57, 154, 64) (57, 35, 64)
Voxels 56
680
1740
4808
Figure 2: The four spheres positioned in SPECT image segmented: in a) 20% of changes in spheres (First Stage), and b) the final image with changes and noise applied in a) (Third Stage).
Sensitivity =
TPs (T P s + F N s)
(2)
where TPs (True Positives) are the number of voxels detected as altered (that means, belonging to a sphere) in the subtracted image and were indeed changed. FNs (Falses Negatives) are the number of voxels detected as non-altered (that means, not belonging to a sphere) in the subtracted image, but were in really altered. This measure consider only the selectioned most significant voxels by the B.R.A.S.I.L. methodology. There was calculated the average of sensitivity to each percent change. Our results show that, with the variation of 5%, the method was able to detect in mean 6443.95 of the altered spheres voxels (88.46% sensitivity). With a 20% change, better results were obtained with a mean of 6786.75 true voxels and 93.17% of sensitivity. The other results were in the same range, with 92.31% for the second worst sensitivity, registered with 10% of change on the spheres. The mean sensitivity was 92% and shown the robustness of the proposed system. The table 2 shown the average sensitivity of all spheres together.
4.
have been widely used over the past decades as a support for locating the epileptogenic zone. There are many studies in the literature comparing ictal and interictal SPECT images. However, visual assessment alone is highly subjective, since there is no normalization between the ictal and interictal images. To improve this process, many studies have been developed in the subtraction of ictal-interictal SPECT images [8, 11, 10, 17], and each study demonstrates a specific technique for MRI and SPECT images alignment using different methods for image subtraction. In this study, we simulated blood flow changes and inserted random noise to analyze different images to evaluate our own computational package developed (B.R.A.S.I.L.)to locate the epileptogenic zones. We inserted spheres of different sizes and changed voxel values in the order of 5 to 25%, in a 5% scale, and obtained twenty images for analysis and four altered spheres in each image. For the lesions with a perfusion changes above 5% and a size equal to or above 56 voxels (ie, radius equal 2.5mm), the method showed average sensitivity rate above 88.46%, showing a great potential as a support for locating epileptogenic zones. These values can be compared to previously proposed methods, such as the SISCOM [11, 10]. Nonetheless, the method was more sensitive to the simulated larger changes in size and perfusion. Although our sensitivity results applying digital phantom images have been very promising, a very sound validations would be necessary to assure the medical utility of this methodology. In this setting, a retrospective study using a set of operated patients was started and initial results have shown a very good agreement between postsurgical outcome and the location of the EZ detected by the software. We believe that this retrospective study will corroborate the usefulness of B.R.A.S.I.L as a computer-aided diagnostic technique to evaluate patients with medically intractable Epilepsy.
5. ACKNOWLEDGMENTS This work was supported by grant from ”The State of S˜ ao Paulo Foundation” (FAPESP/CINAPCE). Prof. Paulo Mazzoncini de Azevedo-Marques was supported by the National Council for Scientific and Technological Development (CNPq - Grant No. 304082/2002-3). The authors are grateful to CAPES for the scholarship support.
6. REFERENCES
DISCUSSION AND CONCLUSION Changes in the cerebral blood flow measured by SPECT
1393
[1] R. Avery, I. Zubal, R. Stokking, and et al. Decreased cerebral blood flow during seizures with ictal SPECT injections. Epilepsy Research, 1(40):53–61, 2000. [2] M. Brett, I. Johnsrude, and A. Owen. The problem of functional localization in the human brain - Opinion. Nature Reviews - Neuroscience, 3:243249, Mar. 2002. [3] A. Collignon, F. Maes, D. Delaere, D. Vandermeulen, P. Suetens, and G. Marchal. Automated
[4]
[5]
[6]
[7]
[8]
[9]
[10]
multimodality image registration using information theory. In Y. Bizais, C. Barillot, and R. Di Paola, editors, 14th. Int. Conf. Information Processing in Medical Imaging, Computational Imaging and Vision 3, pages 263–274, Boston: Kluwer, June 1995. J. Fitzpatrick, D. Hill, and C. Maurer. Handbook of Medical Imaging, volume 2, chapter Image Registration, pages 375–435. SPIE Press, Bellingham, 2000. R. Gonzalez and R. Woods. Digital Image Processing. Addison-Wesley Publishing Company, United States of America, 1993. J. Hajnal, D. Hill, D. Hawkes, and et. al. Medical Image Registration. The BIOMEDICAL ENGINEERING Series. CRC Press, 2001. D. Hill and D. Hawkes. Handbook of Medical Imaging: Processing and Analysis, chapter Across-modality registration using intensity-based cost functions, pages 537–553. New York: Academic, 2000. R. Hogan, M. Cook, C. Kilpatrick, D. Binns, P. Desmond, and K. Morris. Accuracy of co-registration of single-photon emission CT with MR via a brain surface matching technique. AJNR Am J Neuroraodiol, 17:793–797, 1996. F. Maes, A. Collignon, Vandermeulen D., and et al. Multimodality Image Registration by Maximization of Mutual Information. IEEE Transactions on Medical Imaging, 16(2):187–198, Apr. 1997. T. O’Brien, M. O’Connor, B. Mullan, B. Brinkmann, D. Hanson, C. Jack, and E. So. Subtraction ictal SPET co-registered to MRI in partial epilepsy: description and technical validation of the method with phantom and patient studies. Nucl Med Commun, 19(1):31–45, 1998.
[11] T. O’Brien, E. So, B. Mullan, M. Hause, B. Brinkmann, N. Bohnen, D. Hanson, G. Cascino, C. J. Jack, and F. Sharbrough. Subtraction ictal spect co-registered to mri improves clinical usefulness of spect in localizing the surgical seizure focus. Neurology, 50(2):445–454, feb 1998. [12] P. Viola and W. Wells III. Alignment by maximization of mutual information. Proc. 5th. Int. Conf. Computer Vision, pages 16–23, June 1995. [13] D. Weber and M. Ivanovic. Correlative Image Registration. Seminars in Nuclear Medicine, XXIV(4):311–323, 1994. October. [14] W. Wells, P. Viola, H. Atsumi, S. Nakajima, and R. Kikinis. Multi-modal volume registration by maximization of mutual information. Med. Imag. Anal., 1(1):35–51, 1996. [15] L. Wichert-Ana, T. Velasco, V. Terra-Bustamarte, D. Ara´ ujo, V. Alexander Jr., M. Kato, J. Leite, J. Assirati, H. Machado, A. Bastos, and A. Sakamoto. Typical and Atypical Perfusion Patterns in Periictal SPECT of Patients with Unilateral Temporal Lobe Epilepsy. Epilepsia, 42(5), 2001. [16] R. Woods. Handbook of Medical Imaging: Processing and Analysis, chapter Within-modality registration using intensity-based cost functions, pages 529–536. New York: Academic, 2000. [17] I. Zubal, S. Spencer, K. Imam, J. Seibyl, E. Smith, G. Wisniewski, and et al. Difference images calculated from ictal and interictal technetium-99m-HMPAO SPECT scans of epilepsy. J Nucl Med, (36):684–9, 1995.
1394