Jan 23, 1996 - ... protein digestibility of rations fed to pigs and determined with the use of chromic oxide ... Crossbred barrows ((Dutch Landrace x Yorkshire) x.
British Journal of Nutrition (1996), 76,551-562
551
Apparent ileal dry matter and crude protein digestibility of rations fed to pigs and determined with the use of chromic oxide (Cr20,) and acid-insoluble ash as digestive markers BY P.VAN LEEUWEN', A.VELDMAN2, S. BOISEN', K. DEURING', G. J. M.VAN KEMPEN', G. B. DERKSEW, M. W. A. VERSTEGEN6 A N D G. SCHAAFSMAl TNO Nutrition and Food Research, Departmenl of Animal Nutrition and Meat Technology (ILOB-NCV), PO Box 15, 6700 A A Wageningen, The Netherlands CLO-Institute for Animal Nutrition 'De Schothorst ', Lelystad, The Netherlands National Institute of Animal Science, Foulum Research Centre, Denmark TNO Institute of Applied Physics (TPD), Department of Applied Statistics, Delft, The Netherlands Department of Animal Nutrition. Agricultural University Wageningen, Wageningen, The Netherlands (Received 7 February I995 - Revised 9 November I995 - Accepted 23 January 1996) Two experiments were conducted to determine apparent ileal DM and crude-protein (CP) digestibilities in rations fed to pigs. An evaluation was made of Cr,O, and HC1-insoluble ash as digestive markers. In addition, the effects of body weight (BW) on apparent ileal DM and C P (N x 625) digestibilities were studied. In Expt 1, thirteen barrows averaging 35 kg BW were fitted with post-valve T-caecum (PVTC) cannulas to determine the apparent ileal DM and C P digestibilities of a wheat glutepbran ration (B2) and a soyabean-meal ration (El). Immediately after morning feeding ileal digesta samples were collected on an hourly basis for a total of 12 h. Subsequently, N and marker contents were determined in the samples. The postprandial patterns of N and Cr passage were more similar than those of N and HClinsoluble ash. Therefore Cr,O, is more suitable as a marker than HC1-insoluble ash. The apparent ileal C P digestibility coefficient of ration B2 derived using Cr,O, as a marker was significantly (P< 0.05) higher by 0.018 compared with the value obtained using HCI-insoluble ash. The corresponding values for ration E2 obtained using Cr,O, and HC1-insoluble ash were both 0.825. In Expt 2, apparent ileal DM and C P digestibilities were determined in eighteen rations using twelve barrows also fitted with PVTC cannulas (BW from 40 to 100 kg). The protein sources for these rations were from different groups of feedstuffs. In four and three of the rations apparent ileal DM and C P digestibilities respectively were significantly different (P< 0.05) when assessed using the two markers. The digestibility coefficients were not systematically higher or lower for either marker. Absolute differences were < 0.049 on average. Significant effects of live weight on apparent ileal CP digestibilities were found.
Ileal digestibility: Digestive markers: Pigs
Several studies have reported comparisons of apparent faecal digestibilities, determined using the digestibility markers Cr,O, and HC1-insoluble ash (Moughan et al. 1991;Bakker & Jongbloed, 1994). However, problems determining digestibilities using Cr,O,, because of interference from other minerals in the rations, have been reported (Saha & Gilbreath, 1991). Moreover, mineral concentrations are much higher in undigested materials and, therefore, the authors proposed that analytical recovery factors should be considered. McCarthy et al. (1974) proposed HC1-insoluble ash as an alternative marker to Cr203. However, comprehensive information on the ileal digestibility of DM and crude protein (CP) for many feedstuffs has not been reported in the literature.
552
P. V A N LEEUWEN A N D OTHERS
The objectives of the present study were: (a) to determine postprandial changes in the contents of N, Cr and HCI-insoluble ash when feeding two rations different in crude fibre content (Expt 1) and (b) to determine ileal digestibilities of DM and CP in eighteen different protein-source rations using Cr,O, and HC1-insoluble ash as digestive markers (Expt 2). MATERIALS A N D METHODS
Experimental protocol Determination of ileal digestibility. Crossbred barrows ((Dutch Landrace x Yorkshire) x Finnish Landrace) were individually housed in smooth-walled metabolism cages (800 x 1800 mmj with a plastisol surface (Tenderfoot@,4530 Ibberburen, Am Ring 1, West Germany) without bedding. The animals could move freely in the cages. The cages were placed in an environmentally controlled barn with air temperature of 19-21". From 07.0&21.00 hours the experimental room was illuminated: during the night the lights were dimmed. Animals were surgically fitted with post-valve T-caecum (PVTC) cannulas according to van Leeuwen et al. (1991). The cannulas, of 25 mm internal diameter, were constructed from silicone rubber. Following the surgery the pigs were returned to the metabolism cages and allowed a recovery period of 10 d. Rations were fed at a level of 2.6 times the requirement of metabolizable energy for maintenance (420 kJ/kg body weight (BW)077. The pigs were given equal amounts of feed at 08.00 and 16.00 hours during the adaptation period and at 08.00 and 20.00 hours from 2 d before and during the collection periods. Water was mixed with the feed (2.5: 1) just before feeding. The following two experiments were approved by the TNO Committee for Animal Welfare. Expt 1. Thirteen animals, with a mean body weight of 35 kg, were divided into two groups (1 and 2). Seven animals of group 1 received ration B2 (see Table 2), with wheat gluten and wheat bran as a protein source. The six animals of group 2 received ration El, with soyabean meal as a protein source. After 10 d adaptation to the rations, digesta were collected on three successive days over a period from 08.00 to 20.00 hours for the determination of apparent ileal CP digestibility. Digesta samples were collected hourly and immediately frozen (-20"). After the experiment the digesta collected over the 3 d were thawed, pooled on the basis of animal, frozen again and freeze dried. On the fourth day digesta samples were collected hourly to study N and marker passage. Hourly samples were pooled per ration, immediately frozen (- 20") and freeze-dried. The study was conducted when pigs had a mean body weight of 35 kg. Expt 2. Twelve crossbred barrows were used to determine ileal digestibility of eighteen experimental rations (see Table 2) in a split-plot design (see Table 3). Digestibility determinations of these rations were conducted at three different body-weight ranges ; 40-52, 57-70, and 87-100 kg. Each body-weight domain consisted of three separate test periods of 1 week duration each. Between the body-weight domains the adaptation period was at least 11 d. Within the 3 weeks three rations with feedstuffs from the same product group were given to the individual animals (see Table 2). The adaptation period within the domain was 4.5 d (nine feeds). After adaptation, on three successive days digesta samples were collected over a period from 08.00 to 20.00 hours for the determination of apparent ileal CP digestibility. Digesta samples were collected hourly and immediately frozen (- 20"). After the experiment the digesta of the 3 d collections were thawed and pooled per animal. Rations. Feedstuffs (Table 1) were divided into six product groups: (1) cereals; wheat, barley, maize. (2) by-products of cereals; wheat gluten, wheat bran, maize-gluten feed.
553
DIGESTIBILITY OF RATIONS FOR PIGS
Table 1. Dry matter ( D M ) , crude protein ( C P ; N x 6 2 5 ) and crude$fibre (CF9 contents (glkg as f e d ) of feedstufs from six categories (A-F) Feedstuff
DM
CP
CFi
A1 A2 A3 B1 B2 B3 c1 c2
873 888 885 921 909 889 901 893
110
111 95 851 154 177 216 333
24 58 26 ND 112 74 63 84
890 921 917 905 902 913 912 924 912 924
287 296 339 240 519 317 295 687 889 522
74 149 61 54 44 116 242 ND ND ND
c3 D1 D2 D3 El E2 E3 F1 F2 F3
Wheat Barley Maize Wheat gluten Wheat bran Maize-gluten feed Peas Faba beans (Vicia faba) 0-T) Faba beans (HT) Lupins Toasted full-fat soyabeans Toasted Phaseolus beans Soyabean meal Rapeseed meal Sunflower-seed meal Fish meal Casein Meat-and-bone meal
ND, not determined; LT, low tannin; HT, high tannin. * Contents of antinutritional factors: C1, 2.6 mg trypsin-inhibitor activity (TIA)/g; C2, < 5 mg tannins/g expressed as catechin equivalents, 1.9 mg TIA/g; C3, 5.5 mg tannins/g expressed as catechin equivalents, 1.9 mg TIA/g; D1, 4 mg alkaloids/g; D2, 1.5 mg TIA/g; D3, < 0.1 mg TIA/g; El, 3.5 mg TIA/g; E2, 4,umol glucosinolate/g; F1, 1.4 mg biogenic amines/g.
(3) legume seeds, group I ; peas, faba beans (Vicia faba) with low tannin content, faba beans with high tannin content. (4) legume seeds, group I1 ; lupins, toasted full-fat soyabeans, toasted Phaseolus beans. ( 5 ) expellers; soyabean meal, rapeseed meal, sunflower-seed meal. (6) products of animal origin; fish meal, casein, meat-and-bone meal. Eighteen rations (Table 2) were formulated using the eighteen feedstuffs. In rations with a feedstuff containing a low percentage of protein, additional wheat-gluten meal was included to a level of at least 146 g CP/kg. The feedstuffs (except wheat-gluten meal and casein which were manufactured as powders) were ground through a 2.5 mm mesh screen in a hammer mill. Lupins were ground with a Urchul cutting mill to fineness similar to the other milled feedstuffs. As digestive markers both Cr,O, (2-5 g/kg) (Merck, Darmstadt, Germany; cat. no. 1.02483) and HC1-insoluble ash (10 g/kg) (Diamol, purified diatomaceous shell; Biakon NV, Parklaan 18, B2280 Grobbendonk, Belgium) were included in the rations. Analytical procedures Before chemical analysis, feedstuffs, rations and freeze-dried digesta were ground through a 1 mm screen using a Retsch AM 1 grinder. N was analysed by the Kjeldahl method in a semi-automatic Kjellfoss apparatus (Foss Electronic, Hillerod, Denmark). DM contents were determined after drying at 80" overnight. Crude fibre was analysed according to NEN standard 5417 (Netherlands Normalization Institute, 1988). Briefly, samples were boiled for 30 min in 0.13 M-H,SO, and 30 min in 1-5 M-NaOH. After filtration, the samples were ashed and dried.
8.0 22.5
5.0
-
9.0 200
5.0
-
20.0
-
9.3 17.5 5.0
-
9.0 3.0 3.7
-
-
5.0
-
9.3 17.5 5.0
-
9.0 3.0 4.2
-
Soyabean oil Cellulose
CaCO, CaHPO, .2H,O NaCl
I58 887
165 9.20 2.3
11.5
22-5
22.5
2.4 14.5
-
-
-
11.1
166 9.48 24
22-5
0.3
-
-
-
5.0
13.0 3.0
-
-
159 9.83 2.3 9-8
22.5
-
-
-
2-0 18.0 4.0 50
519.0 150.0 15.0
9.04 2.5 10.3
158
22.5
8.87 2.5 29.4
I52
22.5
-
-
-
-
-
3.0 -
1.0
4.3
167 9.20 2.4 12-4
171 9.33 2.4 9.9
02 2.0 22.5
-
-
3.5
0.4 1.7 22.5
2.0 3.0
0.5
-
0.4
-
5.0
9.0 18.5 5.0
-
10.0 16.0
267.8 150.0 10.0
-
5 10-0
c2 Faba beans (Viciafaba) (LT)
80-9 100.0 10.0
-
750.0
Peas
C1
5.0
50.0
100
-
104.3 1500 40.0
12.0 3.0 6.0 1.0 0.3
-
9.5 175 5.0
-
339.7 150.0 100
440
600.0
feed
Maizegluten
B3
169 9.12 2.4 9.9
0.2 2.5 22.5
-
-
2.0 3.0
-
9.o 18.5 5.0
-
10.0
195.3 150.0
-
582.0
Faba beans (HT)
C3
161 9.37 2.4 10.1
0.4 1.3 22-5
-
-
4.0 3.0
-
16.0 5.0
8.0
-
-
249.8 1500
-
540.0
Lupins
DI
15-5
148 9.46 2.5
22-5
-
-
-
-
3.5
-
-
17.5 5.0
8.5
30.0
-
328.0 1500
-
435-0
Soya beans
D2
164 9.58 2.8 17.4
22-5
-
-
-
18.5 5.0 1-0 2.0 4.0 2.0
90
301.0 150.0 15.0 300
90.0
350.0
Phaseolus beans
D3
3.0
171 9.71 2.6 10.5
22-5
-
-
-
166 9.04 2.6 124
22.5
-
-
-
-
3.5 -
-
-
3.0 14.0 5.0
-
262.5 1500 30.0
510.0
149 9.08 2.5 11.3
22.5
-
-
4.0 3.0
-
-
15.0 5.0
8.0
-
282.5 150.0 40.0
470.0
E3 SunRape- flowerseed seed meal meal
E2
-
-
5.0
85 17.5
20.0
10.0
433.0 1500
330.0
Soya bean meal
El
162 9.92 2.5 10.4
22-5
-
-
-
-
-
2.0 1.o 13.0
-
-
10.0 50.0
519.0 1500
232-5
Fish meal
F1
9.66 2.2 10.4
160
22.5
-
-
-
-
533.5 150.0 10.0 500 12.0 16.0 5.0 2.0 15.0 4.0
-
180.0
Casein
F2
10.13 2.5 156
146
0.2 1.3 223
-
-
12.5
1.o
2.0
-
-
10.0 500
150.0
4805
-
270-0
~
F3 Meatandbone meal
LT, low tannin; HT, high tannin; CP, crude protein; NE, net energy. * Contributed the following (/kg diet): ~~-a-tocopheryl acetate 375 mg, riboflavin 6 mg, niacin 30 mg, D-pantothenic acid 15 mg, choline chloride 120 mg, cyanocobalamin 0.045 mg, menadione 3 mg, retinol 2.7 mg, cholecalciferol 45 mg, KI 0.81 mg, CoSO,. 7H,O 7 mg, FeSO, .7H,O 0.4 g, CuSO, .5H,O 0.1 g, MnO, 0.07 g, ZnSO,. H,O 0.3 g. This mixture was supplied with 2.5 g Cr,O, and 10 g Diamol per kg as digestibility markers, and 20 ppm Tylosine as antibiotic.
L-Tryptophan DL-Methionine Vitamin-trace element mixture* CP (N x 6.25) NE (MJ/kg) Chromic oxide HCI-insoluble ash
MgO KHCO, NaHCO, L-Lysine .HC1 L-Threonine
50-0
-
-
-
123.5
-
94.0
300.0
bran
179.0
70.0
meal
765
-
B2
gluten Wheat
Wheat-
Bl
828-2
-
Maize
A3
840-0
Barley
A2
848.0
Wheat
Substituted feedstuff.. .
Substituted feedstuff Wheat-gluten meal Maize starch Glucose
A1
Category ...
Table 2 . Composition and analysed contents of maize-starch-based diets containing cereals, by-products of cereals, legume seeds, expellers and products of animal origin (glkg as f e d )
DIGESTIBILITY OF R A T I O N S F O R P I G S
555
Crude fat was analysed by treating the samples for 1 h with 3 M-HCland drying for 3 h under vacuum at loo", followed by 9 h extraction with petroleum ether (European Commission, 1984). Cr,O, in the rations and digesta was analysed colorimetrically after destruction of the sample by ashing at 525" for 4 h followed by oxidation with Na,O under strong heating with a gas flame. The ash was solubilized in water and the Cr concentration was measured at 372 nm as chromate. HC1-insoluble ash was determined gravimetrically. To this end each ration and digesta sample was hydrolysed with 3 M-HClat 100" for 30 min. Subsequently samples were filtered through an ash-free filter and washed with boiling water until free of acid. Residues were ashed at 550". Procedures used for the determination of the antinutritional factors in the feedstuffs were: for trypsin inhibitor activity (TIA), Van Oort et al. (1989); for condensed tannins (expressed as catechin equivalents), Kuhla & Ebmeier (1981); for alkaloids, European Commission (1971); for glucosinolates, European Commission (1990). Biogenic amines were analysed with an amino acid analyser (Biotronic LC6001, Biotronik, Hamburg, Germany) using ion-exchange column BTC27 10 and U.V. detection. Calculations Apparent digestibilities of CP were corrected for N from synthetic amino acids included in the diet, assuming 100% digestibility. The digestibilities of DM and CP were calculated based on Cr,O, and HC1-insoluble ash corrected for Cr,03. The formula used for the calculation of ileal digestibilities was :
DC=l-
N digesta (g/kg) M digesta (g/kg)
M feed (g/kg) N feed (g/kg) '
where DC is the digestibility coefficient of the nutrient; N feed (g/kg) is the content of the nutrient in feed (g/kg); N digesta (g/kg) is the content of the nutrient in digesta (g/kg); M feed (g/kg) is the content of the marker in feed (g/kg); M digesta (g/kg) is the content of the marker in digesta (g/kg). Statistical analysis Expt 1. Differences between digestibility values derived from the two markers were analysed using the paired sampling Student's t test using Statistical Packages for the Social Sciences software (1992). Expt 2. The experiment was carried out according to a split-plot design with two blocking factors. The blocking factors were animal (twelve animals) and body weights (three domains). The whole plots are product groups (A,.,.,F) of rations with similar protein sources. Subplots were developed with the variation of three feedstuffs within each experiment group (Al, A,, ...,F,, F3). The layout of the design is given in Table 3. The model for data analysis was:
q,, = p + BW, +animal, + 8, +a-ration,
+
E,,(,),
where y y k is the analysed variable, p is the overall mean, BW, is the body-weight domain ( i = 1, ...,3), animalj is the animal (j= 1,. .., 12), aration, is the ration (Al, A,, ...,F,, F,; k = 1,..., 1S), O,, is the main plot error and eij(,) is the subplot error. An analysis of variance was performed with the computer program GENSTAT 5 (Payne, 1994). GENSTAT instructions were : block (animal x BW)/subplot; treatment a-ration//group. The variables
556
P. V A N LEEUWEN A N D OTHERS
Table 3 . Experimental design: split-plot design with twelve animals ( I ...12), three bodyweight domains ( P , Q, R), six product groups of rations ( A ...F) and three feedstuffs from each product group ( A , 3.. .Fl, Animals Body-wt domains
1,4
2, 5
3,6
7, 10
8, 11
9, 12
P
Q R
analysed were ileal digestibility of DM and CP using Cr,O, and HC1-insoluble ash as digestive markers respectively. Digestibilities of three rations with feedstuffs of the same origin were determined in the same group of six animals. Using the same animals for the similar feedstuffs increased comparability within the groups. However, due to the layout of the design the groups and feedstuffs are partially confounded with animals. The degrees of freedom of the least significant difference (LSD) value for comparing feedstuffs of different product groups is calculated according to Satterthwaite’s formula. Correlation between recovery of the digestive markers and digestibility was calculated according to the Spearman rank correlation analysis also with the computer program GENSTAT 5. In addition, statistical analyses of DM and CP digestibility were performed with marker recovery as covariate. GENSTAT instructions were : treatment a-ration; covariate recovery. Feed refusals of individual animals, due to palatability, occurred when feeding the maizegluten-feed ration (B3, two animals), feeding the ration with the high-tannin faba-bean variety (C3, one animal) and feeding the lupin ration (Dl, one animal). This resulted in four missing DM and CP digestibility values of the data set.
RESULTS
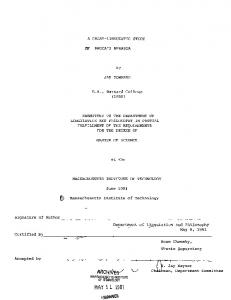
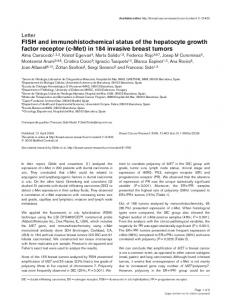
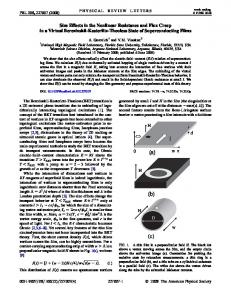
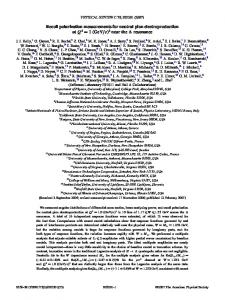
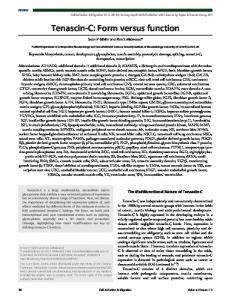
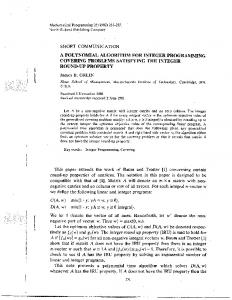
Feedstufs and rations Contents of DM, CP, crude fibre and antinutritional factors in the feedstuffs are given in Table 1. Crude fat contents in toasted full-fat soyabeans, fish meal and meat-and-bone meal were 118, 60 and 92 g/kg respectively. Content of CP in the rations ranged from 146 to 171 g/kg (Table 2). The analysed content of the markers varied for Cr,O, from 2.2 to 2.8 g/kg and for HC1-insoluble ash from 9.9 to 29.4 g/kg. Expt I . Postprandial change in content of nitrogen and markers and digestibility coeficients derived from chromic oxide and hydrochloric acid-insoluble ash The N contents in freeze-dried digesta were, over the 12 h of collection, for both rations rather constant (Fig. 1). Also, when feeding ration El the content of Cr,O, was rather constant (Fig. 2(a)). For ration B2, however, the content of Cr,O, increased after the third hour of the collection period and decreased after the sixth hour of the collection period. The pattern of content of HC1-insoluble ash in the digesta varied for both rations much more than for Cr,O, (Fig. 2(b)). The mean digestibility coefficients for CP, determined with Cr,O, as a lgestibility marker, were for rations B2 and El, 0.834 and 0.825 respectively. Corresponding
40
-
557
DIGESTIBILITY OF R A T I O N S FOR PIGS
30 1
P
-F 5
* C
20.
s
z
10 '
0 0
2
4 6 8 Time after feeding (h)
10
12
Fig. 1. Nitrogen content of freeze-dried digesta collected hourly from pigs after a meal of ration B2 (wheat-bran-gluten meal; -A-)or ration El (soyabean meal; --.--).
digestibility coefficients determined with HC1-insoluble ash as a marker were 0.8 16 and 0-825units. The absolute differencesin digestibility coefficientsdetermined using Cr,O, and HC1-insoluble ash were small (0.018 unit), but significantly different (P< 0.05) for ration B2. Expt 2. Evaluation of the chromic oxide and hydrochloric acid-insoluble ash in an experiment with eighteen rations and the efSect of body weight on digestibility CP digestibility coefficients increased significantly ( P < 0.05) with BW (Table 4).This can be explained mainly by the higher CP digestibility values at the highest body weight. Significant effects were also observed for DM digestibility, but these differences were small. Between animals significant differences (P < 0.05) were found for both DM and CP digestibility. In Table 5 the mean apparent ileal digestibilities of the eighteen individual rations are given with LSD. The LSD of rations from different product groups were slightly higher than those within the same product group. For four out of the eighteen rations differences in DM digestibility between the two markers were significant (P< 005) and the CP digestibilities of three out of the eighteen rations were different (P< 0.05). The digestibility coefficients of DM derived from Cr,O, were significantly higher than those derived from HC1-insoluble ash for the DM of the wheat ration (Al), the maize-gluten-feed ration (B3), lupin ration (DI) and the sunflower-seed-meal ration (F3). The CP digestibility coefficient of the maize-gluten-feed ration (B3) was significantly ( P < 0.05) higher and the CP digestibility coefficients of the soyabean-meal ration (El) and fish-meal ration (Fl) were significantly lower when calculated with Cr,O, as a marker rather than HC1-insoluble ash. The recovery of the two markers collected in digesta ranged from 78 (C3) to 109 (F2) percentage units of the Cr,O, dietary intake, and from 78 (C3) to 112 (F2) percentage units of the HCI-insoluble-ashintake. The means of both marker recoveries of the rations were positively correlated with means of the DM and CP digestibility of the rations ( P < 0.05); however, the correlation coefficients (R')were < 0.29. DM and CP digestibility coefficients obtained after correction for marker recovery were similar to those without this correction.
558
P. V A N LEEUWEN A N D OTHERS 10
8
2
0 0
2
4 6 8 Time after feeding (h)
10
12
80
-P
60
F
I
-20
2
0
6
4
8
10
12
lime after feeding (h) Fig. 2. Contents of (a) chromium and (b) HC1-insoluble ash in freeze-dried digesta collected hourly from pigs or ration El (soyabean meal; --0--). after a meal of ration BZ (wheat-bran-gluten meal; -A-)
Table 4. Mean apparent ileal digestibility coeflcients of dry matter ( D M ) and crude protein ( C P ; N x 6.25) in pigs at diferent body weights ( B W ) determined with chromic oxide and hydrochloric acid-insoluble ash as digestive markers* CrA
Ash
Mean BW (kg)
DM
CP
DM
CP
46 63 94
0.720 0.718 0.726
0.749 0.749 0.771 0.019
0.715 0.720 0.718 0.013
0.746 0.752 0.766 0.011
LSD
(P= 0.05)
least significant difference. For details of procedures, see pp. 552-555.
LSD,
*
0014
559
DIGESTIBILITY OF R A T I O N S FOR PIGS
Table 5 . Apparent ileal digestibility coeficients of dry matter ( D M ) and crude protein ( C P ; N x 6 .,25) in pigs, for eighteen feedstufls from six categories (A-F) determined with chromic oxide and hydrochloric acid-insoluble ash as digestive markers? DM Feedstuff A1 Wheat A2 Barley A3 Maize B1 Wheat-gluten meal B2 Wheat bran B3 Maize-gluten feed c 1 Peas c 2 Faba beans (Vicia fuba) (LT) c 3 Faba beans (HT) DI Lupins D2 Toasted full-fat soyabeans D3 Toasted Phaseolus beans El Soyabean meal E2 Rapeseed meal E3 Sunflower-seed meal F1 Fish meal F2 Casein F3 Meat-and-bone meal LSD within the same product group (P = 005) LSD from different product groups (P = 005)
Cr,O,
Ash
0797 0.685 0412 0.854 0.728 0.549 0.715 0701 0.688 0.600 0.694 0.640 0.802 0.650 0643 0821 0.869 0.737 0.023
0.776 0.692 0.802 0.863 0.730 0.500 0713 0.698 0.684 0577 0699 0.646 0.817 0.654 0.625 0.833 0,867 0.743 0025
0,025
0.025
CP
Difference1
* NS NS
NS NS
*
NS NS NS
*
NS NS NS NS
*
NS NS NS
Cr,08
Ash
Difference1
0.87 1 0.788 0,838 0.9 15 0826
NS NS NS NS NS
0.761 0.736 0.696 0.771 0.725 0655 0804 0.582 0.73 1 0.770 0.924 0.6 I 2 0.030
0.859 0.792 0430 0.920 0427 0.566 0.761 0.735 0.692 0.762 0.729 0.659 0.818 0.585 0.719 0787 0.922 0.619 0.032
0033
0.036
0.610
*
NS NS NS NS NS NS
*
NS NS
*
NS NS
LT, low tannin; HT, high tannin; LSD, least significant difference. * P < 0.05. t For details of feedstuffs and procedures, see Table 1 and pp. 552-555. 1 Difference between digestibility values measured using Cr,O, and HC1-insolubleash assessed using Student’s paired t test. DISCUSSION
Content of both markers varied in the diets (Table 2). The Cr,O, content was, with the exception of Phaseolus bean ration (D3), close to or lower than the intended dosage (2.5 g/kg). Variation of HC1-insoluble ash content of the rations can be explained by the differences in the HC1-insoluble-ashcontent of the feedstuffs (Wunsche et al. 1984) and by the different amounts of mineral added to the rations. Analytical difficulties, such as interference from P (Saha & Gilbreath, 1991), possibly explain part of the variation of the Cr,O, content in the rations. Comparing digestibility coefficients derived from Cr,O, v . total collections, Bakker & Jongbloed (1994) recently showed the validity of using Cr,O, as a digestive marker. However, the use of Cr, which is a heavy metal, is limited for routine experiments because of national and international environmental legislations (Besluit Aanwijzing Gevaarlijke Afvalstoffen, 1993; European Commission, 1976). An alternative to Cr,O, is HC1-insoluble ash. Bakker & Jongbloed (1994) concluded that HC1-insoluble ash was not suitable for the determination of faecal digestibility. However, in their experiment no extra HC1-insoluble ash was added to the rations making accurate qualitative analysis more critical (McCarthy et al. 1974). On the other hand, Wunsche et al. (1984) using barley-soyabean-meal rations found apparent ileal DM and CP digestibility values, assessed with HC1-insoluble ash from the feedstuffs, similar to those
560
P. V A N LEEUWEN A N D O T H E R S
obtained by quantitative collection of digesta. Moughan et ul. (1991) support the use of natural dietary HC1-insoluble ash as a marker and have suggested the addition of diatomaceous earth when the natural level of insoluble ash is low. Also, Jongbloed et al. (1991) have suggested, based on the results of an experiment where the overall digestibility was measured, addition of milled diatomaceous shells to decrease the variation of digestibility values. In the present experiment diatomaceous shells (Diamol) were added to all rations to guarantee that the HC1-insoluble ash level was high enough for accurate analysis. A prerequisite for the use of a marker is that the nutrient:marker content ratio in the collected digesta has to be representative of the total digesta that passes the terminal ileum. However, the ratios in the undigested material can change postprandially (Moore, 1957). Only quantitative collection, semi-quantitative collection or frequent collection provides representative samples. The results of the first experiment showed rather constant N content in the freeze-dried digesta during collection. Variation in Cr,O, content in the digesta during collection, however, differed between the rations. Cr,O, content was rather constant after feeding the soyabean ration (calculated crude fibre content: 14 g/kg) but varied after feeding the wheat bran-gluten ration (calculated crude fibre content: 34 g/kg). However, variation of HC1-insoluble-ash passage was found when feeding both the soyabean and wheat bran-gluten rations. The observed variation implies differences in the nutrient: marker content ratio in digesta during collection and means that the method used to collect digesta is critical for accurate calculation of digestibilities. In the present experiments, digesta were collected semi-quantitatively. In Expt 2, apparent DM digestibilities derived from the two markers were similar for fourteen out of the eighteen rations. For four rations the difference in DM digestibility between the two markers was significant (P< 0.05). On these occasions the values derived from Cr,O, were higher than those derived from HCl-insoluble ash. The CP digestibilities of three out of the eighteen rations were different (P < 0.05); one value for Cr,O, was higher than that for HClinsoluble ash and two were lower. The absolute differences in apparent DM and CP digestibility were, with the exception of the relatively poorly digestible ration B3, < 0.023. Further, results showed that the digestibilities derived from Cr,O, were not systematically higher or lower than those derived from HC1-insoluble ash and that the LSD were similar. However, validity of markers in general can be improved when variation in the nutrient: marker content ratio in the undigested material is reduced. This could possibly be achieved by feeding the animals more frequently. In the present study, animals were fed every 12 h and digesta samples were collected, also, over 12 h. The recovered amount of marker should be loo%, or less if some digesta passed the collection cannula. However, when feeding the casein ration (F2) the collected amount of the markers was over 100% (for Cr,O, 109% and for insoluble ash 107%). The recovery of the markers was higher in rations with a high CP digestibility which have, in general, a low crude-fibre content. In high-fibre rations relatively more digesta flows through to the colon thereby passing the collection cannula. The differences in recovery were also observed within rations and between animals. Within rations, no correlations were found between recovery of the marker and DM or CP digestibility. However, the observations indicate an increased passage rate during digesta collection. The explanation for this phenomenon may be the effect of a change of the abdominal pressure after opening the cannula and a difference in activity of the animals during the night (without collection) and during the day (collection period). Furthermore, during digesta collection, no colo-ileal reflux is possible. Malbert et u1. (1994) concluded that this reflux alters the gastro-duodenal motility. The observation that no correlations were found within rations between recovery and digestibility prove that the possible effect on motility does not alter digestibility. However, frequent feeding and
D I G E S T I B I L I T Y OF R A T I O N S FOR P I G S
56 1
shortening of the collection period would be more in accordance with the physiology of the animal because the period of the interruption of the colo-ileal reflux is shorter. Moreover, frequent feeding may be more comparable to conventional pig feed management systems in Europe. The apparent ileal CP digestibility values of the rations with a single feedstuff as protein source in the present study can be compared with data from the literature (van Leeuwen et al. 1993). The apparent ileal CP digestibility values from the present experiment (exp.) are in good agreement with values from the literature (lit.) for peas (0.76 (exp.) v. 0.74 (lit.)), faba beans (0.71 (exp.) v. 0.73 (lit.)), soyabean meal (0.81 (exp.) v. 0-79 (lit.)), sunflower-seed meal (0.72 (exp.) v. 0.74 (lit.)), fish meal (0.78 (exp.) v. 0.78 (lit.)) and casein (0.92 (exp.) v. 0.91 (lit.)). The CP digestibility values of three feedstuffs in the present experiment were lower than literature values (lupins, 0.77 (exp.) v. 0.82 (lit.), rapeseed meal, 0.58 (exp.) v. 0.69 (lit.), meat-and-bone meal, 0.62 (exp.) v. 0.70 (lit.)). The latter observations illustrate the possible differences between the digestibility value of different individual batches of the same type of feedstuff. Also, apparent digestibilities of DM and CP were significantly ( P < 0.05) different between individual animals. The variation between individual crossbred animals may alter factors such as enzyme activity of the intestinal mucosa (van Leeuwen et al. 1995) and possibly contribute to the differences between digestibility values determined in the present experiment and the literature values. A slight increase in CP of 0.021 was observed over the BW range of 46-94 kg. For DM, no BW effect was found. These observations indicate that the digestion capacity in this BW range changes to a minor extent. In summary, apparent ileal digestibility coefficients of DM and CP when using HClinsoluble ash and Cr,O, as digestive markers were similar when 10 g/kg diatomaceous shells (Diamol) was added to the rations and digesta was collected semi-quantitatively. Shortening of the collection periods in combination with frequent feeding might improve the measurements for ileal digestibility experiments. This aspect needs further investigation. The authors wish to thank W. Caine for advice during the preparation of the manuscript and G. Beelen for the technical organization. REFERENCES Besluit Aanwijzing Gevaarlijke Afvalstoffen (1993). Staatsblad, 617,25/11/1993. Staatsdrukkerij, PO Box 20014, 2500 EA Den Haag, The Netherlands. Bakker, G. C. M. & Jongbloed, A. W. (1994). The effect of housing system on apparent digestibility in pigs using classical and marker (chromic oxide, acid HCI-insoluble ash) techniques, in relation to dietary composition. Journal of the Science of Food and Agriculture 64, 107-1 15. European Commission (1971). Determination of Alkaloid Content in Lupin Seed, p. L155/35. Luxembourg: Publication Office of European Communities. European Commission (1976). Environment, Nuclear Safety and Civil Protection. Commission of the European Conimunities Publication no. DG XI, p. L129/23. Brussels: European Commission. European Commission (1984). Determination of Crude Fat Content, p. LI 5/29. Luxembourg: Publication Office of' European Communities. European Commission (1 990). Determination of Glucosinolates, p. L170/28. Luxembourg: Publication Office of European Communities. Jongbloed, A. W., Bakker, J. G. M., Goedhart, P. W. & Krol-Kramer, F. (1991). Evaluation of chromic oxide and of HC1-insoluble ash as markers for measuring overall apparent digestibility of some dietary nutrients for pigs. In Proceedings of the Vth International Symposium on Digestive Physiology in Pigs, pp. 325-329 [M. W. A. Verstegen, J. Huisman and L. A. den Hartog, editors]. Wageningen: PUDOC. Kuhla, S . & Ebmeier, C. (1981). Untersuchungen zum Tanningehalt in Ackerbohnen (Investigations of the tannin contents of horse beans). Archives of Animal Nutrition 31, 573-588. McCarthy, J. F., Aherne, F. X. & Okai, D. B. (1974). Use of HCI-insoluble ash as an index for determining apparent digestibility with pigs. Canadian Journal of Animal Science 54, 107-109. Malbert, C. H., Montfort, I., Mathis, C., Gutrin, S. & Laplace, J. P. (1994). Remote effects of ileo-colic SCFAs levels on gastric motility and emptying. In Proceedings of the VIth International Symposium on Digestive
562
P. V A N L E E U W E N A N D O T H E R S
Physiology in Pigs. EAAP Publication no. 80, pp. 283-286 [w. B. Souffrant and H. Hagemeister, editors]. Bad Doberan, Germany: Kauffold (FBN). Moore, J. H. (1957). Diurnal variations in the composition of the faeces of pigs on diets containing chromium oxide. British Journal of Nutrition 11, 273-288. Moughan, P. J., Smith, W. C., Schrama, J. & Smits, C. (1991). Chromic oxide and insoluble ash as faecal markers in digestibility studies with young pigs. New Zealand Journal of Agricultural Research 34, 85-88. Netherlands Normalization Institute (1988). Standards of the Netherlands Normalization Institute no. 5417. Determination of Crude Fibre Contents in Feedstugs, Delft: Netherlands Normalization Institute. Payne, R. W. (1994). Users Manual GENSTAT 5 . Oxford: Clarendon Press. Saha, D. C. & Gilbreath, R. L. (1991). Analytical recovery of chromium from diet and faeces determined by colorimetry and atomic absorption spectrophotometry. Journal of the Science of Food and Agriculture 55, 43346. Statistical Package for the Social Sciences (1992). System Users’ Guide. SPSS P C + . Version 5.0 Base. Chicago. IL: Marija J. Norusis. van Leeuwen, P., Jansman, A. J. M., van Kempen, G. J. M., Verstegen, M. W. A. & Huisman, J. (1993). Mathematical analysis of apparent ileal digestibility of amino acids in feedstuffs for pigs. Livestock Production Science 36, 255-212. van Leeuwen, P., Jansman, A. J. M. & Wiebenga, J. (1995). Dietary effects of faba-bean (Viciafaba L.) tannins on the morphology and function of the small-intestinal mucosa of weaned pigs. British Journal ofNutrition 73, 31-39. van Leeuwen, P., van Kleef, D. J., van Kempen, G. J. M., Huisman, J. & Verstegen, M. W. A. (1991). The post valve T-caecum cannulation technique in pigs applicated to determine the digestibility of amino acids in maize, groundnut and sunflower meal. Journal of Animal Physiology and Animal Nutrition 65, 183-193. van Oort, M. G., Hamer, R. J. & Slager, E. A. (1989). The trypsin inhibitor assay: improvement of an existing method. In Recent Advances OfReseorch in Antinutritional Factors in Legume Seeds, pp. 110-113 [J. Huisman, A. F. B. van der Poel and I. E.Liener, editors]. Wageningen: PUDOC. Wiinsche, J., Borgmann, E., Hennig, U., Kreienbring, K. & Bock, H.-D. (1984). Anwendung der HC1-unloslichen Asche als Indicator zur bestimmung der Nahrstoff- eischlieblich Aminosaurenverdaulichkeit am Ende des Diinndarms und des Gesamtverdauungstraktes beim Schwein (Application of the HC1-insoluble ash as an indicator for the determination of nutrient, including amino acid, digestibility at the end of the small intestine and the whole digestive tract of pigs). Archives of Animal Nutrition 12, 817-831.
Printed in Great Britain