Thorsten Hennig-Thurau, André Marchand, & Paul Marx
Can Automated Group Recommender Systems Help Consumers Make Better Choices?
Because hedonic products consist predominantly of experience attributes, often with many available alternatives, choosing the “right” one is a demanding task for consumers. Decision making becomes even more difficult when a group, instead of an individual consumer, will consume the product, as is regularly the case for hedonic offerings such as movies, opera performances, and wine. Noting the prevalence of automated recommender systems as decision aids, the authors investigate the power of group recommender systems that consider the preferences of all group members. The authors develop a conceptual framework of the effects of group recommenders and empirically examine these effects through two choice experiments. They find that automated group recommenders offer more valuable information than single recommenders when the choice agent must consume the recommended alternative. However, when agents choose freely among alternatives, the group’s social relationship quality determines whether group recommenders actually create higher group value. Finally, group recommenders outperform decision making without automated recommendations if the agent’s intention to use the systems is high. A decision tree model of recommender usage offers guidance to hedonic product managers.
Keywords: recommender systems, joint consumption, hedonic products, agents, group decisions, social relationship quality
C
for example, when the online movie rental company Netflix recently offered $1 million to anyone who could increase the prediction accuracy of its recommender system by 10%, more than 20,000 researchers responded (Lohr 2009). For this research, we take a different route. In both practice and research, most automated recommenders focus on an individual consumer’s preferences, ignoring a common consumption situation for hedonic products and services— namely, joint consumption by a group of consumers. More than 90% of movie visits include friends or relatives (FFA 2011), and similar percentages are likely for leisure travel, restaurant visits, wine purchases, music concerts, and so on. Moreover, although consumption takes place jointly, often only a fraction of the group members participates in the actual decision-making process, acting as agents for the other members (Weinberg 2003). For example, Weinberg (2003, p. 24) finds that “35% of [video] renters were making choices for people who were not in the store with them.” We investigate whether, in such a context, automated group recommenders that consider the preferences of all group members (i.e., the agent and his or her partners) can help consumers make better decisions. Group recommenders, as we conceptualize here, use the past ratings of alternatives in a product category by all group members (as well as many other users of the recommendation system) to generate anticipated ratings for products that the group members have not yet consumed. The resulting recommendations are calculated through collaborative filtering or similar approaches and are designed to maximize group value, which we define as the unweighted mean of the value that the members of the group derive from consuming a product.
hoosing the best hedonic product represents a challenging task for consumers. Consider motion pictures: The abundance of available titles, combined with their experience good character, means consumers rarely know which offering will provide the highest value. Similar arguments apply to other hedonic products, such as video games, vacation resorts, and restaurants. To reduce the complexity of the choice process, automated recommender systems generate personalized predictions about product liking by filtering the past behavior of and preference statements from consumers (Bodapati 2008; Hennig-Thurau et al. 2010). Such systems are widespread; research indicates that they increase customers’ satisfaction and lead to higher sales (Fleder and Hosanagar 2009). Scholars and companies continue to search for ways to increase their effectiveness; Thorsten Hennig-Thurau is Professor of Marketing, Marketing Center Münster, University of Münster, and Research Professor of Marketing, Faculty of Management, Cass Business School, City University London (e-mail:
[email protected]). André Marchand is Assistant Professor of Marketing, Marketing Center Münster, University of Münster (e-mail:
[email protected]). Paul Marx is a doctoral student, Department of Marketing and Media, Bauhaus-University of Weimar (e-mail: marx@ eQuestionnaire.de). The authors thank the cooperating recommender site, Kinowelt/StudioCanal, and particularly Jan Rickers and Michael Kölmel for their extensive intellectual and logistic support of this project, as well as colleagues Mark B. Houston, Tom Gross, and Manfred Krafft for their constructive feedback. The authors are indebted to the DFG (German Research Foundation) for financial support. The authors also thank the anonymous JM reviewers for their helpful and constructive comments on this research. Ajay Kohli served as area editor for this article.
© 2012, American Marketing Association ISSN: 0022-2429 (print), 1547-7185 (electronic)
89
Journal of Marketing Volume 76 (September 2012), 89–109
This research is the first to investigate the power of group recommenders and assess the value contribution of these rarely used systems to consumers and companies. We develop a conceptual framework of the effects of group recommenders and empirically examine these effects. On the basis of the results, we also offer a decision tree for managers who currently offer automated recommenders or plan to do so. Our research responds to calls from marketing and consumer research scholars to dedicate more attention to group consumption processes (e.g., Bagozzi 2000; Epp and Price 2008). Regarding the effects of group recommenders, we argue that in a group consumption context, group recommenders should lead to better choices than the widespread single recommender systems that feature only the preferences of a single group member (the agent), not those of any partners. They should also outperform conditions in which no automated recommender is present, such as when an agent chooses a product solely on the basis of his or her personal knowledge of group members’ preferences. We also consider forces that might moderate the effectiveness of group recommenders, namely, the group’s social relationship quality (e.g., Spanier 1976) and an agent’s intention to use automated recommenders in the future (e.g., Baier and Stüber 2010). To test our propositions, we conduct two laboratory experiments that compare the effectiveness of a collaborative filter-based group recommender with single and no recommender conditions. Both experiments focus on dyads, the most common type of groups in many hedonic industries, and use movies as the product category; in each experiment one member of a dyad acts as an agent and selects a product alternative (i.e., a movie). Subsequently, the dyad consumes the product jointly, and each member reports his or her value perceptions. In a restricted-choice scenario in which agents must pick a top recommended alternative, the results support our assertion that, on average, group recommenders generate better recommendations than single recommenders. However, this effect fades when agents can choose freely among all alternatives. In this latter case, the superiority of group recommenders depends on the dyad’s social relationship quality; group recommenders are more effective for dyads characterized by high social relationship quality. Furthermore, group recommenders outperform the agent’s choices when he or she uses no recommender, though only if the agent has a high intention to use recommenders in the future, in support of the theoretically proposed boundary conditions. These findings inform a decision tree model that offers managers detailed guidance about the effective uses of recommenders in general and group recommenders in particular.
Theoretical Background
Research on Automated Recommenders for Individual Consumers
Most existing research on automated recommender systems focuses on developing algorithms that predict user preferences with minimal error, often employing item- or user90 / Journal of Marketing, September 2012
based collaborative filtering techniques (e.g., Li et al. 2007) or hybrid filtering methods (e.g., Liu, Lai, and Lee 2009). In addition to the contributions of information systems scholars (e.g., Koren 2009), marketing scholars have extended the discussion, such as with Ansari, Essegaier, and Kohli’s (2000) Bayesian preference model and Ying, Feinberg, and Wedel’s (2006) model that accounts for the latent processes underlying ratings. Bodapati (2008) also has introduced a model based on the sensitivity of customers’ purchase probability to recommendations, and Häubl and colleagues investigate consumer behaviors related to the use of automated recommenders in a series of studies (e.g., Häubl and Murray 2003; Häubl and Trifts 2000). In general, such research implies that the intelligent use of “collective wisdom” by automated recommenders helps consumers make better decisions, compared with constellations without recommender systems, though little empirical evidence confirms this assumption. Studies focusing on algorithms report relative improvements in prediction errors (e.g., root mean squared error) compared with benchmark models (e.g., Koren 2009; Ying, Feinberg, and Wedel 2006), but they rarely discuss the absolute goodness of fit of the recommenders. The only study we know of that directly compares recommender versus no recommender predictions is Krishnan et al. (2008), who find that, on average, automated recommenders predict film ratings of 14 consumers better than a sample of 50 human raters, but recommender predictions are better for less than half of the consumers (i.e., 43%). Joint Consumption and Group Recommenders
Extant research on recommender systems and consumer behavior in general focuses on individual behavior; group processes have received far less attention. However, joint consumption has at least equal relevance for several product categories, especially hedonic goods (Raghunathan and Corfman 2006), and scholars have called for more attention to be dedicated to joint consumption (e.g., Bagozzi 2000). In response, some marketing researchers have used normative and prescriptive group decision theory to develop complex decision models, in which a group seeks to maximize its aggregated utility functions in conditions of uncertainty (e.g., Adamowicz et al. 2005). Other scholars offer econometric models of group decision making. For example, Rao and Steckel (1991) model group preferences as a weighted linear combination of individual preferences and an intercept term; Arora and Allenby (1999) study the impact of member preferences on group decisions with a hierarchical Bayes model; and Aribarg, Arora, and Kang (2010) model a group’s utility according to the initial and revised preferences of the individual group members. Most research on joint consumption assumes that group members decide jointly, though often only a subgroup of members might participate in the actual choice, acting as “choice agents” for other group members (Weinberg 2003). Some research considers related concepts, such as purchasing agents (consumers who select a product for another; e.g., West 1996) and surrogate shoppers (consumers who take over unwanted marketplace activities from other con-
sumers; e.g., Solomon 1986), though in these cases, the agent him- or herself does not consume the purchased choice. Thus, the role of agents who choose a product for a group of consumers to which they belong remains unclear. Finally, in the context of recommender research, some computer science scholars have developed prototypes of group recommenders. These prototypes include PolyLens (O’Connor et al. 2001), CATS (McCarthy et al. 2006), Adaptive Radio (Chao, Balthrop, and Forrest 2005), and MusicFX (McCarthy and Anagnost 1998). Some recent developments even have been implemented by scholars on Facebook (GroupFun: see Popescu and Pu 2011; Happy Movie: see Quijano-Sánchez et al. 2011). However, no systematic efforts have evaluated the performance of these systems, and it remains unclear how the integration of group members’ preferences in the form of automated group recommenders affects consumers’ value perceptions, particularly compared with single recommenders or other information sources (e.g., an agent’s tacit knowledge of partners’ preferences). We aim to shed more light on this issue.
Conceptual Framework and Research Hypotheses
Setting and Overview of Conceptual Model
We study a common hedonic consumption context: A group, which consists of an agent and one or more partners, plans to consume a hedonic product such as a movie. The group gives the agent the mandate to select a specific prod-
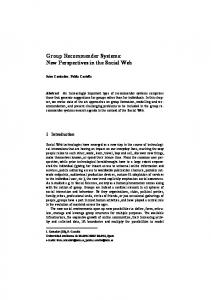
uct from a list of available alternatives, with the objective of choosing the alternative that provides the highest group value. As we show in Figure 1, we investigate whether the information provided by group recommenders that consider the preferences of all group members generates higher group value (the unweighted mean of the value that the members of the group derive from consuming a chosen product), as well as higher value for the individual members of the group—namely, the agent (agent value, or the value an agent derives from consuming the chosen product) and his or her partners (partner value, or the value that a partner derives from consuming the chosen product). We compare these outcomes with the value produced through other information sources: automated single recommenders (which only consider the preferences of the agent, not the partners) and the agent’s own knowledge (without the input of a group or single recommender). Finally, we analyze whether these paths are moderated by social characteristics (the group’s social relationship quality) and personal characteristics (the agent’s intention to use recommender systems in the future). Main Effects: Group Versus Single and No Recommenders
Group recommenders versus single recommenders. When applied in a group consumption context, single recommender systems, which are the industry standard for automated recommendations, determine an agent’s preferences and make personalized recommendations for him or
FIGURE 1 Conceptual Framework of Group Recommenders
Information Source
Moderators
Value
Group recommender
Social relationship quality
Agent value
Single recommender
No recommender
Group value
Intention to use recommenders
Partner value
Automated Group Recommender Systems / 91
her. When applied in a group consumption context, a single recommender thus aims to maximize agent value but does not consider the preferences of any partners. In contrast, a group recommender aims to maximize the group value perception by recommending products valued by both the agent and his and her partners. In this sense, group recommenders inherently involve a trade-off across different group members’ interests. The agent likely would attain higher value from single recommenders because group recommenders require the agent to make a compromise that implies a deviation from his or her value-maximizing choice. Yet the recommendations generated by a group recommender also should provide more value for partners as a result of this compromise. Because the group’s value perception by definition involves the value perceived by both agent and partners, the effect of group (versus single) recommenders on group value depends on the outcome of this trade-off. If (and only if) the loss in agent value is compensated for by the gain in partner value, the compromise option that the group recommender suggests generates higher group value than the single recommender. This outcome depends on the group recommender’s ability to transform the available information about agent and partner preferences in a meaningful way. H1a and H1b propose the effects of group recommenders on partners and the agent, respectively. H1c then summarizes our expectation that group recommenders offer recommendations that increase partner value more than they reduce agent value and, by doing so, outperform single recommenders when a hedonic experience product is consumed by a group instead of an individual consumer. H1: Automated group recommenders offer (a) higher partner value, (b) lower agent value, and (c) higher group value than single recommenders.
Group recommenders versus no recommenders. Automated recommenders in general provide personalized suggestions, drawn from information provided by a large number of other (usually anonymous) consumers. Therefore, group recommenders should produce higher-quality decisions than those that arise when no automated recommender is available, such as when the agent makes a choice solely on the basis of his or her own personal knowledge of group members’ preferences (the no recommender constellation). Specifically, the recommender equips the agent with “collective intelligence” (Lévy 1997)—that is, information about product preferences derived from a multitude of other consumers; such information is not available to the agent when he or she has no access to a recommender system. However, consumers often have great talent to draw and interpret soft information about other consumers—a skill lacking in the algorithms used to generate automated recommendations. That is, the recommender’s lack of such soft skills could lead to suboptimal recommendations that, if adopted by the agent, could produce lower group value than decisions based solely on soft information. Overall, however, we expect that the combination of access to collective intelligence from group recommender results and personal soft information will lead to better decisions by the agent. Thus: 92 / Journal of Marketing, September 2012
H2: Product choices made by an agent with access to a group recommendation system result in higher group value than those made without a recommendation system.
Interaction Effects: Social Relationship Quality and Intention to Use Recommenders
Social relationship quality. The superiority of group recommenders over single and no recommenders might vary with the quality of the social relationships among group members, that is, the group’s social relationship quality. Social relationship quality, defined as the qualitative evaluation of a social relationship (Spanier 1976), is a wellestablished and widely studied construct in social psychology research (e.g., Collins and Read 1990; Kurdek and Schmitt 1986).1 Social psychologists offer different conceptualizations of the construct (Fletcher, Simpson, and Thomas 2000); for this research, we employ Spanier’s (1976) popular approach. Spanier models social relationship quality according to three dimensions: satisfaction with marriage, consensus, and cohesion. His model clearly focuses on a specific context (i.e., married couples), so we adapted these dimensions to our study context, drawing on extant social relationship quality research to find related concepts that previously have been modeled as facets of relationship quality. Specifically, we use relational liking (the degree of interpersonal attraction; Collins and Read 1990) instead of satisfaction with the marriage, perceived relational similarity (the overlap of perceptions, attitudes, and values between partners; Norton 1983) instead of consensus, and perceived relational closeness (the degree to which partners share their inmost feelings and thoughts; Aron, Aron, and Smollan 1992) instead of cohesion. With regard to the proposed moderating role of social relationship quality, we expect group recommenders to have a stronger positive effect on group value when relationship quality is high than when it is low. Group recommenders provide value based on the assumption that group members in general, and the agent in particular, search for a compromise (i.e., the trade-off of personal preferences against the preferences of other group members); therefore, it is important that the group members are willing to accept such a compromise. We anticipate that they are willing to do so when the group’s social relationship quality is high, such as when group members strongly like one another. However, group members may be less willing to compromise, and value the compromise choice offered by group recommenders less, when their group’s social relationship quality is low. An agent who chooses a compromise product (which optimizes not his or her own preferences but rather the group’s as a whole) should be satisfied with the selection, as should the partners (whose preferences are considered in the selection process), if they enjoy high social relationship quality. In contrast, if the group’s social relationship quality 1In social psychology, this construct is mostly referred to as “relationship quality,” but we prefer the term “social relationship quality” to distinguish our construct from research on commercial relationships between customers and firms that also uses the term “relationship quality” to describe a different phenomenon (e.g., Palmatier et al. 2006).
is low, the agent suffers adverse consequences of a compromise choice that includes the preferences of partners whom the agent likes less. Even if these partners appreciate the choice to the same degree, group value (i.e., an aggregate of all group members’ value perceptions) will be lower in the low social relationship quality condition. Furthermore, because the consumption takes place jointly, the agent’s positive or negative perceptions of the compromise option might strengthen partners’ perceptions of the consumption experience through social influence effects (e.g., Bohlmann et al. 2006; Raghunathan and Corfman 2006) and emotive processes (e.g., Hatfield, Cacioppo, and Rapson 1994). Thus: H3: The impact of group versus single or no recommender systems on group value is moderated by the group’s social relationship quality, such that group recommenders are more effective when the group’s social relationship quality is high (vs. low).
Intention to use automated recommenders. The effectiveness of group recommenders also may depend on individual agent characteristics. Specifically, we build on research that has shown that an agent’s attitudes about and intentions to use automated recommenders (conative attitude) vary across consumers (Baier and Stüber 2010; Fitzsimons and Lehmann 2004; Hu and Pu 2009).2 If an agent does not believe that automated recommenders are valuable information sources and has no intention to use them in the future, he or she derives less value from using them than an agent who holds a positive attitude toward recommenders and intends to use them in the future. We argue that agents with negative attitudes toward automated recommenders will devalue the information provided by the recommender system and either discount this information or express bias against it by rating recommended choices less positively. This behavior should also affect partner value because the agent’s choices will be less effective for the group, and negative sentiment again spreads through social influence and emotional contagion (Hatfield, Cacioppo, and Rapson 1994; Raghunathan and Corfman 2006). If the agent instead holds a positive attitude toward recommenders and intends to use them in the future, these detrimental effects should not occur, which will lead to higher group value. Thus: H4: The impact of group versus no recommender systems on group value is moderated by the agent’s intention to use recommender systems, such that group recommenders are more effective when the agent’s usage intention is high (vs. low).
Testing the Hypotheses: Two Experiments
To test the hypothesized relationships, we conducted two experiments. In the first experiment, we restricted agents’ choice by filtering out influences that were not related to the recommendations, so that we could compare the value potential inherent to group versus single recommenders 2The intention to use a recommender system construct does not differ between the group and single recommender conditions, so we consider it only for the group versus no recommender comparison.
directly (restricted choice design) and test our first hypothesis. This design implies a reduction of choice for participants, so we controlled for a potential effect of agents’ reactance (i.e., a motivational state directed toward reattaining the original freedom of choice; Brehm 1966) to the choice design, which might bias participants’ value perceptions (Fitzsimons and Lehmann 2004). In the second experiment, agents could choose freely among alternatives (free choice design). This study was necessary because H2–H4 involve a comparison between a group recommender and a no recommender condition. Because it is essential for the latter condition that agents can choose freely among available alternatives (solely on the basis of their personal knowledge), comparing such a free choice with a restricted choice condition for the recommender scenarios would have disadvantaged the latter and caused biased results. Moreover, testing the moderating effects of social relationship quality (H3) also requires the agent to have discretion, which was not the case in the first experiment. In both experiments, we used movies as the product category because they are predominantly consumed in groups and difficult to assess in advance (De Vany and Walls 1999). In addition, the type of consumer agency behavior implied in our theoretical arguments is an established phenomenon in the movie context (Weinberg 2003), and movies are a standard setting for automated recommenders in both academia (e.g., Ansari, Essegaier, and Kohli 2000) and practice (e.g., Netflix). In both experiments, we studied dyads (i.e., groups of two persons), consistent with previous research on group decisions (e.g., West 1996). In addition to limiting the complexity of the experiments, a two-person group size has practical relevance because it represents the dominant constellation for hedonic product categories, including motion pictures (FFA 2011). Experiment 1: Restricted Choice
Sample and preparatory actions. Participants were recruited through posters, website announcements, e-mails, and personal communication throughout the campus of a large public German university; they consisted mostly of (graduate) students. Each participant who registered at the specific university website to participate in a study on “consumer satisfaction with movies” had to provide contact details for him- or herself and for a partner who had agreed to participate. Both partners then received a unique identifier, such that they could set up an account with a popular German movie recommender website and rate a minimum of 50 movies. At the time of the experiment, the actual website contained approximately 4.8 million ratings of some 40,000 movies by more than 30,000 active users. Each participating dyad could receive two movies on DVD (the one selected in the experiment and an additional title they selected after their successful participation), as well as extra course credit, as compensation. Among the 214 participants who took part (107 dyads; group recommender = 52 dyads, single recommender = 55 dyads), the average age was 24.4 years, and 37.4% were women. Table 1 provides further descriptive information. Automated Group Recommender Systems / 93
Design. Registered participants were randomly assigned to be agents or partners in their dyad. Agent participants visited the experimental lab, without their partners, where they were asked to select a movie that they and their partner had to watch together within two weeks of their choice. The 24 available movies were equally distributed across six common genres (action, drama, horror, love story, comedy, TABLE 1 Sample Description Experiment 1
Experiment 2
Agents Partners Agents Partners
Total Participants 107 107 123 Gender Female 27 (25%) 53 (50%) 68 (55%) Male 80 (75%) 54 (50%) 55 (45%) Age (in Years) Range 21–31 19–56 17–60 M 24.10 24.71 25.41 Mdn 24 24 24 SD 1.85 5.09 5.87 Occupation Student 98% 84% 83% Employed 2% 15% 15% Unemployed 0% 1% 2% Social Relationship Quality (0–7) Range 2.25–7.00 2.63–7.00 2.00–7.00 M 5.51 5.62 5.95 Mdn 5.75 5.88 6.13 SD 1.00 .97 .87 Movie Rating (0–10) Range .0–10.0 .0–9.5 .0–9.5 M 5.18 4.67 6.74 Mdn 6.00 5.50 7.00 SD 2.69 2.63 2.00 Intention Toward Recommender Usage (0–7) Range N.A. N.A. 1.0–7.0 M N.A. N.A. 4.67 Mdn N.A. N.A. 5.00 SD N.A. N.A. 1.52 Reactance (0–7) Range .5–7.0 N.A. N.A. M 3.86 N.A. N.A. Mdn 3.75 N.A. N.A. SD 1.37 N.A. N.A. Notes: N.A. = not applicable.
Group Recommender Condition (Experiments 1 and 2)
(a) Log in (b) Exclude already seen movies (c) Weight I (without visible movie ratings) (d) Weight II (with visible movies ratings) (e) Choose movie with group recommendations (f) Confirmation of chosen movie
94 / Journal of Marketing, September 2012
123
76 (62%) 47 (38%) 18–57 25.96 24 6.68 72% 27% 1%
2.61–7.00 5.84 6.06 .87 .0–10.0 6.37 7.00 2.30 N.A. N.A. N.A. N.A. N.A. N.A. N.A. N.A.
and science fiction). The selection of available movie titles resembled a consumer’s choice set of theatrical movies in a medium-sized city. Most titles were recent theatrical releases, though one or two movies per genre were classic or independent/art house titles. We intentionally excluded “blockbuster” titles because the experiment excluded from consideration any movies that a group member had seen previously, so blockbusters likely would have reduced the number of available alternatives. When arriving at the lab, each agent was assigned randomly to one of two experimental conditions, group recommender or single recommender, which we describe in detail in the next section. The agents indicated which of the 24 movies they had seen or were certain that their partners had seen; these movies, as well as those that the agent or partner already had rated on the recommender site, were automatically eliminated from the list to avoid bias from previous consumption experiences. The partner was not involved in the decision making, and no communication between agent and partner was possible during the choice process. The agents then made a choice based on the individualized results of the group recommender or single recommender, respectively. In both conditions, they had to choose one of the three movies with the highest recommendation (restricted choice). After having selected a movie, the agents completed a questionnaire about their film preferences, the movie selection process undergone during the experiment, and additional details about themselves and their partners. To account for potential effects of reactance as a reaction to the restricted choice design, the questionnaire also included a measure of the agent’s reactance to the restricted choice. The reactance construct then served as a covariate in the analysis to ensure that value differences resulted not from the choice restriction but from the experimental manipulation. After finishing the questionnaire, the agents received a DVD of the selected movie, which they watched with their partners at a place of their choice. After the joint movie consumption act, both the agent and the partner completed an online questionnaire that asked them how much they liked the movie the agent had selected (i.e., agent value and partner value, from which we calculated group value). Experimental conditions. Table 2 details the different steps for the participants in both experimental conditions. In the single recommender condition, the agent was provided
TABLE 2 Experimental Process Steps
Single Recommender Condition (Experiments 1 and 2)
(a) Log in (b) Exclude already seen movies (c) Visible single recommendations (d) Choose movie with single recommendations (e) Confirmation of chosen movie
No Recommender Condition (Experiment 2)
(a) Log in (b) Exclude already seen movies (c) Choose movie without any recommendations (d) Confirmation of chosen movie
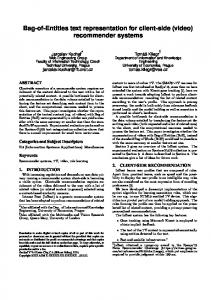
with the German title, country of origin, main genre, and a mini-poster for each available movie in a closed-beta environment of the recommender site. By clicking on a title or mini-poster, the agent gained access to additional information for each title, such as a larger movie poster; the original movie title; a plot summary; a listing of the main actors, director, and writer(s); and the movie’s run time. In addition, the agent obtained three ratings for each film: the average movie rating of all members from the recommender site, the average movie rating from professional movie critics on the site, and the agent’s personalized movie rating predictions, generated on the basis of his or her previous ratings of other movies on the site (Figure 2). To calculate the personalized movie rating predictions, this experiment used a memory-based collaborative userfiltering method, which measured preference similarity between users according to Euclidean distances: (1)
d ( A, U ) =
n
∑(a − u ) , i=1
i
i
2
where ai and ui are ratings by the agent A (i.e., consumer who receives the recommendation) and user U (i.e., provider of ratings for deriving the recommendation for A) for all movies I rated by both A and U. When calculating recommendations for A, all users U who rated at least 10% of the movies A had rated and exhibited a preference similarity d(A, U) of less than .70 represented “neighbors.” The prediction equaled the unweighted mean value of all ratings by “neighbors” for a movie i. The movies presented to the agent appeared in descending order, according to the personalized rating predictions.
To limit the impact of other factors that might influence consumers’ choices in reality (e.g., mood), agents had to select one of the three movies that received the highest predicted ratings. This restricted choice design relates conceptually to adaptive personalization systems, in which users view only those products selected by a recommender algorithm (which then uses the time a product is consumed as a proxy for its utility; Chung, Rust, and Wedel 2009). However, we did not force the agent to select the single top recommended title because this might have produced artificial results (e.g., nonromantic friends being forced to watch a romantic movie together). We admit that the focus on internal validity might come at the cost of reduced external validity because, in reality, consumers almost always choose freely whether to follow a recommendation or select a different movie. We addressed this concern with our second experiment, which focuses on external validity. In the group recommender condition, we processed the movie ratings provided by both the agent and the partner, before the choice situation. In another specific closed-beta environment on the recommender site, the agent determined his or her preference weights for both group members to calculate a group recommendation. Specifically, he or she assigned a weight on two slider bars (one for him- or herself and one for the partner) that ranged from 0% to 100%. The sliders were interdependent; the sum of the two values always equaled 100.3
3Forty percent of the agents in the first experiment (and 54% in the second experiment) did not change the standard setting of weights (i.e., from 50–50).
FIGURE 2 Screenshot for Movie Choice in Single Recommender Condition
Notes: In the original display, the language was German. For better readability, we changed it to English in this figure.
Automated Group Recommender Systems / 95
The agent then studied the list of available titles, which contained the same information provided in the single recommender condition: cast, crew, content, value prediction for the agent (calculated with collaborative user filtering, as in the single recommender condition), average viewer rating, and average critic rating. In this condition, the agent also received a value prediction for the partner (calculated from the partner’s ratings with the same method used for the agent) and a group value prediction, which was calculated as the mean of the agent and partner value predictions, weighted with the respective preference weights (Figure 3). Finally, the agent selected a movie from the list; as in the single recommender condition, his or her choice was restricted to one of the three movies with the highest predicted group value. Model and measures. Group value served as the dependent variable for most analyses. There is no single, “natural” way to derive a group’s joint value from group members’ individual value perceptions, so we followed extant research and used the unweighted mean of agent value and partner value as our measure of group value. Masthoff (2004) confirms that average strategies are most common for small groups such as dyads.4 We measured agent and partner 4We also obtained evidence of the adequacy of this operationalization from regressions that we ran using alternative measures of group value (e.g., minimum value, mean value with standard deviation correction). Although the results remained stable, the variance explanation was highest for both experiments when we used the mean of agent value and partner value as our measure of group value.
value on a scale that ranged from 0 (“very bad”) to 10 (“excellent”) in half-point steps. A similar scale appears on several popular online movie sites (e.g., the Internet Movie Database), including the site we used for this study. Both group members provided this rating after watching the film. As independent variables, Experiment 1 included the group dummy and the reactance control. To measure reactance, we used four items from Deci et al. (1994), Hong and Faedda (1996), and Unger and Kernan (1983), which we report in Appendix A.
Results. In H1, we propose that group recommenders offer higher group value than single recommenders. Because the group variable is categorical and the reactance covariate is metric, we used an analysis of covariance to test this proposition. When we compared the group value in the group versus single recommender conditions, we found a significant difference for group value (xGroup = 5.55, xSingle = 4.33; F(1, 105) = 7.21, p < .01, 2 = .07), in support of H1c. Consistent with our theoretical arguments for H1a, this effect was mainly based on the partner’s value perceptions (whose preferences were not taken into account by the single recommender system). The partner’s value perception differed significantly between the group and single recommender conditions (xGroup = 5.47, xSingle = 3.92; F(1, 105) = 10.09, p < .01, 2 = .09). However, whereas H1b predicted that the agent’s value perception would be lower for group recommenders, we found that it differed only slightly and that the direction of the effect even ran counter to our expectations. Agent value tended to be higher in the group recommender condition, after he or she took the partner’s preferences into account (xGroup = 5.64, xSingle = 4.75; F(1, 105) = 2.99, p =
FIGURE 3 Screenshot for Movie Choice in Group Recommender Condition
Notes: In the original display, the language was German. For better readability, we changed it to English in this figure.
96 / Journal of Marketing, September 2012
Experiment 2: Free Choice
quality and his or her intentions to use recommenders in the future. In the no recommender condition, the agent received the title, country of origin, main genre, and a mini-poster for each movie, as well as the enhanced information if he or she clicked on the title or poster, and had to make his or her choice solely on the basis of this information, with no access to other websites or consumer opinions during the selection process. In this condition, the movies appeared in random order (Figure 4).
5Specifically, a median split analysis produced the following results: low reactance sample = xGroup = 5.53, xAgent = 5.90, and xPartner = 5.17; high reactance sample = xGroup = 4.50, xSingle = 4.68, and xPartner = 4.33.
Models and measures. In line with our theoretical arguments, we ran three kinds of analyses: an analysis of variance in which we compared value perceptions between the group and no recommenders (to test H2) and two sets of regressions in which we tested H3 and H4. In the first regression, we compared the group and single recommender conditions by regressing group value (plus agent value and partner value in additional estimations) on the group recommender dummy, social relationship quality, and the social relationship quality ¥ group recommender interaction term. In the second regression, comparing the group
.08, 2 = .03). We speculate that group members who consumed the product jointly influenced each other’s perceptions and value assessments. As an aside, we note that the covariate of reactance was significant at p < .05 for the agent (F = 4.03, 2 = .04), the partner (F = 4.07, 2 = .04), and the group (F = 4.98, 2 = .05), with higher reactance associated with lower value perceptions.5 Method and experimental conditions. In terms of context and design, the second experiment largely replicated the first but offered a few key differences. Most important, the agent could choose freely among available movies, in contrast with the restricted choice in the first experiment. Although this free choice design introduced noise—because agents were influenced by not only the recommendations but also their idiosyncratic characteristics—it enabled us to test H2–H4. Furthermore, this second experiment included the proposed moderator variables and a no recommender condition. The group and single recommender conditions remained the same as in the restricted choice experiment. The questionnaires varied just slightly: The pre-viewing survey excluded the reactance items (because the agent could chose freely this time) but included measures of the moderators, namely, the agent’s perception of social relationship
Sample. The registration process was the same as in the first experiment, and the roles of agent and partner were again randomly assigned within each registered dyad. Participants included students from a different public German university than that in the first experiment. The 246 participants (123 dyads) were randomly assigned to one of the three experimental conditions: 37 dyads took part in the no recommender condition, 43 took part in the group recommender, and 43 took part in the single recommender condition. Table 1 provides descriptive information about this sample.
FIGURE 4 Screenshot for Movie Choice in Group Recommender Condition
Notes: In the original display, the language was German. For better readability, we changed it to English in this figure.
Automated Group Recommender Systems / 97
and no recommender conditions, we regressed the same dependent variables on the agent’s intention to use recommenders and an intention to use ¥ group recommender interaction term, in addition to the independent variables. Formally, the models are as follows: (2)
(3)
GV = 0 + 1GR + 2SRQ + 3SRQ ¥ GR + , and GV = 0 + 1GR + 2SRQ + 3SRQ ¥ GR + 4IN + 5IN ¥ GR +
where GV is group value, GR is the group recommender condition (vs. the single recommender condition in Equation 2; vs. the no recommender condition in Equation 3), SRQ is the agent’s perception of social relationship quality, and IN is the agent’s intention to use automated recommenders in the future. Our operationalizations of agent value, partner value, and group value matched those from Experiment 1. We used eight items to measure the three dimensions of social relationship quality; specifically, we measured relational liking with three items from Wayne and Ferris (1990) and Liden, Wayne, and Stilwell (1993); perceived relational similarity with three items from the same authors; and perceived relational closeness with two items from Aron, Aron, and Smollan (1992). In the regressions, we used a composite measure of social relationship quality that reflected its three-dimensional character. Specifically, we first calculated the mean of the items for liking, similarity, and closeness, respectively, and then determined the overall mean value of the three dimensions. Finally, the measure of the agent’s intention to use a recommender was an item from Maheswaran and Meyers-Levy’s (1990) attitude-towardbehavior scale that captures a consumer’s conative attitude toward an object. To model the interaction effects, we adopted Lance’s (1988) residual centering approach to minimize potential multicollinearity, following Bottomley and Holden (2001) and Hennig-Thurau, Houston, and Heitjans (2009), among others. Residual centering is an effective and conservative test for interaction effects that assigns only the part of the variance that is not explained by the main effects to the interaction term. We report these items in Appendix A.
Reliability and validity. The Cronbach’s alpha values ranged between .84 and .91 for the three social relationship quality dimensions, which is satisfactory (e.g., Churchill 1979). A confirmatory factor analysis for the three social relationship quality dimensions model showed a good fit (normed fit index [NFI] = .96, confirmatory fit index [CFI] = .98, and root mean square error of approximation [RMSEA] = .07) and was superior to a competing one-factor social relationship quality model (NFI = .60, CFI = .61, and RMSEA = .32). Similarly, Fletcher, Simpson, and Thomas (2000) show that the best-fitting model for social relationship quality is one in which the items load on first-order factors, which in turn load on a second-order factor that reflects overall social relationship quality. Results. We tested H2, which postulated that group recommender information would increase group value, with a 98 / Journal of Marketing, September 2012
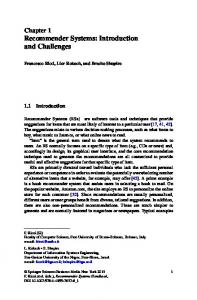
one-way analysis of variance that compared the group and no recommender conditions. Contrary to our expectations, group value for the no recommender condition was not significantly different from that in the group recommender condition, and the average group value was even slightly higher (xGroup = 6.55, xNo = 6.70; F(1, 78) = .11, p > .10). The same finding applied to both agent value (xGroup = 6.64, xNo = 6.96; F(1, 78) = .47, p > .10) and partner value (xGroup = 6.47, xNo = 6.45; F(1, 78) = .00, p > .10). In other words, the additional information provided by group recommenders did not increase the quality of the agent’s choices on average. Thus, we reject H2. We next estimated Equations 1 and 2 using ordinary least squares regression (for results, see Table 3).6 In the first regression model, we compared the group recommender condition with the single recommender condition. The R-square values were .17 for the group, .15 for the agent, and .14 for the partner. The effect of the social relationship quality ¥ group recommender interaction term was positive and significant (p < .01) for group value, as well as for the individual values of the agent (p < .01) and the partner (p < .01), in full support of H3. To gain a deeper understanding of this interaction and the underlying processes, we examined the slopes of the recommender conditions for high and low levels of social relationship quality, an approach that Fitzsimmons (2008) refers to as “spotlight analysis” (because it turns a “spotlight” on particular regions of interest). Specifically, this analysis involves shifting the mean level of the moderator variable up and down by “one or more standard deviations” (Fitzsimmons 2008, p. 7) and then conducting significance tests for an individual slope, without making any arbitrary dichotomous assignments, as occurs for a median split (see also Aiken and West 1991). We conducted this spotlight analysis at one and two standard deviations in all cases. In Figure 5, we present the slope plot of the interaction (one standard deviation above and below the mean). Table 4 contains the detailed results. As Figure 5 shows, the slope plot supports our theoretical arguments: The group recommender led to more group value than the single recommender when the quality of the social relationship was high than when it was low. The spotlight analysis shows that this increase of value in the high relationship quality constellation is significant for both the agent and the partner at p < .05 at one standard deviation. The slopes also show that in the low relationship quality constellation, dissatisfaction with the compromise the group
6The free choice design of this experiment meant that in the recommender conditions, some participants did not choose the top recommended alternative. The choice to ignore (or follow) recommendations is a continuous one because participants received a rank-ordered list of recommended titles, so every participant’s choice should have been influenced by the recommendations. Limiting the sample to choices of the top one or top three recommended films would be somewhat arbitrary, and it would reduce the sample size and model power. Furthermore, when we reran our regressions for different subsets, the results were consistent with our full sample results; the R-square value generally increased somewhat, while the significance levels decreased due to the smaller sample size.
TABLE 3 Regression Results
Group Recommender Versus Single Recommender
Regressor
Automated Group Recommender Systems / 99
Constant GR SRQ SRQ ¥ GR IN IN ¥ GR R2 R2 adjusted
B
Group Value
3.290 .151 .526 1.600 N.A. N.A. .170 .139
Beta
t (p)
.038 .37 .229 2.28 * .341 3.39 **
B
Agent Value
4.125 .023 .421 1.705 N.A. N.A. .147 .116
Beta
t (p)
.005 .05 .173 1.69 .342 3.35**
Partner Value
B
2.457 .279 .630 1.495 N.A. N.A. .140 .108
Beta
t (p)
.061 .60 .242 2.36* .280 2.74**
Group Recommender Versus No Recommender
B
Group Value Beta
t (p)
2.518 –.086 –.021 –.20 .580 .259 2.45* 1.051 .230 2.18* .155 .118 1.21 .561 .213 2.02* .218 .165
*p < .05. **p < .01. Notes: N.A. = not available. GR = group recommender, SRQ = social relationship quality, and IN = intention toward recommender usage.
B
Agent Value Beta
t (p)
2.744 –.236 –.057 –.55 .516 .229 2.15 * 1.033 .225 2.11 * .243 .185 1.73 .440 .167 1.56 .206 .152
Partner Value
B
2.292 .063 .644 1.068 .067 .681 .186 .131
Beta
t (p)
.013 .13 .251 2.33* .204 1.89 .045 .41 .226 2.10*
5 5 55 88 8 8 Agent Value
77 7 7 Age en ntt Ag Agent Ag Valleu une et Va Value Value 66 6 6 55 5 5 8 8 8 8
SRQ low SR Q llo ow w SR7Q SR Q SR6.83 SRQ Q low low Q llo ow w SR76.83 6.83 76.83 6.83 6.83 Group G ro G roluu uep p Va Va l u Value e 6 6Q higSR SR6 h Q high SR Q higSR h Q SRQ Qh hiig gh h Q high higSR h 6.05 SR 6.05 6.05 6.05 6.05 6.05
SRQ Qh hiig gSR h Q high SR h SR Qh hiig gh h Q SRQ high SR Qh igSR h 7.60 7.60 7.60 7 7.60 7 7.60 7.60 7 G rou up p Gro G rouep Va Vallu ue Value 6 6 6 SR Q l o w SR Q l o w SRQ low SRQ Q llo ow w SRQ SR SR5.57 Q low low 5.57 5.57 5.57 5.57 5.57
5 5 5 5 5 5 r co mme n d e r n g l e R e n g l e R e co mme G n ro d u e p R G e ro co u mme p R e n d e Si Si co mme n d e r r ngle R en co mme nco demme r Group Gn roduepr R ero coumme nco demme r nder Si g l e R e G p R e Si Recommender Single Recommender en co gmme le Renco demme r Gn roduepr RGero coumme p Renco demme r nder Single RSi 8 8 8 SR llo SRQ low SRQ SRQ Q low ow w SR Q SR7.19 Q low SR7.19 Q llo ow w 7.19 7.19 77.19 7.19 7 7 Agent Age ent Ag Valunet Va l ue e Valu 6 SR Q high hiig gSR h Q high 6Q SRQ SR h h 6 SR Qh hiig gh h SR6.12 Q higSR h Q 6.12 6.12 6.12 6.12 6.12
8 8 8 SR h high SRQ high SRQ Qh hiig gSR h Q SR7.63 Q higSR SR h Q Qh hiig gh h 7.63 7.63 7.63 7 7.63 7.63 7 7 Ag e n Agentt Ag enet Va Vallu ue Value 6 SRQ low 6 SRQ Q llow lo ow w 6 SR SRQ SR Q l o w SR5.71 Q low SR5.71 Q low 5.71 5.71 5.71 5.71
5 5 5 5 5 5 co mme n d e n g l e R e co mme n d e G ro co u mme p R e n d e r r Si n g l e R e G ro u p R e Si co mme n d e r r Single Recommender Group Recommender coumme nco demme Single RSi en co mme nco demme r Gn roduepr RGero r nder g l e R e p R e gmme le Renco coumme p Renco demme en roduepr RGero Single RSi co demme r Gn r nder 8 8 8
8 8 8
SR Qh hiig gSR h Q high SRQ h Q h Q high hiig gh h SR7.51 SRQ SR Q higSR h 7.51 7.51 7.51 7.51 7.51
SRQ low SRQ Q llo ow w SR SR Q llo SRQ SR5.67 Q low ow w SR5.67 Q low 5.67 5.67 5.67 5.67
5 5 55 ecoNmme ndro eu rpR der e co mme p Ren N o o Ren nco de emme nco de emme mme d rr G d rr nd G ro u RG ero cou mme No R RecoNo e n e rr p p e o Recommender Group Recommender nde err enco co mme nd dro eu p RG G ero ro cou umme pR R enco co mme demme r G demme r n No RecoN Nmme oR R 88 8 8
SR SRQ low Q llo ow w SRQ SRQ Q llo SR Q l o w Q low ow w SR 7.02 7.02 777.02 SR7.02 7 7.02 7.02 7 AgeSR nt Q higSR h Q high Q higSR h Ag eSR n Agent SRQ high Qh h gh h Ag nett 6.84 ValeuSR Q iig Q higSR h 6.84 6.84 6.84 Va l u e Value Value 6.84 6.84 66 6 6
SR Qh hiig gSR h Q high h SRQ SRQ Q high iig Qh h gh h Q higSR h 7.55 SR7.55 SR 7.55 7.55 7.55 7.55
SRQ low SRQ Q llo ow w SR SRQ SR Q llo SR5.83 Q low ow w SR5.83 Q low 5.83 5.83 5.83 5.83
55 5 5 RecoN N o rp der oR en e co umme pR en ndro eu nco de emme mme nco de emme Recommender Group Recommender No R rr G d rr nd ecoNo G pR RG ero cou mme mme d o enco co mme nd dro eu p No RecoN rr p RG nde err Nmme oR Re ro u Gero ro coumme pR Re enco co mme r G demme r n n e demme 88 8 8
Partner Value
Partner Value
recommender suggested was not limited to the agent but also emerged from the partner, supporting the proposed existence of social influence and contagious effects within the group. The spotlight analysis provides evidence that the decrease in value in the low relationship quality constellation was significant at p < .05 for both the agent (at one standard deviation) and the partner (at two standard deviations). The comparison between group and single recommenders in the free choice context also revealed notable insights regarding the main effect of the group recommender variable. Although the group value for the group recommender condition was higher than that for the single 100 / Journal of Marketing, September 2012
SRQ low SR Q llo ow w SR 7 Q llo SRQ SRQ SR Q low ow w SR 77 Q low 7 6.72 Group G rou uSR p SR h high ro G Group Va luSR ep Q Qh hiig gSR h Q Q h Va l u e Q h i g SRQ h high SR Q hiig gh h SR 6.64 6.64 Va lue 6.64 6.64 Value 6 6.64 6.64 6 66
SR Q high SR h h SRQ SRQ Q high hiig gSR h Q hiig gh h Qh SR7.58 Q higSR h 7.58 7.58 7.58 77 7 7.58 7.58 7 SRQ high igh SR Qh hiig gSR h Qh 7 Q SR h 7 7 Qh hiig gh h SR Q SR Q higSR h 6.44 6.44 rt n e r Pa rt n e r Partner Pa Partner Partner6.44 6.44 rtlune r6.44 6.44 Pa rtne r Pa Va Value Vallu ue Va SRQ SRQ low low SR Q llo ow w e Value Va Vallu uSR e Q SRQ SR Q llo ow w SR Q low 6 6.43 6.43 6 6 6.43 6.43 6 6 6.43 6.43 6 6
7 7 7 7 7Q low SRQ low SRQ SR lo 7 7 SR Q ow w SRQ Q llo ow w n6.47 eQ r llo Partner Part rtn ne err Part SR w SR 6.47 Pa rt n e r Pa 6.47 6.47 rtlun6.47 r Pa rtlune r Pa Va e Value Va 6.47 Value Value Va Vallu ue e 6 6 6 6 6 6 6 SRQ SR h SR h igh SRQ Q high hiig gSR h Qh SRQ low SR llo SRQ SR5.99 Q higSR h Q Qh hiig gh h SRQ Q low ow w SRQ Q llo ow w 5.99 5.99 5.99 SR SR5.43 Q low 5.43 5.99 5.99 5.43 5.43 5.43 5.43 5 5 5 5 5 5 Single 5 Recommender Group Recommender 5 5 5 Si Si co mme n d e r co mme n d e r n g l e R e G ro u p R e n g l e R e G ro u p R e co mme n d e r co mme n d e r co mme nco demme r Gn coumme nco demme r nder Single RSi en roduepr RGero g l e R e p R e en gmme le Renco roduepr RGero p Renco Single RSi co demme r Gn coumme demme r nder
Notes: SRQ = social relationship quality.
8 88 8
Group Value
Group Value
7 7 77 G rou up p Gro G rouep Group Va Vallu ue Va lue Value 6 6 66
8 8 8
8 8 8
Agent Value
8 8 88
FIGURE 5 ¥ Slopes forGroup Social Relationship Quality Group Recommender Interaction 2) Gr vs. vvGroup Gr ss..oSingle Single Si upn vs. vllse Single Single Group Gr vs. v Group Gr s No N up o vs. vs(Experiment . No No Group Gro ou up p vs. Si ng gvs. e.. Single Group Gro ou up p vs. vGroup s..o No N o vs. Group Gr o u p v s Si n g l e Gr o u p v s . No N o Gr oup vs. vGroup Gr s.oSingle Si uSingle pngvs. vlse. Single Single Group GroupB:vs. vGroup Gr sGroup .oNo N up o vs. vsvs. . No NNo o A:Group Group vs.
high SRQ SRQ Qh hiig gSR h Q high h SR Qh hiig gh h SR Q SR7.48 Q higSR h 7.48 7.48 7.48 7.48 7.48
SRQ low low SRQ SRQ Q llo ow w SR SR Q SR5.50 Q llo ow w SR5.50 Q low 5.50 5.50 5.50 5.50
55 5 No Recommender Group Recommender 5 RecoN N o oR ndro eu rpR der co mme en pR en mme nco de emme nco de emme No RecoNmme G ro u RGe ero cou mme d rr G d rr nd o n e rr p p co mme nd dro eu nde err No RecoNmme oR Re enco p RG Gero ro cou umme pR Re enco co mme demme r G demme r n
recommender condition (xGroup = 6.55, xSingle = 6.43), the difference was smaller than in the restricted choice experiment and insignificant (F(1, 84) = .08, p > .10). The differences were not significant for any group member, though they tended to be higher for the partner. In other words, the main effect of group versus single recommenders, which was significant in the restricted choice context, was no longer significant when consumers could choose from a variety of options—that is, when we added external noise to the experimental design. In the free choice scenario, agents could correct dubious suggestions the recommender provided; using their own judgment, they proba-
TABLE 4 Results of Spotlight Analyses Setting and Slope
Automated Group Recommender Systems / 101
Group Versus Single Recommendation System Group and Single Recommendation System at High SRQ at Low SRQ SRQ at Group Recommendation System at Single Recommendation System Group Versus No Recommendation System Group and No Recommendation System at High SRQ at Low SRQ SRQ at Group Recommendation System at No Recommendation System Group and No Recommendation System at High IN at Low IN IN at Group Recommendation System at No Recommendation System
†Significant (p < .05) for two standard deviations. ††Significant (p < .05) for one and two standard deviations.
t(1SD) 2.69 –2.18 3.90 –1.21 1.66 –2.08 3.79 –.27
1.62 –1.92 2.88 –.60
Group Value
t(2SD) Significance
t(1SD)
3.21 –2.89
2.43 –2.38
3.90 –1.21 2.23 –2.48 3.79 –.27
2.14 –2.33 2.88 –.60
†† †† ††
n.s. † †† ††
n.s. † †
††
n.s.
3.42 –1.55
1.25 –2.21
3.54 –.22
1.07 –1.84
2.94 .10
Agent Value
t(2SD) Significance
t(1SD)
3.04 –3.00
2.38 –1.55
3.42 –1.55
1.88 –2.48
3.54 –.22
1.60 –2.08
2.94 .10
†† †† ††
n.s. n.s. †† ††
n.s.
n.s. †
††
n.s.
3.56 –.65
1.78 –1.65
3.44 –.27
1.87 –1.72
2.42 –1.13
Partner Value
t(2SD) Significance 2.73 –2.20
3.56 –.65
2.20 –2.11
†† † ††
n.s. † †
3.44 –.27
n.s.
2.42 –1.13
n.s.
2.31 –2.22
†† † †
††
Notes: n.s. = not significant. SRQ = social relationship quality, IN = intention toward recommender usage. The t-values are equal for slopes at group recommendation system and single/no recommendation system because these are dichotomous and thus SD-independent variables.
102 / Journal of Marketing, September 2012
FIGURE 6 Slopes for Intention to Use ¥ Group 8 Recommender Interaction (Experiment 2) 8 88 Group Value
7 7 Group 7 7 Va G roluuep Va G Group roluuep 6 Va lue Value 6 66 5 5 55 8 88 8
Agent Value
7 77 Agent 7 Valeunet Agent Ag Value Va leunet Ag 6 Value 6 6 6 5 55 5
88 8 8
77 7 Partner Partner 7 Vartlune r Value Pa Vartlune r6 Pa 6 Value 6 6
Partner Value
bly overruled poor suggestions that single recommenders provided. Consistent with this argument, the number of participants who followed recommendations was higher in the group recommender condition than in the single recommender condition. Specifically, 23% of the participants chose the top recommendation the group recommender offered, compared with 12% in the single recommender condition. The results were similar for the top three (group: 49%, single: 40%), top five (group: 70%, single: 58%), and top seven (group: 79%, single: 60%) recommendations. In the second regression model, we compared the group recommender condition with the no recommender condition, in which agents made choices solely on the basis of their own knowledge about the partner. We found R-square values of .22 for the group, .21 for the agent, and .19 for the partner. As in the first regression, the effect of the social relationship quality ¥ group recommender interaction was positive and significant for group value (p < .05) and for the agent (p < .05); however, it only approached statistical significance for the partner (p = .06). In general, the spotlight analysis revealed the same pattern for the group versus no recommender than for the group versus single recommender comparison. The value increase related to group recommenders for high social relationship quality was significant at p < .05 for both the group and the partner at two standard deviations (but did not reach significance for the agent). The decrease in value through group recommenders for low social relationship quality was significant for the group and the agent at one standard deviation and for the partner at two standard deviations. The slope graphs, reported in Figure 5, point to one difference between the comparisons (which is reflected in somewhat higher betas for the group versus single comparison): Value perception in the high social relationship quality constellation is lower for single than for no recommenders. This lower value perception might be attributed to the agents’ dissatisfaction with the single recommender’s choice, which ignored their close partners’ preferences when relationship quality was high; they were less concerned if their social relationship had lower quality. In H4, we propose that the impact of group recommender information on group value would vary with the agent’s intention to use recommenders. Consistent with our expectations, the interaction effect of intention toward recommender usage and group recommender was positive and significant for group value (p < .05), in support of H4. The interaction effect of intention to use recommenders was stronger for the partner (significant at p < .05) than for the agent (not significant). Perhaps when making choices in the no recommender condition, the agent could compensate on average for the value potential of the group recommender by choosing a film that met his or her own preferences. We also noted a direct effect of intention for the agent but not for the partner. In Figure 6, we plot the slopes for this interaction. We again conducted a spotlight analysis. Table 4 presents the significance tests for the intention to use recommenders variable. The slopes for intention to use recommenders illustrate that the partner derived higher value from the chosen movie
55 5 5
Intention low Intention 6.91 low Intention 6.91 low Intention 6.91 high Intention 6.53 high Intention 6.53 high 6.53
No Recommender No Recommender No Recommender ecommender N oR Intention high Intention 6.99 high Intention 6.99 high Intention 6.99 low Intention 6.92 low Intention 6.92 low 6.92
No Recommender No Recommender N oR ecommender No Recommender
Intention low Intention 6.88 low Intention 6.88 low 6.88 Intention high Intention 6.08 high Intention 6.08 high 6.08
No Recommender ecommender N oR No Recommender No Recommender
Intention high Intention 7.56 high Intention 7.56 high 7.56
Intention low Intention 5.69 low Intention 5.69 low 5.69 Group Recommender Group Recommender Group Recommender G roup R ecommender Intention high Intention 7.67 high Intention 7.67 high 7.67
Intention low Intention 5.75 low Intention 5.75 low 5.75 Group Recommender Group Recommender G roup R ecommender Group Recommender Intention high Intention 7.44 high Intention 7.44 high 7.44
Intention low Intention 5.62 low Intention 5.62 low 5.62 Group Recommender Group Recommender Group Recommender Group Recommender
in the group recommender condition than in the no recommender condition when the agent held a positive attitude (i.e., high usage intention) toward the recommender system; the difference was significant at two standard deviations. The agent makes use of the value potential provided by the recommender, as a result of his or her positive attitude toward recommenders. In contrast, when the agent had no intention to use a recommender, the agent and partner both derived less value from the movie that had been chosen in
accordance with the provided recommendations; both effects were significant at two standard deviations. The lower partner value likely resulted from the agent’s decision, which excluded the group value potential provided by the group recommender. The lower value for the agent might reflect a combination of distraction due to group recommendations during the choice process and rejection of the movies suggested by the recommender, such that the agent had to provide low ratings to achieve a sense of consistency. Finally, the regression results shed new light on H2. The proposed positive effect of group recommenders on group value, though not relevant in all situations, emerged in situations in which agents were characterized by their positive attitude toward recommenders. In other words, our rejection of a general effect of group recommenders can be attributed primarily to agents who do not think highly of automated recommenders and in practice would hardly use them. Post hoc analysis of social relationship quality effects. Because social relationship quality is a multidimensional construct, we also investigated how its dimensions (i.e., relational liking, perceived relational closeness, and perceived relational similarity) contributed to its moderating effect. Specifically, we reanalyzed the regression models, each time substituting the composite measure of social relationship quality with one of its dimensions. As Table 5 shows, the interaction effect was strongest for the liking dimension (p < .01 for group, agent, and partner values) in the comparison of group and single recommenders. Although liking was the only dimension that also affected group value directly, the moderation was not limited to liking; the group recommender ¥ social relationship quality interaction also was significant for relational closeness and perceived similarity. The results differed in the group and no recommender comparison, for which none of the dimensions was significant when studied in isolation. Thus, without the compromise effect of single recommenders, we conclude it is the combination of the social relationship quality dimensions, rather than its individual dimensions, that accounts for the moderation effect.
Discussion and Implications
Key Intellectual Insights
This research presents the first empirical investigation of the power of automated group recommenders. In two laboratory experiments in which consumer dyads actually watched movies they had selected in different conditions (group, single, and no recommender), we found that group recommenders provided substantially higher group value than standard single recommenders when agents had to follow a recommender’s selections. Although this effect disappeared when agents could choose freely among a set of movies (i.e., with noise), group recommenders still outperformed single recommenders when the social relationship quality between the agent and other group members was high. Agent value was not lower for group recommenders despite the compromise required from the agent; the effect was evidently compensated for by the gratification of pleasing a viewing partner.
Group recommenders also generated higher group value than a constellation in which the agent lacked access to a recommender system, assuming the agent held a positive attitude toward the use of automated recommender systems in the future. Managerial Implications
Our findings have substantial managerial relevance, considering that virtually every major commercial recommender focuses on the generation of recommendations for individual consumers, without addressing the prominent role of group consumption in hedonic settings. Our findings provide evidence that group recommenders can increase group value; therefore, retailers and recommender sites should consider offering them. Their effectiveness is particularly high for certain constellations (e.g., high social relationship quality, agents with positive attitudes toward the use of recommenders), and companies should promote such services among these segments in particular. A major question for recommender providers is be how to offer value-maximizing information for each consumer segment. Figure 7 provides a decision tree model that can guide managers in offering (group) recommenders, while accounting for contextual factors. For consumers who value recommenders in general, distinguishing between group and individual consumption situations is crucial; such information might be collected with a “Plan to watch with others?” button. Not all group members will be users of the system, an issue that highlights the potential lack of availability of user preference information. Offering group members who are not registered users of the system an easy means to reveal their preferences would increase the number of situations in which group recommenders could be applied. Our findings also imply the need to consider social relationship quality when offering recommendations for group consumption. Users might be asked to provide that information, or it could be estimated using information stored in a database. Groups with high social relationship quality (and those that do not provide sufficient information about social relationship quality) should receive the standard group recommender used herein (or an advanced version); those with lower social relationship quality instead might access a recommender that provides predictions for all group members separately and ranks recommended movies according to the agent’s preferences, without an aggregated group value prediction (the “alternative group recommender” in Figure 7). Research Implications and Limitations
Our research draws a fine-grained picture of group recommenders’ effects on consumers who jointly consume a hedonic product. Among the most important insights is the crucial role of a group’s social relationship quality, which moderates the effectiveness of group recommenders. Group recommenders provide particularly high group value to groups characterized by a high level of social relationship quality. Although the concept of social relationship quality has been studied closely in social psychology, it rarely has Automated Group Recommender Systems / 103
104 / Journal of Marketing, September 2012
TABLE 5 Regression Results for Social Relationship Quality Dimensions
Group Recommender Versus Single Recommender
Regressor
Constant GR X X ¥ GR IN IN ¥ GR R2 R2 adjusted
GV
X = Liking AV
PV
1.969 2.700 1.241 .075 –.042 .191 .680** .601** .758** 1.480**1.644**1.315** N.A. N.A. N.A. N.A. N.A. N.A. .235 .213 .184 .207 .184 .155
X = Closeness
GV
5.089 .170 .230 .809* N.A. N.A. .092 .059
AV
PV
6.096 4.080 .0195 .321 .093 .367* .730* .887* N.A. N.A. N.A. N.A. .053 .111 .018 .079
X = Similarity
GV
5.643 .133 .144 .907* N.A. N.A. .065 .030
AV
5.776 .012 .158 .970* N.A. N.A. .065 .031
PV
5.510 .254 .130 .843 N.A. N.A. .045 .010
Group Recommender Versus No Recommender
GV
X = Liking AV
PV
–.605 –.315 –.896 –.093 –.241 .054 1.028** .958**1.098** .641 .879 .403 .097 .189 .004 .555* .410 .699* .295 .285 .245 .247 .236 .194
X = Closeness
GV
4.088 –.017 .306 .470 .171 .621* .158 .101
AV
PV
4.614 3.561 –.197 .163 .181 .431* .324 .615 .272 .071 .526 .715* .129 .165 .070 .108
X = Similarity
GV
5.031 –.107 .121 .633 .220 .647* .144 .086
AV
4.771 –.260 .151 .648 .296* .524 .153 .095
PV
5.292 .046 .090 .619 .144 .771* .114 .054
*p < .05. **p < .01. Notes: All values are unstandardized regression coefficients. N.A. = not available. GV = group value, AV = agent value, PV = partner value, GR = group recommender, and IN = intention toward recommender usage.
FIGURE 7 Decision Tree Model for Recommender Systems
Intention to use recommender?
No
No recommender
No
Single recommender
Yes
Group consumption?
Yes
No
Name group members and determine social relationship quality
Not all group members in database
All group members in database
Add missing group members to database and determine social relationship quality Yes
Social relationship quality
High Group recommender (focus on a compromise)
Low Alternative group recommender (focus on agent value)
been considered in marketing research that aims to understand group consumption decisions. Furthermore, limited research has investigated the extent to which automated recommenders increase consumers’ decision making in general (Steckel et al. 2005). Our findings contribute to this exciting field by providing a comparison of group recommenders with single recommenders and with no recommender information. The group recommender we used in this study did not improve decisions in all conditions; the same finding applied to the single recommender. Instead, we identified certain conditions in which group recommenders contribute value. In addition to groups with high social relationship quality, agents with positive attitudes toward automated recommenders (and the groups to which they belong) benefit significantly from their use. Although the somewhat limited effect of recommenders might seem surprising, it is consistent with the findings of the only other study that has compared recommender-based
decisions with human decisions (Krishnan et al. 2008). To rule out potential confounding effects due to the specific recommender system we used, we performed a series of comparison tests with recommender algorithms that have been established in theory and practice (e.g., Adomavicius and Tuzhilin 2005; Das et al. 2007; Jannach et al. 2011). Specifically, we compared the prediction accuracy of our algorithm with two user-to-user k-nearest neighbor (kNN) collaborative filtering algorithms, two item-to-item kNN collaborative filtering algorithms (k = 50), and two matrix factorization approaches (f = 300) (Funk 2006; Koren, Bell, and Volinsky 2009) using approximately 1.1 million ratings. As we detail in Appendix B, this performance comparison showed that although most other algorithms exhibit somewhat higher prediction accuracy, the differences were small. Because our recommender is attractive in practice (i.e., the site is one of the top five German movie sites) and the alternative algorithms were optimized according to our speAutomated Group Recommender Systems / 105
cific data set (whereas the original algorithm was used “as is,” without recalibrations to fit the sample), we conclude that the algorithm we used produces reasonable predictions that are comparable to state-of-the-art recommender techniques. Thus, our study results should not be attributed to the specific recommender used or the quality of its recommendations. Nevertheless, because algorithms and interface designs of recommenders invariably influence their effectiveness (Fleder and Hosanagar 2009; Herlocker et al. 2004), additional research should test other algorithms and interfaces. In addition, variations based on group decisionmaking research might feature alternatives to the mean value aggregation of group member preferences that we used. We study the use of recommenders in a specific context; consumers had to choose from a limited number of alternatives (i.e., 24 movies). Our intentional exclusion of blockbuster titles might have increased prediction error because consumer perceptions of nonmainstream movies likely are more dispersed. Further research should test whether the results differ for other kinds of films and, more generally, for other products. Our model assumes that the recommender can generate recommendations for each group member. The decision tree model in Figure 7 highlights that this assumption is a limitation because, in practice, such availability is far from
Construct
Reactance
Liking Similarity
Closeness
Intention to use recommender systems
Scale items
guaranteed (Aribarg, Arora, and Kang 2010). Approaches to overcome this limitation might include (1) designing the preference generation process to offer high usability, particularly for consumers who are not “fans” of the product but have rather limited involvement in the category; (2) imputing preference data provided by the partner on other sites and networks, such as Facebook, though this approach, in addition to presenting technical issues, raises concerns about privacy and partners’ willingness to provide access to their data on other sites; and (3) asking agents to provide the required preference information about their partners by answering questions about their preferences for alternative products, which the system then would use to proxy for information directly provided by partners. The validity of such approaches remains unclear, and more research is needed to shed light on this important issue. Finally, we limit our empirical design to groups of two consumers (i.e., dyads), consistent with previous research on groups and the dominance of such groups in several hedonic industries. However, the complexity of decision making and preference modeling increases exponentially for larger groups, so it would be valuable to discover the extent to which the results hold for larger groups.
APPENDIX A Measures
1. I chose this movie because I wanted to. 2. I do not feel forced during the movie choice. 3. I become angry when my freedom of choice is restricted to three movies. 4. I become frustrated when I am unable to make free and independent movie decisions. 1. I like my movie-partner very much as a person. 2. I think my movie-partner is a good friend. 3. I get along well with my movie-partner. 1. My movie-partner and I are similar in terms of our outlook, perspective, and values. 2. My movie-partner and I see things in much the same way. 3. My movie-partner and I are alike in a number of areas. 1. My movie-partner and I are in a very close relationship. 2. Please circle the picture below which best describes your relationship.
1. Using automated recommender systems regularly could be very helpful.
Notes: N.A. = not applicable.
106 / Journal of Marketing, September 2012
Cronbach’s a Experiment 1/2
Adapted from
.733/N.A.
Deci et al. 1994; Hong and Faedda 1996; Unger and Kernan 1983
.834/.888
Liden, Wayne, and Stilwell 1993; Wayne and Ferris 1990
.909/.913
Liden, Wayne, and Stilwell 1993; Wayne and Ferris 1990
.819/.842
Aron, Aron, and Smollan 1992
N.A./N.A.
Maheswaran and Meyers-Levy 1990
Appendix B: Comparison of Predication Accuracy with Other Algorithms
A subset of the data employed in our study provided the input for the comparison tests. Of all users of the recommender site, we compared users who had at least 12 ratings left for training of the prediction model, after withholding
the 6 latest ratings for validation purposes. Therefore, the training set consisted of 1,140,577 ratings from 7,935 users given to 12,246 movies. From each user’s profile, we withheld the 6 latest ratings to form a holdout set, which we used to compare the prediction accuracy of the different algorithms. The holdout set used to calculate measures of prediction accuracy contained 47,610 ratings from the same users on 5,037 movies. Table B1 summarizes the results.
TABLE B1 Algorithm Performance Comparison
Algorithm
Algorithm used (user-to-user, Euclidian distance) User-to-user, Pearson User-to-user, cosine Item-to-item, Pearson Item-to-item, cosine Funk (2006) Koren, Bell, and Volinsky (2009) Average deviation
REFERENCES
Type
Mean Absolute Error
Compared with Study Algorithm
Collaborative filtering Collaborative filtering Collaborative filtering Collaborative filtering Matrix factorization Matrix factorization
16.921 17.373 16.807 17.214 16.951 16.769
–2.6% –.0% –3.3% –.9% –2.4% –3.6% –2.1%
Collaborative filtering
Adamowicz, Wiktor, Michel Hanemann, Joffre Swait, Reed Johnson, David Layton, Michel Regenwetter, et al. (2005), “Decision Strategy and Structure in Households: A ‘Groups’ Perspective,” Marketing Letters, 16 (3/4), 387–99. Adomavicius, Gediminas and Alexander Tuzhilin (2005), “Toward the Next Generation of Recommender Systems: A Survey of the State-of-the-Art and Possible Extensions,” IEEE Transactions on Knowledge and Data Engineering, 17 (6), 734–49. Aiken, Leona S. and Stephen G. West (1991), Multiple Regression: Testing and Interpreting Interactions. Newbury Park, CA: Sage Publications. Ansari, Asim, Skander Essegaier, and Rajeev Kohli (2000), “Internet Recommendation Systems,” Journal of Marketing Research, 37 (August), 363–75. Aribarg, Anocha, Neeraj Arora, and Moon Young Kang (2010), “Predicting Joint Choice Using Individual Data,” Marketing Science, 29 (1), 139–57. Aron, Arthur, Elaine N. Aron, and Danny Smollan (1992), “Inclusion of Other in the Self Scale and the Structure of Interpersonal Closeness,” Journal of Personality and Social Psychology, 63 (4), 596–612. Arora, Neeraj and Greg M. Allenby (1999), “Measuring the Influence of Individual Preference Structures in Group Decision Making,” Journal of Marketing Research, 36 (November), 476–87. Bagozzi, Richard P. (2000), “On the Concept of Intentional Social Action in Consumer Behavior,” Journal of Consumer Research, 27 (3), 388–96. Baier, Daniel and Eva Stüber (2010), “Acceptance of Recommendations to Buy in Online Retailing,” Journal of Retailing and Consumer Services, 17 (3), 173–80. Bodapati, Anand V. (2008), “Recommendation Systems with Purchase Data,” Journal of Marketing Research, 45 (February), 77–93. Bohlmann, Jonathan D., Jose Antonio Rosa, Ruth N. Bolton, and William J. Qualls (2006), “The Effect of Group Interactions on Satisfaction Judgments: Satisfaction Escalation,” Marketing Science, 25 (4), 301–321.
17.385
RMSE
22.866
22.158 22.551 22.174 22.521 22.139 21.111
Compared with Study Algorithm –3.0% –1.3% –3.0% –1.5% –3.1% –7.6% –3.2%
Bottomley, Paul A. and Stephen J.S. Holden (2001), “Do We Really Know How Consumers Evaluate Brand Extensions? Empirical Generalizations Based on Secondary Analysis of Eight Studies,” Journal of Marketing Research, 38 (November), 494–500. Brehm, Jack W. (1966), A Theory of Psychological Reactance. New York: Academic Press. Chao, Dennis L., Justin Balthrop, and Stephanie Forrest (2005), “Adaptive Radio: Achieving Consensus Using Negative Preferences,” in Proceedings of the 2005 International ACM SIGGROUP Conference on Supporting Group Work. New York: Association for Computing Machinery, 120–23. Chung, Tuck S., Roland T. Rust, and Michel Wedel (2009), “My Mobile Music: An Adaptive Personalization System for Digital Audio Players,” Marketing Science, 28 (1), 52–68. Churchill, Gilbert A., Jr. (1979), “Paradigm of for Developing Constructs,” Journal of Marketing Research, 16 (February), 64–73. Collins, Nancy L. and Stephen J. Read (1990), “Adult Attachment, Working Models, and Relationship Quality in Dating Couples,” Journal of Personality and Social Psychology, 58 (4), 644–63. Das, Abhinadan S., Mayur Datar, Ashutosh Garg, and Shuyam Rajaram (2007), “Google News Personalization: Scalable Online Collaborative Filtering,” in Proceedings of the 16th International Conference on World Wide Web. New York: Association for Computing Machinery, 271–80. Deci, Edward L., Haleh Eghrari, Brian C. Patrick, and Dean Leone (1994), “Facilitating Internalization: The Self-Determination Theory Perspective,” Journal of Personality, 62 (1), 119–42. De Vany, Arthur and W. David Walls (1999), “Uncertainty in the Movie Industry: Does Star Power Reduce the Terror of the Box Office,” Journal of Cultural Economics, 23 (4), 285–318. Epp, Amber M. and Linda L. Price (2008), “Family Identity: A Framework of Identity Interplay in Consumption Practices,” Journal of Consumer Research, 35 (1), 50–70. FFA (2011), “Der Kinobesucher 2010,” (April), (accessed May 11, 2011), [available at http://ffa.de/start/download.php?file= publikationen/kinobesucher_2010.pdf].
Automated Group Recommender Systems / 107
Fitzsimons, Gavan J. (2008), “Death to Dichotomizing,” Journal of Consumer Research, 35 (1), 5–8. ——— and Donald R. Lehmann (2004), “Reactance to Recommendations: When Unsolicited Advice Yields Contrary Responses,” Marketing Science, 23 (1), 82–94. Fleder, Daniel and Kartik Hosanagar (2009), “Blockbuster Culture’s Next Rise or Fall: The Impact of Recommender Systems on Sales Diversity,” Management Science, 55 (5), 697–712. Fletcher, Garth J.O., Jeffry A. Simpson, and Geoff Thomas (2000), “The Measurement of Perceived Relationship Quality Components: A Confirmatory Factor Analytic Approach,” Personality and Social Psychology Bulletin, 26 (3), 340–54. Funk, Simon (2006), “Netflix Update: Try This at Home,” The Evolution of Cybernetics, (accessed June 13, 2010), [available at http://sifter.org/~simon/journal/20061211.html]. Hatfield, Elaine, John T. Cacioppo, and Richard L. Rapson (1994), Emotional Contagion. Cambridge, UK: Cambridge University Press. Häubl, Gerald and Kyle B. Murray (2003), “Preference Construction and Persistence in Digital Marketplaces: The Role of Electronic Recommendation Agents,” Journal of Consumer Psychology, 13 (1/2), 75–91. ——— and Valerie Trifts (2000), “Consumer Decision Making in Online Shopping Environments: The Effects of Interactive Decision Aids,” Marketing Science, 19 (1), 4–21. Hennig-Thurau, Thorsten, Mark B. Houston, and Torsten Heitjans (2009), “Conceptualizing and Measuring the Monetary Value of Brand Extensions: The Case of Motion Pictures,” Journal of Marketing, 73 (November), 167–83. ———, Edward C. Malthouse, Christian Friege, Sonja Gensler, Lara Lobschat, Arvind Rangaswamy, et al. (2010), “The Impact of New Media on Customer Relationships,” Journal of Service Research, 13 (3), 311–30. Herlocker, Jonathan L., Joseph A. Konstan, Loren G. Terveen, and John T. Riedl (2004), “Evaluating Collaborative Filtering Recommender Systems,” ACM Transactions on Information Systems, 22 (1), 5–53. Hong, Sung-Mook and Salvatora Faedda (1996), “Refinement of the Hong Psychological Reactance Scale,” Educational and Psychological Measurement, 56 (1), 173–82. Hu, Rong and Pearl Pu (2009), “Acceptance Issues of PersonalityBased Recommender Systems,” in ACM Conference on Recommender Systems. New York: Association for Computing Machinery, 221–24. Jannach, Dietmar, Markus Zanker, Alexander Felfernig, and Gerhard Friedich (2011), Recommender Systems: An Introduction. New York: Cambridge University Press. Koren, Yehuda (2009), “Collaborative Filtering with Temporal Dynamics,” in Proceedings of the 15th ACM SIGKDD International Conference on Knowledge Discovery and Data Mining—KDD ’09. New York: Association for Computing Machinery, 447–56. ———, Robert Bell, and Chris Volinsky (2009), “Matrix Factorization Techniques for Recommender Systems,” Computer, 42 (8), 30–37. Krishnan, Vinod, Pradeep Kumar Narayanashetty, Mukesh Nathan, Richard T. Davies, and Joseph A. Konstan (2008), “Who Predicts Better? Results from an Online Study Comparing Humans and an Online Recommender System,” in ACM Conference on Recommender Systems. New York: Association for Computing Machinery, 211–18. Kurdek, Lawrence A. and J. Patrick Schmitt (1986), “Relationship Quality of Partners in Heterosexual Married, Heterosexual Cohabiting, and Gay and Lesbian Relationships,” Journal of Personality and Social Psychology, 51 (4), 711–20. Lance, Charles E. (1988), “Residual Centering, Exploratory and Confirmatory Moderator Analysis, and Decomposition of
108 / Journal of Marketing, September 2012
Effects in Path Models Containing Interactions,” Applied Psychological Measurement, 12 (2), 163–75. Lévy, Pierre (1997), Collective Intelligence: Mankind’s Emerging World in Cyberspace. New York: Plenum Press. Li, Ming, Benjamin Dias, Wael El-Deredy, and Paulo J. G. Lisboa (2007), “A Probabilistic Model for Item-Based Recommender Systems,” in Proceedings of the 2007 ACM Conference on Recommender Systems. New York: Association for Computing Machinery, 129–32. Liden, Robert C., Sandy J. Wayne, and Dean Stilwell (1993), “A Longitudinal Study on the Early Development of Leader– Member Exchanges,” Journal of Applied Psychology, 78 (4), 662–74. Liu, Duen-Ren, Chin-Hui Lai, and Wang-Jung Lee (2009), “A Hybrid of Sequential Rules and Collaborative Filtering for Product Recommendation,” Information Sciences, 179 (20), 3505–3519. Lohr, Steve (2009), “A $1 Million Research Bargain for Netflix, and Maybe a Model for Others,” The New York Times, (September 21), (accessed May 11, 2012), [available at http://www.nytimes. com/2009/09/22/technology/internet/22netflix.html?_r=1]. Maheswaran, Durairaj and Joan Meyers-Levy (1990), “The Influence of Message Framing and Issue Involvement,” Journal of Marketing Research, 27 (August), 361–67. Masthoff, Judith (2004), “Group Modeling: Selecting a Sequence of Television Items to Suit a Group of Viewers,” User Modeling and User Adapted Interaction, 14 (1), 37–85. McCarthy, Joseph F. and Theodore D. Anagnost (1998), “MusicFX: An Arbiter of Group Preferences for Computer Supported Collaborative Workouts,” in Proceedings of the ACM Conference on Computer Supported Cooperative Work. New York: Association for Computing Machinery, 363–72. McCarthy, Kevin, Lorraine McGinty, Barry Smyth, and Maria Salamó (2006), “Social Interaction in the CATS Group Recommender,” workshop presented at International Conference on Adaptive Hypermedia and Web-Based Systems: Workshop on Social Navigation and Community Based Adaptation Technologies, Dublin, Ireland (June). Norton, Robert (1983), “Measuring Marital Quality: A Critical Look at the Dependent Variable,” Journal of Marriage and the Family, 45 (1), 141–51. O’Connor, Marc, Dan Cosley, Joseph A. Konstan, and John Riedl (2001): “PolyLens: A Recommender System for Groups of Users,” in Proceedings of the Seventh European Conference on Computer Supported Cooperative Work. Norwell, MA: Kluwer Academic Publishers, 199–218. Palmatier, Robert W., Rajiv P. Dant, Dhruv Grewal, and Kenneth R. Evans (2006), “Factors Influencing the Effectiveness of Relationship Marketing: A Meta-Analysis,” Journal of Marketing, 70 (October), 136–53. Popescu, George and Pearl Pu (2011), “Group Recommender Systems as a Voting Problem,” Swiss Federal Institute of Technology in Lausanne, (accessed August 2, 2011), [available at http:// hci.epfl.ch/projects/GroupFun/Group%20recommender% 20systems%20as%20a%20voting%20problem.pdf]. Quijano-Sánchez, Lara, Juan A. Recio-García, Belén Díaz-Agudo, and Guillermo Jiménez-Díaz (2011), “Happy Movie: A Group Recommender Application in Facebook,” in Proceedings of the Twenty-Fourth International Florida Artificial Intelligence Research Society Conference. Menlo Park, CA: Association for the Advancement of Artificial Intelligence, 419–20. Raghunathan, Rajagopal and Kim Corfman (2006), “Is Happiness Shared Doubled and Sadness Shared Halved? Social Influence on Enjoyment of Hedonic Experiences,” Journal of Marketing Research, 43 (August), 386–94. Rao, Vithala R. and Joel H. Steckel (1991), “A Polarization Model for Describing Group Preferences,” Journal of Consumer Research, 18 (1), 108–118.
Solomon, Michael R. (1986), “The Missing Link: Surrogate Consumers in the Marketing Chain,” Journal of Marketing, 50 (October), 208–218. Spanier, Graham B. (1976), “Measuring Dyadic Adjustment: New Scales for Assessing the Quality of Marriage and Similar Dyads,” Journal of Marriage and the Family, 38 (1), 15–28. Steckel, Joel H., Russell S. Winer, Randolph E. Bucklin, Benedict G.C. Dellaert, Xavier Drèze, Gerald Häubl, et al. (2005), “Choice in Interactive Environments,” Marketing Letters, 16 (3/4), 309–320. Unger, Lynette S. and Jerome B. Kernan (1983), “On the Meaning of Leisure: An Investigation of Some Determinants of the Subjective Experience,” Journal of Consumer Research, 9 (4), 381–92. Wayne, Sandy J. and Gerald R. Ferris (1990), “Influence Tactics, Affect, and Exchange Quality in Supervisor–Subordinate Interactions: A Laboratory Experiment and Field Study,” Journal of Applied Psychology, 75 (5), 487–99.
Weinberg, Charles B. (2003), “Profits Out of the Picture: Research Issues and Revenue Sources Beyond the North America Box Office,” working paper, Sauder School of Business, University of British Columbia, (accessed June 13, 2010), [available at http://www.sauder.ubc.ca/Faculty/People/Faculty_Members/~/ media/Files/Faculty%20Research/Publications/Weinberg%20%20Profits.ashx]. West, Patricia M. (1996), “Predicting Preferences: An Examination of Agent Learning,” Journal of Consumer Research, 23 (1), 68–80. Ying, Yuanping, Fred Feinberg, and Michel Wedel (2006), “Leveraging Missing Ratings to Improve Online Recommendation Systems,” Journal of Marketing Research, 43 (August), 355–65.
Automated Group Recommender Systems / 109