cellphone camera readers1, tags for augmented reality applica- tions [3], and the ..... codes can be matched with the li
Capturing Images with Sparse Informational Pixels using Projected 3D Tags Li Zhang1∗ 1 University
Neesha Subramaniam2
of Wisconsin–Madison
Robert Lin3
Shree Nayar3
2 Google Inc. 3 Columbia University 4 Mitsubishi Electric Research Laboratories http://www1.cs.columbia.edu/CAVE/projects/photo tags
A BSTRACT In this paper, we propose a novel imaging system that enables the capture of photos and videos with sparse informational pixels. Our system is based on the projection and detection of 3D optical tags. We use an infrared (IR) projector to project temporally-coded (blinking) dots onto selected points in a scene. These tags are invisible to the human eye, but appear as clearly visible time-varying codes to an IR photosensor. As a proof of concept, we have built a prototype camera system (consisting of co-located visible and IR sensors) to simultaneously capture visible and IR images. When a user takes an image of a tagged scene using such a camera system, all the scene tags that are visible from the system’s viewpoint are detected. In addition, tags that lie in the field of view but are occluded, and ones that lie just outside the field of view, are also automatically generated for the image. Associated with each tagged pixel is its 3D location and the identity of the object that the tag falls on. Our system can interface with conventional image recognition methods for efficient scene authoring, enabling objects in an image to be robustly identified using cheap cameras, minimal computations, and no domain knowledge. We demonstrate several applications of our system, including, photo-browsing, e-commerce, augmented reality, and objection localization. Keywords: Optical tags, infrared tags, projected fiducial markers, temporal coding, tagged pixels, browsing, tracking, retagging, mixed and augmented reality. 1 I NTRODUCTION Digital cameras, from professional SLRs to cellphone cameras, have become ubiquitous in daily life. Today, cameras are being used not only for photography but also to access information. For example, some cellphone cameras enable a user to take images of bar-codes (see Figure 1) and obtain information regarding the objects they are attached to. The appearance of a bar-code in an image depends on its distance and inclination with respect to the camera as well as the illumination conditions. Given the limited resolution, dynamic range, and depth of field of a camera, it is difficult to reliably detect bar-codes from images taken from arbitrary viewpoints and distances [2]. To address this issue, the SONY ID CAM system [9] uses blinking LEDs that are attached to surfaces of objects in the scene. Each LED sends a unique temporal code that reveals the identity of the object it is attached to. Since the LEDs appear simply as blinking dots to a camera, they are much easier to detect over a wide range of viewpoints and distances. A major limitation of this approach is that it requires physically installing electronics and power sources on the objects. In this paper, we propose the use of active illumination to create optical (“virtual”) tags in a scene without making physical contact with, or alterations to, the objects in the scene. Our basic idea is simple: We use an infrared (IR) projector to project temporallycoded (blinking) dots onto selected points in a scene. These tags are invisible to the human eye, but detected as time-varying codes ∗
[email protected],
Ramesh Raskar4
[email protected],
[email protected]
Figure 1: Some cellphones can read a bar-code and search for product information online. The user can then choose to purchase the item (from Amazon Mobile, 2004). The optical tag projection and detection method described in this paper enables the same functionality, but without physically attaching hardware tags on objects.
by an IR-sensitive photo detector. As a proof-of-concept, we have implemented a prototype camera system (consisting of an off-theshelf camcorder and a co-located IR video camera) to simultaneously capture visible and IR images. In a tagged scene, this camera can acquire photos as well as videos (taken as the camera moves) with tagged pixels. In Figure 2, we show examples of images with tagged pixels captured using our system. Each detected tag (green dot) carries information about the 3D location of the tag and the identity of the object it falls on. By using the 3D positions of the detected tags in a single image, a user camera can robustly and efficiently estimate its pose. This pose information is used to compute the 2D coordinates of the invisible tags in the scene on the captured image. The invisible tags include ones that are occluded in the scene (red dots) as well as ones that lie outside the field of view of the camera (blue dots). Such a functionality is very difficult, if not impossible, to achieve by using traditional physical tags (e.g., LED tags) that do not convey 3D information. To handle scenes in which objects can change locations, the tag projection system can detect the new locations of the objects of interest and automatically change the locations of the projected tags such that they remain attached to the objects. This is achieved by augmenting the tagging projector with a video camera that monitors the scene and detects the moving object using image-based object recognition methods. Note that in this case the recognition is performed by the tagging system and not the user camera. Our paper includes the following major contributions. Projected Tags: We introduce an optical tagging approach using temporally-coded IR projection that enables identifying and localizing objects without installing hardware tags. 3D Tagging: By augmenting 3D position to each tag, we demonstrate a tag detection method that reveals both visible and invisible objects in a captured image. Tag Tracking: We present a tracking method that matches temporal codes over multiple frames when a user camera moves, enabling tagging a video. It is worth noting that, while we demonstrate the 3D tagging and tag tracking methods using projected tags, these two ideas can also be applied to LED tags as well, if physical modification of a scene is reasonable. From the perspective of users, the proposed approach has several significant advantages. It enables one to obtain detailed information regarding objects in an image taken from an arbitrary location using inexpensive cameras and minimal computa-
(a)
(b)
(c)
Figure 2: Illustration of photo-browsing using tagged pixels. (a-c) Photos acquired with tagged pixels include visible tags (green dots), occluded tags (red dots), and tags that lie just outside the field of view (blue dots). Each tag has a unique code that reveals the identity and 3D location of the object it falls on. By clicking on the red dot on the white unicorn’s mouth in (a), which corresponds to an occluded grey raccoon, one gets a better view of the raccoon in (b). Similarly, by selecting the red dot on the duck’s head in (b), one gets a better view of the pink elephant in (c).
tions. Furthermore, no domain knowledge of the object appearance is required at the user camera end, even when the objects are partially or completely occluded. All of these benefits come at a cost – the infrastructure needed to project optical tags in an environment. We demonstrate several applications of our method using a variety of scenarios. These include exploring paintings and sculptures with photos taken in a museum, purchasing toys using photos taken in a retail store, finding books by taking a picture of a bookshelf in a library, and exploring the anatomy of the human brain by capturing tag-augmented videos of a brain model. Please visit http://www1.cs.columbia.edu/CAVE/projects/photo tags to see the videos and demos of these applications. We conclude the paper with a detailed discussion of the limitations of our approach. 2
R ELATED W ORK
In this section, we review other tagging methods for object recognition and localization and discuss the computer vision techniques upon which we build our system. A large number of tagging systems have been implemented for object identification and localization. Examples include traditional bar-codes for dedicated scanners [10], the QR Code designed for cellphone camera readers1 , tags for augmented reality applications [3], and the blinking LEDs used by the Sony ID CAM system [9]. Radio Frequency Identification (RFID) tags [15] can be used to determine the presence of an object within a certain range, but do not reveal its location. This limitation of RFID tags has been addressed by attaching a photosensor to the object [12, 7]. All these systems require attaching physical tags to objects in a scene. In contrast, our optical tags are projected onto the scene and do not require one to make physical contact with, or alterations to, objects in the scene. While tagging a scene, we use a structured light approach for computing the 3D positions of the tags. Structured light is a wellknown technique for 3D shape acquisition – see [13] for an excellent survey. We generalize the idea of structured light to the domain of object recognition. In addition to coding rays in 3D space, we use the codes to convey object identity. In traditional structured light, establishing correspondence between projected patterns is difficult when the scene changes over time. Hall-Holt and Rusinkiewicz [4] address this issue by tracking projected stripe boundaries over time. In the first part of our work, we assume that the scene is static while the user’s camera may move during image/video capture. Each tag detected in the IR spectrum is tracked using motion estimated from visible-light images. In the second part of our work, we consider the case where scene objects may change location. This case is handled by the tagging system by using object recognition to find the new locations of the objects and moving their tag locations accordingly. 1 http://www.denso-wave.com/qrcode/index-e.html
We also show that the informational pixels produced by our method can enhance photo-browsing. This application is similar to the 3D photo tourism system developed by Snavely et al. [14]. In their work, the camera pose is estimated using structure from motion techniques, assuming the photo contains enough appearance features. The estimated pose is used to propagate user annotations through the photos. In our work, since we know the 3D tag locations, we can efficiently compute the camera pose without feature extraction and matching. Moreover, the annotations are directly obtained from the detected tags. These benefits of our approach however come with a price – we require infrastructure and an authoring process for tagging a scene. 3 TAGGING A T HREE -D IMENSIONAL S CENE Temporal Codes: To generate optical tags that are robust for scenes that may have large color variations, we use binary (black and white) temporal codes for the tags. The tags appear simply as blinking dots, which puts minimal requirements on the resolution and dynamic range of user cameras for robust tag detection. There is a large body of work on binary codes in coding theory; we choose to use the “run-length limited codes” [11]. Specifically, we avoid codes with a large number of consecutive ones. This is because a very bright spot (e.g., a highlight) in the IR spectrum may be mistaken as a tag that is “ON.” Limiting the maximum number of consecutive ones forces a tag to “blink,” which disambiguates it from bright spots in the scene. We also avoid using binary sequences with a large number of consecutive zeros. This is because, to detect tags in videos taken when the user camera moves, we need to track tags over multiple frames. Limiting the maximum number of consecutive zeros reduces the chance of losing track of tags. Finally, since the codes are projected periodically and the camera does not know the starting bit of the code, all bit sequences that are circular shifts of each other (e.g., 0001010 and 0010100) are represented by a single code. In short, the number of available codes of length L L are on the order of 2L ; with 30 bits, we can encode millions of unique tags. In the experiments reported here, we only use 15-bit codes with a maximum of 4 consecutive zeros and ones. Tagging System: We build a projector-camera system to tag a 3D scene using our temporal codes. Our system consists of an IR projector, an IR camera, and a color camera, as shown in Figure 3(a). Our IR projector is a modified version of an NEC LP260K DLP projector. We have removed its color wheel so that its output has the full spectrum of the projector lamp. An IR-pass filter (B+W 092) is attached in front of the projector lens to block out the light projected in the visible spectrum2 . The IR camera is a Basler A301f monochrome camera with the same IR filter attached to its lens. The 2 Note that our projector is not meant for IR projection. Hence, its power in the IR spectrum is relatively low. With the advent of LED projectors, one can create a powerful IR projector by replacing its visible light LEDs with
IR Camera
Color Camera IR Projector
Color Camcorder
IR Camera Cold Mirror
(a) Figure 4: A hybrid camera for capturing images with tagged pixels.
(b)
(c) 4
Z 2 0
(a)
6 5.5
Y
5 4.5
-1.5 -1 -0.5 0 0.5 1.0 1.5
X
(d)
(e)
Figure 3: The 3D tagging system and the authoring procedure. (a) The tagging system consists of an IR projector with a co-located color camera and an IR camera. An image from the color camera is used to select scene points for tagging. The IR camera has a different viewpoint from the projector and is used to estimate the 3D positions of the tags. (b) An image used to select scene points (white dots) for tagging. (c) The corresponding tag locations in the projector image. (d) One image (contrast enhanced for illustration) from the sequence captured by the IR camera, in which the tags are clearly visible. (e) The computed 3D coordinates of the tags.
(b)
Figure 5: Illustration of patch detection. (a) An input IR image (contrast-enhanced for illustration). (b) The result of peak detection applied to (a). Red regions are ones that have larger intensity values than their surroundings. Only regions with areas below a threshold are considered as candidate patches. Their centroids (cyan asterisks) are used to represent their locations.
using a cold mirror (Edmund OpticsTM , NT43-962). This mirror reflects visible light into the camcorder and passes infrared scene radiation through to the IR camera. Although this is a customized imaging system, it can be implemented in a cost effective manner3 . By selecting the appropriate operating mode of the camcorder (high resolution stills or VGA resolution videos), one can capture photos or videos with tagged pixels. Here, we will first focus on the capture of tagged photos and later discuss tagged videos in Section 4.5. 4.2 Tag Detection Algorithm
color camera is a PointGrey Dragonfly and it is almost co-located with the IR projector. Authoring Procedure: Figures 3(b-e) illustrate the authoring process. We start by taking an image of the scene using the color camera. The scene points to be tagged are selected by simply clicking on this image, as shown in Figure 3(b). The selected image points are mapped to the corresponding points in the projector image (see Figure 3(c)). Next, we compute the 3D coordinates of the tagged scene points. This is done by projecting the temporal codes onto the scene and capturing a short video using the IR camera. One frame of this IR video is shown in Figure 3(d), contrast-enhanced for illustration. In the IR video, we detect the tags using an algorithm that we will describe in Section 4. Given the tag locations in both the projector and IR camera images, the 3D positions of the tags, shown in Figure 3(e), are computed using the triangulation method described in Appendix A. This concludes the authoring process. 4
C APTURING I MAGES WITH TAGGED P IXELS
4.1 A Tag-Enabled Camera To capture tagged photos, the user camera must be able to acquire a color photo and an IR video, simultaneously. As a proof-ofconcept, we have constructed the hybrid camera shown in Figure 4 for this purpose. This camera consists of a Panasonic PV-GS 180 consumer camcorder and an IR camera identical to the one used for authoring. The optical centers of the two cameras are co-located by IR ones.
To capture a tagged photo, the user takes a still picture using the Panasonic camcorder and at the same time captures a 15-frame IR video. For ease of description, we will first assume that the IR camera is synchronized with the projector, and then discuss the unsynchronized setting. Our tag detection algorithm has the following three stages. Patch Detection: In the first stage, we seek to detect all projected tag patches in each frame independently. Since a projected patch should produce a local intensity peak, we first detect regions that have larger intensity values than their neighborhood. This can be done efficiently using the Matlab function ImageExtendedMax. For the IR image shown in Figure 5(a), the peak detection result is shown in Figure 5(b), where the red regions are the detected ones. Notice that some of the regions have very large areas. These are eliminated using an area threshold. The remaining regions, marked with cyan asterisks at their centroids in Figure 5(b), are assumed to be candidate patches. Note that although a few spurious regions are detected, all the projected patches are found. Patch Matching: In the second stage, we connect the detected patches over the 15 captured frames to generate temporal codes. Specifically, for each patch a in the first frame, we look for the closest detected patch a′ in the second frame. If the distance be3 Most cameras in the market today use CCD or CMOS chips that are sensitive in both visible and IR spectra and hence could be used in our approach if an IR channel were available in addition to the RGB channels. This could be done, for instance, by replacing the R-G-G-B color mosaic found on most image detections with an R-G-B-IR mosaic.
Albedo Surface with Different Albedos 0 1 2 3 4 5 6 7 8 9 10 Ambient
0
0.1
0.2
0.3
0.4
0.5
0.6
0.7
0.8
0.9
1.0
100%
1
0%
99.6% 100%
100%
100%
100%
100%
100%
100%
100%
2
0%
99.1% 100% 99.8% 100%
100%
100%
100%
100%
100%
100%
3
0%
99.1% 99.7% 100%
100% 99.9% 100%
4
0%
99.3% 99.3% 100% 99.8% 99.5% 99.3% 100% 99.6% 100%
5
0%
99.2% 99.7% 99.8% 100% 99.6% 99.4% 99.3% 99.2% 99.6% 100%
(a)
100%
100% 99.8% 99.9% 100%
(b)
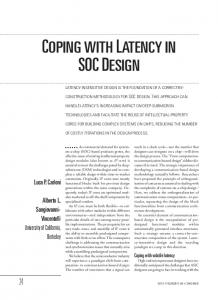
Figure 6: Tag detection rates for different combinations of ambient illumination and surface albedo.
Board
α
α
θ
User Camera Projector
θ
0
15
30
45
60
75
0
100% 99.8% 100% 99.8% 100% 96.2%
15
100% 99.9%
30
100%
45
100% 99.8% 99.9% 100%
100%
7.3%
60
97.8% 99.3% 99.7% 100%
100%
4.1%
75
92.6% 99.0% 99.9% 99.4% 97.9%
1.8%
100%
(a)
99.9 100%
100%
100% 89.9%
100% 98.9% 45.1%
(b)
Figure 7: Tag detection rates for different combinations of viewing angle and surface inclination with respect to the projector.
tween a and a′ is within a small threshold, we connect these two patches and assume they belong to the same tag. This threshold is used to account for noise in the tag location that can result from hand-shake during the capture of the 15-frame video. If the patch a does not have a nearby patch in the next frame, we set its code bit to ’0’ in the next frame. If the second frame contains any patch b that does not have a connected patch in the previous frame, we include it as a new tag with bit ’0’ in the previous frame. We apply this procedure to all the 15 frames. The end result is a set of tags, each with a temporal code. Code Verification: In the last stage, we can eliminate spurious tags by ensuring that each detected temporal code satisfies the code constraints we have imposed, namely, that each code cannot have more than M consecutive zeros and N consecutive ones (M = N = 4 in our codes). Since the capture of the IR video can begin at an arbitrary time, we do not know the start bit associated with the tags. However, this is not an issue because one of our code constraints is that all codes that are circular shifts of each other are represented by a single code. The above verifications are almost always adequate for obtaining a correct set of tag codes. In some scenarios, such as photos taken in a single site (a museum, for instance), one can get a complete list of the codes used at the site. In this case, the detected codes can be matched with the list and those that do not belong to the list can be eliminated. 4.3 Handling Synchronization The above algorithm works fine if the projector and the user camera are synchronized. This, however, is not a practical assumption. To address this issue, we assume that the user camera operates at 30fps and we project the code patterns at 15fps to avoid temporal aliasing. The user camera takes 30 consecutive frames and these are divided into two sets: one with odd-index frames and the other with evenindex frames. If the user camera and the projector were synchronized, both these sets would be identical in terms of the clarity of the projected patterns. When the two devices are not synchronized, one of these two sets will have clear images of the projected patterns, but the other will contain ghosting effects due to intra-frame transitions. For all candidate patches that have been detected (in the first stage of the tag detection algorithm), we simply compute their brightness variances over time for each of the two image sets. The set without intra-frame transitions will have a greater variance and is used in tag detection.
4.4 Robustness of Tag Detection We now evaluate the robustness of our tag detection algorithm with respect to surface albedo, ambient lighting, viewing direction, and surface inclination. For the albedo and ambient lighting tests, we made a surface with varying albedo by attaching a sheet of paper with 11 different printed shades of gray on a flat board (see Figure 6(a)). The projector and the camera were placed roughly 3 meters from the board. To control the ambient lighting, we turned on a set of fluorescent ceiling lights and varied the brightness levels (increasing from 1 to 5) of two halogen lamps. We repeatedly projected 1000 unique tags on the board and Figure 6(b) summarizes the detection rates for many different combinations of surface albedo and ambient lighting. This table shows that our tag detection is quite robust to ambient lighting and surface albedo, except when albedo is zero. Next, we evaluate the robustness of tag detection with respect to the viewing angle α and surface inclination θ (see Figure 7(a)). In this case, we used a surface albedo of 0.7 and ambient lighting of 3 (see Figure 6(b)). Figure 7(b) shows the detection rates for various combinations of α and θ . We see that detection works quite well for a wide range of configurations. The performance begins to fall when the projection angle approaches the grazing angle and the surface is viewed head-on. In this case, the projected patch is severely stretched on the surface and produces a large and dim patch in the image. 4.5 Handling Camera Motion: Capturing Tagged Videos A user can also capture videos with tagged pixels. Specifically, after setting the Panasonic camcorder in video mode, the user can move the hybrid camera around an object or pan it across a scene. In this case, the tags in the IR images will move with time, and this motion is considerably larger than that due to hand-shake when a still photo is captured. Therefore, we need a more robust patch matching method for detecting tags in videos. For ease of description, we consider the situation where the projector and the user camera are synchronized; the lack of the synchronization is resolved by applying the method in Section 4.3 after the tags are registered using the method described below. Now, we have an L-frame color video segment {Ct } and an L-frame IR video segment {It }, where t = 1, 2, · · · , L (L = 15 in our implementation). These two videos are captured from identical viewpoints, since the color and IR cameras are co-located. We seek to compute tags for each color image Ct using the IR segment {It }. Our solution uses the three stages described in Section 4.2 for the still photo case: patch detection, patch stringing, and code verification. The first and the third stages remain the same, but to string patches in a video, we need to know each patch’s motion between neighboring frames. This motion is difficult to estimate using the IR images because most of the pixels are dark and the projected patches appear and disappear in an unpredictable manner. Fortunately, since the IR video and color video share the same optical center, we can use the color video for motion estimation. The precise motion of a patch is hard to determine as it depends on scene geometry (which is unknown even for the tagged points until the tags are detected). Since the patch motions are only used to aid
H2,3
H14,15
IR Sequence Color Sequence
H1,2
... ... frame 1
frame 2
frame 3
frame 15
Figure 8: Illustration of tag detection for a video taken as the user camera moves. The top row shows a few frames of the captured color video. We first compute the homographies between neighboring frames in this video. The bottom row shows the corresponding IR frames with four of the detected tags. (Other tags are not shown to reduce clutter.) The green circles are the locations of detected patches. The red circles are estimates of where the tags are located in the frames in which the tag is not activated (code bit of 0). These locations are determined from the green circles and the inter-frame homographies. The code of each tag is obtained by stringing its green and red circles.
xg = [xg , yg ]T be the location of detected tag g in the IR image, and Xg = [Xg ,Yg , Zg ]T be its 3D scene coordinates. Given all xg and Xg , we compute the 3 × 4 camera projection matrix P = [pi j ] using the linear 6-point method described in [5]. The matrix P maps the tags from the 3D scene to the 2D image as x=
4.6 Finding Occluded and Outside-View Tags The tags that are detected for a given photo are called visible tags. From these tags, we can efficiently compute the camera’s pose since the 3D coordinates of all tags are known. Specifically, let 4 Using homography to approximate pixel motion between two images is a well-established method in computer vision, often referred to as the plane+parallax method [6]. This approximation is especially effective for distant scenes or when the viewpoints of neighboring images are close, which is almost always the case in a captured video. In the presence of significant parallex, i.e., a complex object with large depth variation, homography may be a poor approximation. In that case, we can use Fundamental matrix [5] to model the interframe motion. However, in our experiments, we found homography is sufficient.
p21 X + p22Y + p23 Z + p24 p11 X + p12Y + p13 Z + p14 ,y = . p31 X + p32Y + p33 Z + p34 p31 X + p32Y + p33 Z + p34
In Figure 9, we show statistics of the reprojection error for the estimated pose using the detected tags in the brain video shown in Figure 8. A majority of the errors are below 0.5 pixels, which is comparable to typical pose estimation results in computer vision obtained by using features extracted from conventional images. The computed projection matrix P allows us to project other tags that are not detected onto the captured image. If these tags are in the field view of the image, we call them occluded tags. If they are outside the field view of the image, we call them outside-view tags. Next, we show how visible, occluded, and outside-view tags can be used to interact with collections of photos and to automatically augment videos with information. RMS Reprojection Error
patch stringing, we use a homography transformation to approximate patch motions between neighboring frames.4 Specifically, the homography transformation between two images is represented by a 3 × 3 matrix H = [hi j ]. Using H, a patch’s motion between the two images is approximated as x′ = h11 x+h12 y+h13 ′ h21 x+h22 y+h23 T ′ ′ T h31 x+h32 y+h33 , y = h31 x+h32 y+h33 , where [x, y] and [x , y ] are the locations of the patch in the two images. We estimate the homography between each pair of neighboring color images using the RANSAC method [5]. This method requires as input a set of matched interest points extracted from the two images. We obtain this set by applying the SIFT operator [8] to the color images. During each iteration of RANSAC, we use the 4-point inhomogeneous method to compute the homography [5]. At the end, we obtain homography estimates that are robust to spurious interest point matches. Given the homographies between all pairs of neighboring frames, we can extend the patch stringing stage in Section 4. Consider two neighboring frames. For each patch a in the first frame, we first transform it to the second frame using the estimated homography. Let a˜ be the transformed patch. We then search for the nearest patch a′ to a˜ in the second frame. If the distance between a˜ and a′ is within a threshold, we assume a and a′ belong to the same tag. Otherwise, we set the code bit to ’0’ for tag a in the second frame. If there is any patch b in the second frame that is not matched to a patch in the first frame, we treat it as a new tag with bit ’0’ in the first frame. In this case, we transform the location of b to the first frame using the inverse of the homography between the two frames. Figure 8 illustrates the above process using the color and IR videos captured by moving the hybrid camera around a human brain model.
1
2
0.8
1
0.6
Unit: Pixels
0
0.4 0.2 0
-1 50 100 150 200 250 Frame Number
-2 -2
-1
0
1
2
Figure 9: Statistics of the reprojection error for pose estimation using the detected tags in the brain video in Figure 8. Left: the RMS reprojection error over time. Right: the distribution of the retrojection error for all the 225 frames in the video.
5
A PPLICATIONS OF TAGGED P IXELS
5.1 Photo Browsing We have developed a novel interactive viewer called PhotoTags for browsing collections of tagged photographs. Its interface was developed using Macromedia Flash 8 and programmed using ActionScript 2.0. In a real application, PhotoTags can be exported to the web, where it can accept uploaded photos and their associated
(a)
(c)
(e)
(b)
(d)
(f)
(h)
(g)
Figure 10: PhotoTags: An interactive viewer for browsing and searching collections of photos with tagged pixels.
tag codes and then augment 3D tag locations and details about the tagged objects to the photos.5 When the user selects a photo, the viewer shows the photo with all its tags. The detected visible tags are shown in green, while the projected occluded and outside-view tags are shown in red and blue, respectively. As shown in Figure 10(a), the list of the tagged objects appears on the right and a slider with all the photos in the folder appears at the bottom. When the user rolls over a tag, a brief description is displayed. As shown in (b), if the user clicks on the Egyptian vase, a detailed description of the vase and a thumbnail of its best view (in which the object appears closest to the center of the image) are displayed on the right. On choosing the thumbnail of the best view, it appears at higher resolution in the main window of the viewer, as shown in (c). At the same time, the slider automatically gets reordered according to the proximity of the object’s tag to the center of the view. This allows the user to select the next best view of the same object, as shown in (d). By clicking on the outside-view blue tag for the Nefertiti bust seen in Figure 10(d), details about the bust and its best view can be seen, as shown in (e). The red tag in this view of the bust corresponds to a clay vase that is occluded by the bust. Clicking on this tag brings up an unobstructed view of the vase, as shown in (f). This view includes a painting by Monet. All the photos with Monet paintings can be found by using the search box at the top right corner of the viewer. The search results are ordered according to the number of times the desired object appears in the photo, as shown 5 We call PhotoTags an offline application, as it augments 3D and meta information after the images are taken. For online applications where a user wants to see the 3D and meta information in real time, these information can be stored in physical media (e.g., flash drives) and provided to the user in the field.
in (g). By clicking on one of the search results, one can view it at higher resolution in the main window, as shown in (h). Figure 2 shows three among several photos taken in a toy store scenario. This example shows how tagged pixels enable a shopper to simply capture photos at the store and later find detailed information regarding the toys and purchase the most desirable one. 5.2 Video Augmentation We can also use tagged pixels in a video for augmented reality. Figure 11 shows three frames of a tag-augmented video of the human brain model in Figure 8. In each frame, the detected (green) and occluded (red) tags are used to index a database of the names of the various parts of the human brain. These names are overlaid on the frame. The layout of the names are manually adjusted to avoid clutter for illustration purposes. In Figure 11(a), the Crescentic Lobe happens to be occluded.6 To get an unobstructed view of this part, the user simply clicks on its tag. Then, the video fastforwards to the first frame in which the tag becomes visible, which is shown in Figure 11(b). Similarly, by clicking on the occluded tag for the Quadratus Cerebelli in this frame, the video is advanced to the frame in Figure 11(c) in which it is visible. 6
AUTOMATIC R ETAGGING OF C HANGING S CENES
Thus far, we have assumed that the tagged objects in a scene do not move after the scene has been authored. Although this assumption is valid in many scenarios, such as museums with paintings and sculptures and shops with large objects such as furniture, there 6 The visibility of the tag and the visibility of the object to which the tag is attached are different, because the object is larger. In practice, we associate each object with several tags, and the occlusion of an object can be well-approximated by the occlusion of the tags.
Longitudinal Fissure Occipital Lobe
Frontal Lobe
Longitudinal Fissure
Longitudinal Fissure Occipital Lobe
Frontal Lobe
Frontal Lobe Quadratus Cerebelli
Truncus Corporis
Quadratus Cerebelli
Truncus Corporis
Cerebral Posterior Left Hemisphere Sinus Rectus
Occipital Lobe
Truncus Corporis Sinus Rectus
Cerebral Posterior
Left Hemisphere
Temporal Lobe
Quadratus Cerebelli
Sinus Rectus Temporal Lobe
Cerebral Posterior
Lobulus Simplex Mandibular Crescentic Lobe
Left Hemisphere
Temporal Lobe Lobulus Simplex
Mandibular
Mandibular
Crescentic Lobe Crescentic Lobe
(a)
(b)
Lobulus Simplex
(c)
Figure 11: Interacting with Tagged Videos. Using the detected tags, the video is augmented with visible (green dots) and occluded (red dots) tags as well as the names of the parts of the brain the tags correspond to. (a) In this frame, the Crescentic Lobe is occluded. By clicking on the corresponding tag, the video quickly advances to the first frame in which the tag for the Crescentic Lobe is visible, which is shown in (b). If the occluded tag for the Quadratus Cerebelli is selected in this frame, the video advances to the frame shown in (c), in which it is visible.
(a)
(c)
(b)
Figure 12: Automatic Retagging of a Changing Scene. (a) The color image used for the initial authoring of books on a shelf. For each book, a tag location and a descriptive appearance feature (rectangular box) on the book are selected. (b) An image of the shelf taken by the authoring system after the books have been moved. By applying appearance matching, the system automatically finds the four books that have moved and changes their tag locations. In this image, the tags of the remaining books are not shown for clarity. (c) A person wanting to find a book on the shelf takes a photo with tagged pixels (green dots) and simply runs a search for the desired book.
are other settings where the objects may move. For example, in a library, books are taken off the shelf and put back in a different place, possibly changing the locations of all the books on the shelf. To handle scenes where the tagged objects may change location, we use appearance-based matching for automatic retagging. We use the example of books on a shelf to describe our method. As shown in Figure 12(a), after the initial authoring, each book is assigned a tag and a descriptive appearance feature (rectangular box) on its ridge. Later, a person browsing the books may change their locations on the shelf. The authoring system detects a change in the bookshelf by continuously checking if all the appearance features are in their initial locations. When a change is detected, the new locations of all the moved appearance features are found by template matching and the books are retagged, as shown in Figure 12(b). As an application, a person who wishes to find a specific book on the shelf can simply take a photo of the shelf using a tagenabled camera, and the location of the book in the captured image will be highlighted if its tag is detected. Otherwise, the camera may prompt its location with respect to its current field of view based on the estimated pose of the camera. The above retagging algorithm is currently in its simplest form. The objects (books) are assumed to translate on a single plane and hence template matching works well. The template matching can also be extended to handle in-plane object rotation or to detect when an object is missing in the scene. However, in the case of a 3D
scene, a more sophisticated image recognition algorithm would be needed to find the objects after they have moved. One obvious question is: If the authoring system can find the books using appearance matching/object recognition, why cannot the user camera do the same? The answer is two-fold: First, the dynamic range and resolution of the user camera may be inadequate for robust appearance matching. For example, in an overview shot of several bookshelves taken by a cellphone camera, the ridge of one book may be only a tiny noisy rectangular region of 10-pixel width. Robust recognition of a book however requires high quality images. Second, the user must have all the appearance features to perform matching, which is not practical in most scenarios. 7
D ISCUSSION
We have presented a novel 3D optical tagging method that enables the capture of photos and videos with a sparse set of informational pixels. This method enables efficient recognition of objects that are in the image as well as of objects that are severely occluded or lie just outside the field-of-view. Such a function is difficult, if not impossible, to accomplish by applying object recognition to conventional photos or by using traditional physical tags that do not convey 3D information. The example applications we have demonstrated include photo-browsing, e-commerce, augmented reality, and objection localization. We now discuss the limitations of
our approach and suggest directions for future work. Specular Reflectance: A key challenge for our method is the tagging of highly specular surfaces. For such surfaces, the tag will be detectable only when the viewing direction of the camera is close to the specular direction. In our system, even if a tag is missing due to surface shininess, the user camera can still infer the missing tag based on its pose estimate and the 3D tag position, although in this case the tag will be mistakenly labeled as an occluded one. In our implementation, we have worked around this issue by tagging a nearby diffuse surface. Projector Brightness Falloff: The brightness of any projector is proportional to 1/r2 , , where r is the distance of the surface from the projector. This fall-off, combined with the fact that our projector is not a real IR projector, limits the working range of our current system to about 5 meters. If a true infrared projector is used in an indoor application, we believe the working range can be extended to 10 meters or more. A typical outdoor scene, however, would require IR laser sources to generate the tags. As a matter of fact, such laser sources have been used in outdoor applications for decades. In late 1970s, the US Army began to use IR beams for combat training. During training, players score points by engaging targets with an IR-emitting targeting device. Both indoor and outdoor toys based on the same concept are also popular7 . Minimum Number of Detected Tags for Pose Estimation: The inference of occluded and outside-view tags is based on camera pose estimation. Our current implementation requires a minimum of 6 tags with known 3D positions to estimate camera pose. However, if a picture contains less than 6 tags, or in the worst case no tags at all, the pose can not be estimated. However, since a projector can be used to generate a very large number of tags, one can tag the scene more densely, i.e., with redudent tags, to reduce the chances of detecting too few tags. In addition, if a user takes multiple images of the same scene and some images do not contain tags due to occlusion, we can estimate the relative poses between these images by matching visual features and using structure from motion methods, therefore “transferring” the pose estimation from images with tags to the ones that do not. Interface Evaluation for Browsing Augmented Scenes: In our current implementation, the visibility of tags is color coded, shown as green dots and red dots. However, this might be confusing. For instance, the fact that occluded points are visible in the viewer could be counter-intuitive – the point looks like it is on the foreground object, and the fact that it is red does not make it immediately clear that it is occluded. It would be desirabe to evalute the effectiveness of different types of interfaces, for example, using α -blending to illustrate occluded tags. Optical Tagging and Recognition: In recent years, object recognition algorithms have made great progress. We believe our optical tagging method can make image recognition practical for a low-cost consumer camera. To recognize an object, we need to know its appearance feature. To recognize many objects, we need to know all their appearance features. It is very demanding for a user camera to know all appearance features of objects in all the possible scenarios he/she may take photos, and to perform recognition with limited computing power and low quality sensors. In contrast, it is much more practical for a place, like a store or museum, to author its scene using dedicated computing power and high-quality cameras and projectors. For a particular scene, the recognition module only needs to recognize the objects that belong to that scene. This makes the search space much smaller and makes recognition much more likely to work robustly. Our method shifts the workload of recognition from the user device to the infrastructure and broadcasts the recognition results through a set of code protocols. We would like to further explore this area, for example, tagging a scene from different viewpoints using multiple projectors. In this 7 http://en.wikipedia.org/wiki/Laser
Tag
case, we need to calibrate the relative locations of the projectors in order to compute the 3D positions of the projected tags in the same coordinate system. Afterwards, our tag detection and pose estimation methods presented in this paper will still apply. The tags projected from different viewpoints will increase the robustness of our tagging system for objects with complex 3D shapes. R EFERENCES [1] J.-Y. Bouguet. Camera Calibration Toolbox for Matlab. http://www.vision.caltech.edu/bouguetj/calib doc/index.html, 2001. [2] D. Claus and A. Fitzgibbon. Reliable Fiducial Detection in Natural Scenes. In Proc. Eur. Conf. on Computer Vision, 2004. [3] M. Fiala. ARTag, a Fiducial Marker System Using Digital Techniques. In Proc. IEEE Conf. on Computer Vision and Pattern Recognition, volume 2, pages 590–596, 2005. [4] O. Hall-Holt and S. Rusinkiewicz. Stripe Boundary Codes for RealTime Structured-Light Range Scanning of Moving Objects. In Proc. Int. Conf. on Computer Vision, volume 2, pages 359–366, 2001. [5] R. I. Hartley and A. Zisserman. Multiple View Geometry in Computer Vision. Cambridge University Press, 2000. [6] M. Irani and P. Anandan. Parallax Geometry of Pairs of Points for 3D Scene Analysis. In Proc. Eur. Conf. on Computer Vision, pages 17–30, 1996. [7] J. C. Lee, S. E. Hudson, J. W. Summet, and P. H. Dietz. Moveable Interactive Projected Displays Using Projector Based Tracking. In Proc. ACM Symp. on User Interface Software and Technology, pages 63–72, 2005. [8] D. G. Lowe. Distinctive Image Features from Scale-Invariant Keypoints. Int. J. on Computer Vision, 60(2):91–110, 2004. [9] N. Matsushita, D. Hihara, T. Ushiro, S. Yoshimura, J. Rekimoto, and Y. Yamamoto. ID CAM: A Smart Camera for Scene Capturing and ID Recognition. In Proc. Int. Symp. on Mixed and Augmented Reality, page 227, 2003. [10] A. Q. Morton. Packaging History: The Emergence of the Uniform Product Code (UPC) in the United States. History and Technology, 11(1):101, 1994. [11] V. Pless and W. Huffman, editors. Handbook of Coding Theory. Elsevier, Amsterdam, 1998. [12] R. Raskar, P. Beardsley, J. van Baar, Y. Wang, P. Dietz, J. Lee, D. Leigh, and T. Willwacher. RFIG Lamps: Interacting with a SelfDescribing World via Photosensing Wireless Tags and Projectors. In SIGGRAPH Conference Proceedings, pages 406–415, 2004. [13] J. Salvi, J. Pags, and J. Batlle. Pattern Codification Strategies in Structured Light Systems. Pattern Recognition, 37(4):827–849, April 2004. [14] N. Snavely, S. M. Seitz, and R. Szeliski. Photo Tourism: Exploring Photo Collections in 3D. In SIGGRAPH Conference Proceedings, pages 835–846, 2006. [15] R. Want. RFID, A Key to Automating Everything. Scientific American, 290(1):56–65, 2003. [16] L. Zhang and S. K. Nayar. Projection Defocus Analysis for Scene Capture and Image Display. ACM Trans. on Graphics (also Proc. of ACM SIGGRAPH), 2006.
A C OMPUTING THE 3D C OORDINATES OF TAGS Let xg = [xg , yg ]T and ug = [ug , vg ]T be the locations of tag g in the IR camera and projector images, respectively. Given all xg and ug , we first compute the 3 × 3 fundamental matrix F between the projector and the camera, using the 8-point linear method described in [5]. Then, we calibrate the IR camera using an online software [1] and the projector using the method described in [16]. After these calibrations, we obtain two 3 × 3 intrinsic matrices, K p and Kc , for the projector and the IR camera, respectively. These two matrices relate image points in the two devices to their lines of sight in 3D space. Using K p , Kc , and F, we can estimate the rotation R and the translation o of the camera with respect to the projector, by applying SVD to the essential matrix E = Kc T FK p [5]. Given R and o, we can estimate the 3D location for each tag g by finding the intersection of its lines of sights with respect to the projector and the camera [5].